Sample Category Title
SPX Short Term Analysis Forecasts Bullish Path to 8500
The S&P500 SPX appears to have completed a short term bearish cycle that corrected the rallies from late March 2026. The short term path continues to favor more upside. What are the next targets to take note of. How should intraday and short-term traders approach it?
The SPX completed the intermediate degree wave (2) on March 30, 2026. Since hitting this low, the index has trended higher, consistently attracting fresh buying interest. The broader bullish wave ((3)) began in April 2025 and concluded in February 2026, with the February peak identified as wave (1) of ((3)). A subsequent wave (2) pullback completed a 7-swing structure within the 6508-6298 blue box zone in late March 2026. Members successfully entered long positions at this blue box and achieved all major targets. This post outlines the setup for educational purposes.
SPX Elliott Wave Analysis – Short term, 13th June Update
Starting from the March 2026 low, a new bullish cycle initiated for wave 1 of (3), which peaked in early June. Following this, we observed a pullback for wave 2 of (3). Although we typically anticipate a 3, 7, or 11-swing structure for such corrections, this particular pullback was shallow. We identified the end of this wave based on proprietary signals shared during our live sessions, allowing us to pivot and encourage members to enter long positions within our blue box zones—a strategy that proved successful, as seen in our setup for the Dow_100 ($YM_F) HERE. While the SPX wave 2 pullback did not reach the typical extreme, we chose not to force the count and instead shared the updated analysis with members on June 13, 2026.
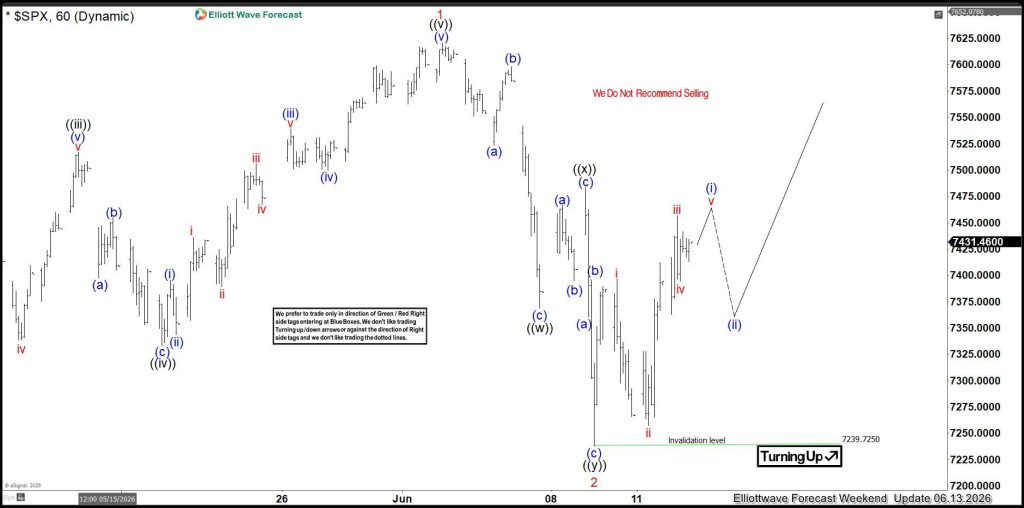
The 60-minute chart above confirms that wave 2 has concluded, signaling an expected bullish reversal. Consequently, we projected a five-wave rally from the 7239 pivot to complete wave (i) of ((i)) of 3. As the new week commenced, the market delivered the anticipated upside burst, which we have detailed in the chart below shared with our members.
SPX Elliott Wave Analysis – Short term, 16th June Update
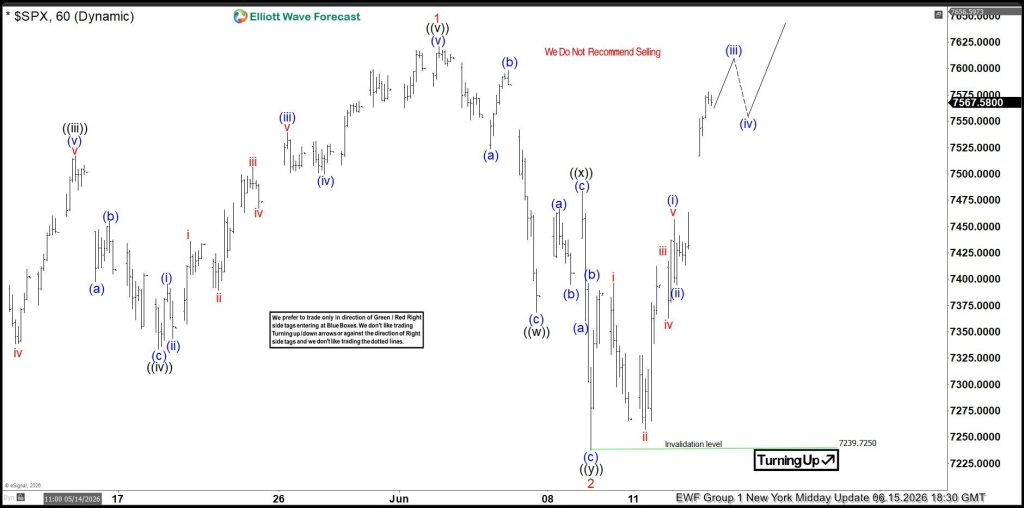
The latest chart indicates that the price is currently advancing within wave (iii) of ((i)), with the potential for wave ((i)) to establish a new high. Following this, we anticipate a pullback for wave ((ii)) before the broader bullish trend resumes. The target for wave 3 is set at a minimum of 8540, with an ideal range of 8846–9344. Once a new high is reached in June, we will look for 3, 7, or 11-swing pullbacks to identify long opportunities in the SPX, as well as in other US indices, the Nikkei, and various other markets we track. We will provide our members with updated “blue box” entry zones when the time is right. Furthermore, our daily technical videos, live analysis sessions, and 24-hour members-only chat room ensure that traders are kept informed of any market shifts and have direct access to our analysts for real-time support.
About Elliott Wave Forecast
At www.elliottwave-forecast.com, we update one-hour charts four times daily and four-hour charts once daily for all 78 instruments. We also conduct daily live sessions to guide clients on the right side of the market. Additionally, we have a chat room where moderators answer market-related questions. Experience our service with a 14-day trial for only $0.99. Cancel anytime.
Cable Remains Constructive Ahead UK CPI Data, BoE Policy Meeting
Near-term recovery from 1.3300 zone higher base has received fresh boost from improving geopolitical picture that sparked risk appetite and deflated dollar.
Although today’s action was limited, Cable remains at the front foot as traders await release of May inflation data on Wednesday (3.0% f/c vs Apr 2.8%), with CPI at/above forecast to add to expectations of BoE rate hike in the near future (the central bank MPC meets on Thursday and is widely expected to keep rates unchanged at 3.75%.
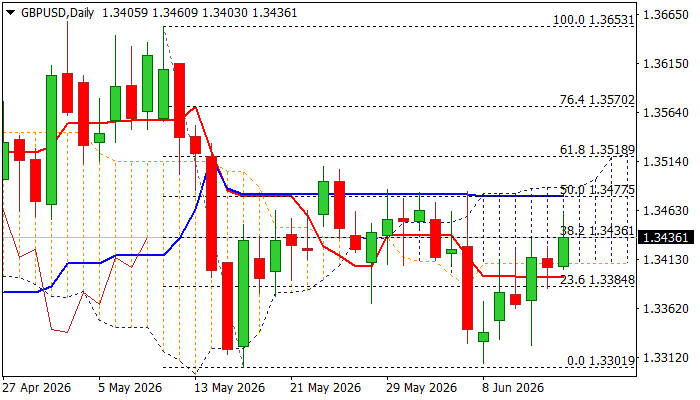
Overall near-term structure is expected to remain biased higher while the price holds above important supports at 1.3415 (200DMA) and 1.3408 (daily cloud base) and keep focus at 1.3477 (50% retracement of 1.3653/1.3301 descend)) and more significant 1.3486 barrier (cloud top), violation of which to add to upside prospects and validate base at 1.3300 zone.
Daily studies are still mixed, but 14-d momentum is about to emerge from negative territory and RSI rises above 50 zone, contributing to positive scenario.
Res: 1.3477; 1.3486; 1.3508; 1.3521
Sup: 1.3415; 1.3408; 1.3362; 1.3341
Eco Data 6/16/26
| GMT | Ccy | Events | Act | Cons | Prev | Rev |
|---|---|---|---|---|---|---|
| 02:00 | CNY | Industrial Production Y/Y May | 4.50% | 4.20% | 4.10% | |
| 02:00 | CNY | Retail Sales Y/Y May | -0.60% | 0.00% | 0.20% | |
| 02:00 | CNY | Fixed Asset Investment (YTD) Y/Y May | -4.10% | -2.00% | -1.60% | |
| 03:19 | JPY | BoJ Interest Rate Decision | 1.00% | 1.00% | 0.75% | |
| 04:30 | AUD | RBA Interest Rate Decision | 4.35% | 4.35% | 4.35% | |
| 05:30 | AUD | RBA Press Conference | ||||
| 06:30 | JPY | BoJ Press Conference | ||||
| 09:00 | EUR | Germany ZEW Economic Sentiment Jun | 10.5 | -6 | -10.2 | |
| 09:00 | EUR | Germany ZEW Current Situation Jun | -81 | -77 | -77.8 | |
| 09:00 | EUR | Eurozone ZEW Economic Sentiment Jun | 9.5 | -7.2 | -9.1 | |
| 12:30 | USD | Building Permits May | 1.41M | 1.42M | 1.44M | 1.42M |
| 12:30 | USD | Housing Starts May | 1.18M | 1.42M | 1.47M | 1.39M |
| 12:30 | USD | Import Price Index M/M May | 1.90% | 0.90% | 1.90% | 2.00% |
| 02:00 | CNY |
| Industrial Production Y/Y May | |
| Actual | 4.50% |
| Consensus | 4.20% |
| Previous | 4.10% |
| 02:00 | CNY |
| Retail Sales Y/Y May | |
| Actual | -0.60% |
| Consensus | 0.00% |
| Previous | 0.20% |
| 02:00 | CNY |
| Fixed Asset Investment (YTD) Y/Y May | |
| Actual | -4.10% |
| Consensus | -2.00% |
| Previous | -1.60% |
| 03:19 | JPY |
| BoJ Interest Rate Decision | |
| Actual | 1.00% |
| Consensus | 1.00% |
| Previous | 0.75% |
| 04:30 | AUD |
| RBA Interest Rate Decision | |
| Actual | 4.35% |
| Consensus | 4.35% |
| Previous | 4.35% |
| 05:30 | AUD |
| RBA Press Conference | |
| Actual | |
| Consensus | |
| Previous | |
| 06:30 | JPY |
| BoJ Press Conference | |
| Actual | |
| Consensus | |
| Previous | |
| 09:00 | EUR |
| Germany ZEW Economic Sentiment Jun | |
| Actual | 10.5 |
| Consensus | -6 |
| Previous | -10.2 |
| 09:00 | EUR |
| Germany ZEW Current Situation Jun | |
| Actual | -81 |
| Consensus | -77 |
| Previous | -77.8 |
| 09:00 | EUR |
| Eurozone ZEW Economic Sentiment Jun | |
| Actual | 9.5 |
| Consensus | -7.2 |
| Previous | -9.1 |
| 12:30 | USD |
| Building Permits May | |
| Actual | 1.41M |
| Consensus | 1.42M |
| Previous | 1.44M |
| Revised | 1.42M |
| 12:30 | USD |
| Housing Starts May | |
| Actual | 1.18M |
| Consensus | 1.42M |
| Previous | 1.47M |
| Revised | 1.39M |
| 12:30 | USD |
| Import Price Index M/M May | |
| Actual | 1.90% |
| Consensus | 0.90% |
| Previous | 1.90% |
| Revised | 2.00% |
Sunset Market Commentary
Markets
Details of the announced interim deal between the US and Iran are still missing and only expected later this week. Based on previously floated versions, both parties will probably aim to restore Hormuz flows within 30 days of the extended ceasefire. The 60-day prolongation changes the narrative from “hoping for a deal” to “hoping that the deal doesn’t derail” as both parties try to tackle Iran’s nuclear ambitions. The lingering threat and the expectation of only a slow return of traffic through the key shipping artery probably help explain the lukewarm market response this morning, albeit after some frontrunning on Friday. Brent crude opened at $83/b from a $87/b close last Friday and still changes hands around that level. Core bond curves bull steepen, with German yields down 5 bps at the front end of the curve and US yields 4 bps lower. UK Gilts outperform (2-year: -6.5 bps). Again, the main move occurred after the European bell, highlighting very cautious investor optimism. EUR/USD spiked from 1.1570 to 1.1620 and remained there throughout European dealings. The EuroStoxx 50 is 1.2% higher, taking out the previous YTD and all-time high at 6200 in the process.
In the absence of key economic data, we look to ECB comments made since last week’s 25 bps rate hike. Overall, they continue to point toward further action, possibly as soon as July. ECB President Lagarde singled out underlying inflation as the key guidepost. June inflation numbers, due on July 1, could be crucial in determining the outcome of the July 23 policy meeting. She vows to kill inflation if it reawakens and considers it a personal duty to complete her mission. She is well aware that letting the inflation genie out of the bottle for a second time would be the biggest possible policy mistake right now. On a side note, she also endorsed more collective Eurozone financing as key to the Savings and Investment Union project. A mutualized debt instrument that brings depth and liquidity to the market is seen as critical for success. Slovak ECB member Kazimir said that the “direction of travel is clear” and favours frontloading the work that needs to be done. The damage in the Middle East cannot be undone overnight, even with a peace framework in place. Reopening Hormuz cannot be compared to simply turning a light switch back on. German Bundesbank President Nagel keeps all options open for the July meeting, as he expects oil supply normalization to take months. Other ECB members, including Rehn, Moulin, Pereira and Kocker, were less outspoken. They suggest further hikes in the coming months but want to see more data, especially regarding second-round inflation effects. The ECB’s wage tracker, due on Wednesday, is one to watch.
News & Views
US President Trump threatened to impose a 100% levy on French wine and champagne exports. In an interview with the New York Post, he criticized France’s 3% turnover tax on technology companies, which typically affects US-based firms the most. French lawmakers had voted in October to double the tax to 6%, but the measure was ultimately vetoed by ministers who feared disproportionate American retaliation. The US market accounts for around one-fifth of sales for the French wine industry. Annual trade is worth more than $2 billion.
The UK’s Rightmove real-estate platform said house prices fell 0.6% m/m in June and were 0.5% lower on an annual basis. It was the largest June decline in 14 years. Rightmove noted that house prices typically rise slightly in June and concluded that this year’s decline reflected many new sellers adjusting prices in response to the record number of homes available for this time of year. Rightmove reported that sales activity remained broadly steady, with buyer demand in May (the latest available data) down 10% y/y but largely consistent with trends seen so far this year. “Higher mortgage rates are continuing to affect activity, while the wider choice of homes for sale is encouraging buyers to take a less urgent approach unless a property really stands out on its price or presentation,” the platform said. Despite this, the number of sales agreed remains broadly in line with recent years and is even 5% above 2023 levels.
Relief Rally Sweeps Markets, BoJ and RBA Kick Off Central Bank Week
Markets are finally getting the outcome they have been hoping for. After months of conflict, Washington and Tehran announced a peace agreement that would bring an immediate end to hostilities, setting the stage for the reopening of the Strait of Hormuz and the gradual restoration of normal oil flows. Investors wasted little time responding. The war premium that has dominated markets for much of the past few months is being unwound at remarkable speed.
The reaction was immediate and dramatic. Brent crude gapped lower at the weekly open and plunged below USD 83 as traders priced in a future of fewer supply disruptions and lower energy costs. Equities surged globally, led by a 5% jump in Japan's Nikkei to a record high. European markets rallied broadly and US futures pointed to strong gains on Wall Street. Even before the agreement receives its formal signature in Switzerland on Friday, investors are already treating peace as the base-case scenario.
Currency markets are sending a similar message. The Dollar is the weakest major currency of the day as defensive positioning is unwound. The Swiss Franc and Euro are leading gains, while the Australian Dollar is benefiting from improving risk sentiment. At the other end of the spectrum, the Yen is under pressure as investors rotate away from safety, while the Canadian Dollar is struggling with the sharp decline in oil prices. The focus has shifted from geopolitical risk to economic normalization.
That shift, however, may only last a few hours. As the Middle East story fades, a wave of central bank meetings is about to take center stage. The Federal Reserve remains the undisputed main event on Wednesday, but the policy cycle begins in Asia with decisions from the Bank of Japan and Reserve Bank of Australia.
The BoJ is expected to deliver a widely anticipated 25 basis point rate hike to 1.00%. Yet the decision itself may matter less than what comes next. With Governor Kazuo Ueda hospitalized, Deputy Governor Shinichi Uchida will front the press conference, and markets are unlikely to receive much clarity on future tightening. Economists broadly expect rates to reach 1.25% later this year and 1.50% next year, but confirmation of that path may have to wait until July's updated forecasts.
The RBA faces a different challenge. After three consecutive rate increases, policymakers are expected to pause at 4.35% and assess whether enough has already been done. The debate inside the market is far from settled. One camp believes slowing economic activity will eventually bring inflation under control without further action. Another points to persistent inflation pressures and increasingly hawkish rhetoric from RBA officials as evidence that additional tightening may still be required. The split is visible in economist forecasts, with nearly half of those surveyed by Reuters expecting rates to move higher again before the year is out.
For now, investors are enjoying the peace dividend. But the next chapter for markets may be written in Tokyo, Sydney and ultimately Washington, where central banks must decide whether the inflation shock left behind by the conflict is truly beginning to fade.
Gold's Bullish Reversal Takes Shape After US-Iran Breakthrough, 4366 Key Test Ahead
Gold has a breakout level. Now it has a catalyst too. After surging above 4,300 on the back of a landmark US-Iran agreement, bullion is approaching key resistance at 4,366. A decisive break could confirm that the fall from 4,889 has ended and shift focus back toward the highs. Read More.
Will the Fed Blink? Markets Enter High-Stakes Week of Global Rate Decisions
The war story may be fading, but the inflation story is just beginning. Five major central banks meet this week, yet the real focus is whether the Fed starts preparing markets for a world with future hikes. Kevin Warsh's first press conference as Fed Chair could set the tone for currencies, yields and equities for months ahead. Read More.
ECB's Lagarde Sees Broader Inflation Effects Despite Iran Peace Progress
Peace may be approaching, but inflation is proving harder to defeat. ECB President Christine Lagarde welcomed the Washington-Tehran agreement while warning that energy-driven inflation is increasingly spreading across the Eurozone economy. Read More.
Eurozone Industrial Production Edges Up 0.1%, Capital Goods Weaken
Eurozone factories are still growing, but not all parts of the economy are moving together. Consumer goods production strengthened in April, yet weakness in capital goods and energy output left overall industrial growth below expectations. The split may offer an important clue about the region's economic recovery. Read More.
EU and Eurozone Trade Balances Slip Into Deficit Amid Strong Import Growth
Europe's trade problem isn't exports. It's imports. Eurozone exports grew a healthy 5.0% in April, but imports rose even faster at 9.3%, pushing the region from a sizeable surplus into deficit. The shift offers a different perspective on the strength of domestic demand. Read More.
New Zealand BNZ PSI Falls to 47.5 as Weak Consumer Spending Deepens Services Slump
New Zealand's services sector is still struggling to regain momentum. The BNZ PSI fell further into contraction territory in May as activity, sales and new orders weakened. Businesses continue to report soft consumer demand and rising costs, suggesting the country's largest sector is yet to benefit from the broader recovery narrative. Read More.
AUD/USD Daily Report
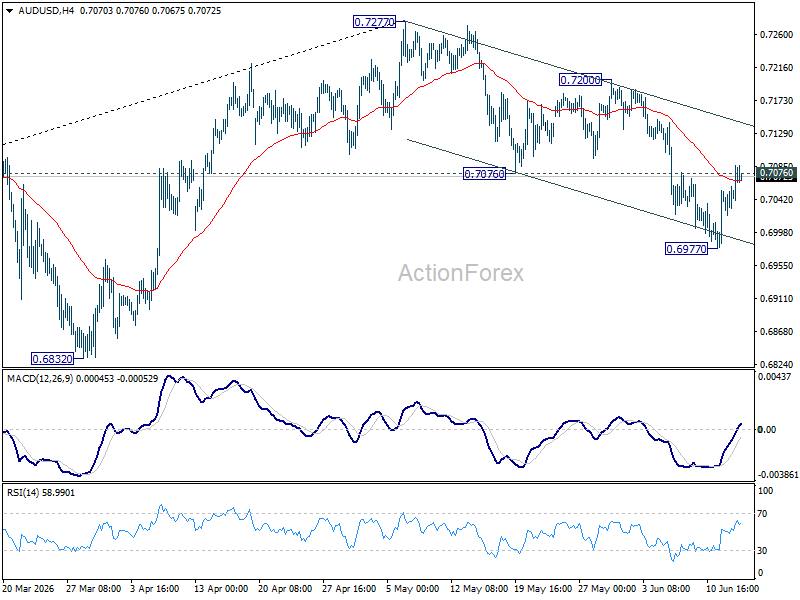
AUD/USD's break of 0.7076 support turned resistance argues that fall from 0.7277 might have completed as as three wave correction at 0.6977. Intraday bias is back on the upside for 0.7200 resistance. On the downside, though, break of 0.6977 will resume the fall towards 0.6832 support.
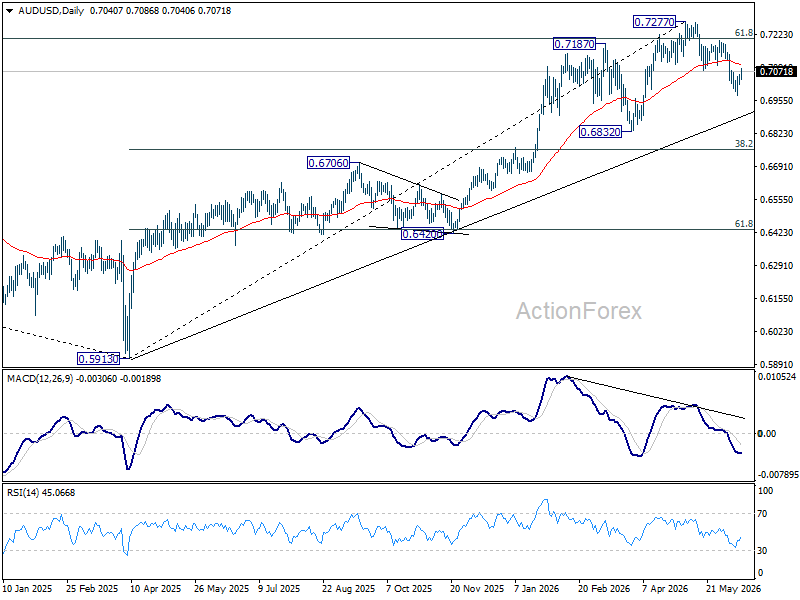
In the bigger picture, considering bearish divergence condition in D MACD, a medium term top could be formed at 0.7277 after failing to sustain above 61.8% retracement of 0.8006 (2021 high) to 0.5913 (2024 low) at 0.7206). Deeper fall could be seen to 38.2% retracement of 5913 to 0.7277 at 0.6756 as a correction. But strong support should be seen there to bring rebound. Consolidations would continue below 0.7277 for a while.
Platinum Elliott Wave View: Double Three Correction in Play
Platinum (PL) surged to fresh record highs in late January, marking a potential inflection point toward a long‑term secular bull market. This article explores the metal’s extended outlook and the evolving Elliott Wave framework that underpins its advance.
Platinum (PL) Monthly Elliott Wave Chart
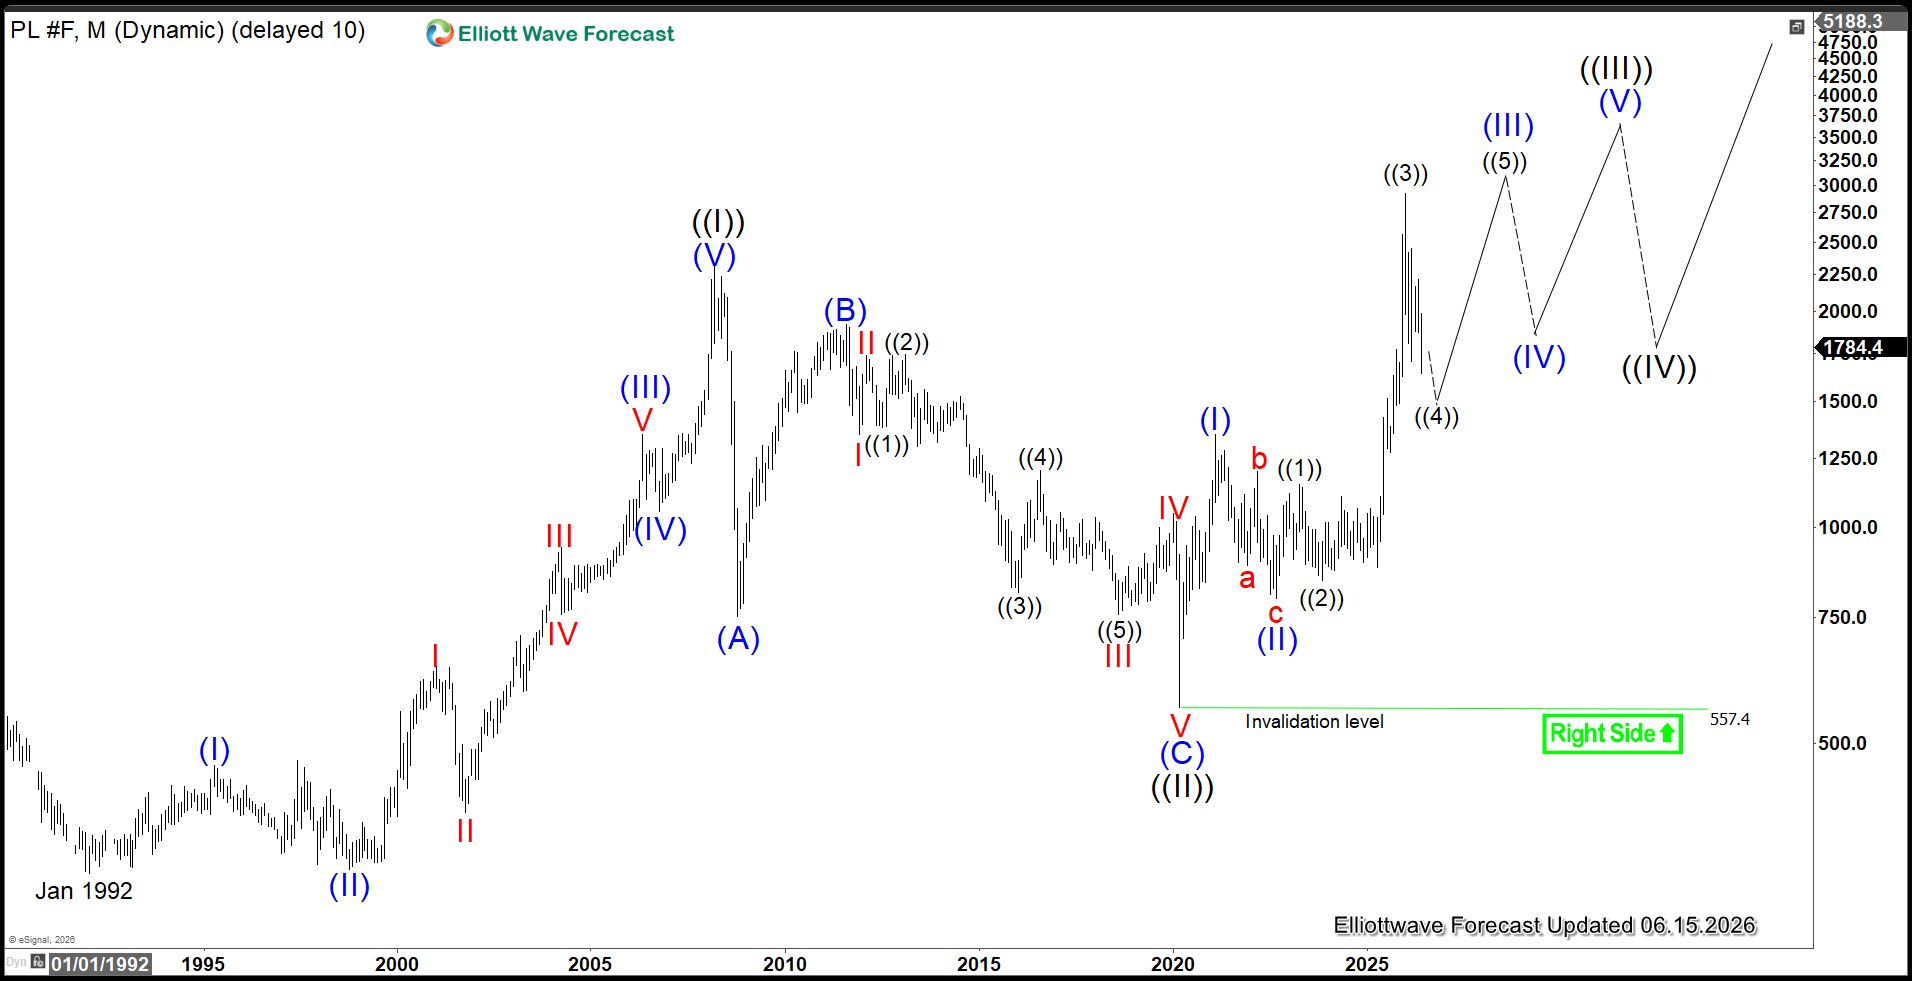
The monthly Platinum chart highlights a decisive breakout into record territory, underscoring the strength of its long‑term bullish trend. The metal continues to track within a secular advance that began decades ago. The rally from January 1992 through the March 2008 peak established wave ((I)) at 2308.8, followed by a sharp zigzag correction down to 557, completing wave ((II)). From that base, Platinum resumed higher and has now extended into fresh highs with a clear impulsive profile.
From the wave ((II)) low, wave (I) terminated at 1348.2, while the subsequent retracement in wave (II) found support at 796.8. The advance in wave (III) unfolded into a five‑wave sequence of lesser degree. Within this structure, wave ((1)) topped at 1148.9, and the corrective dip in wave ((2)) ended at 843.1. Wave ((3)) is proposed complete at 2925. Current action reflects a pullback in wave ((4)), which still has room to extend lower before the broader uptrend resumes.
Platinum (PL) Daily Elliott Wave Chart
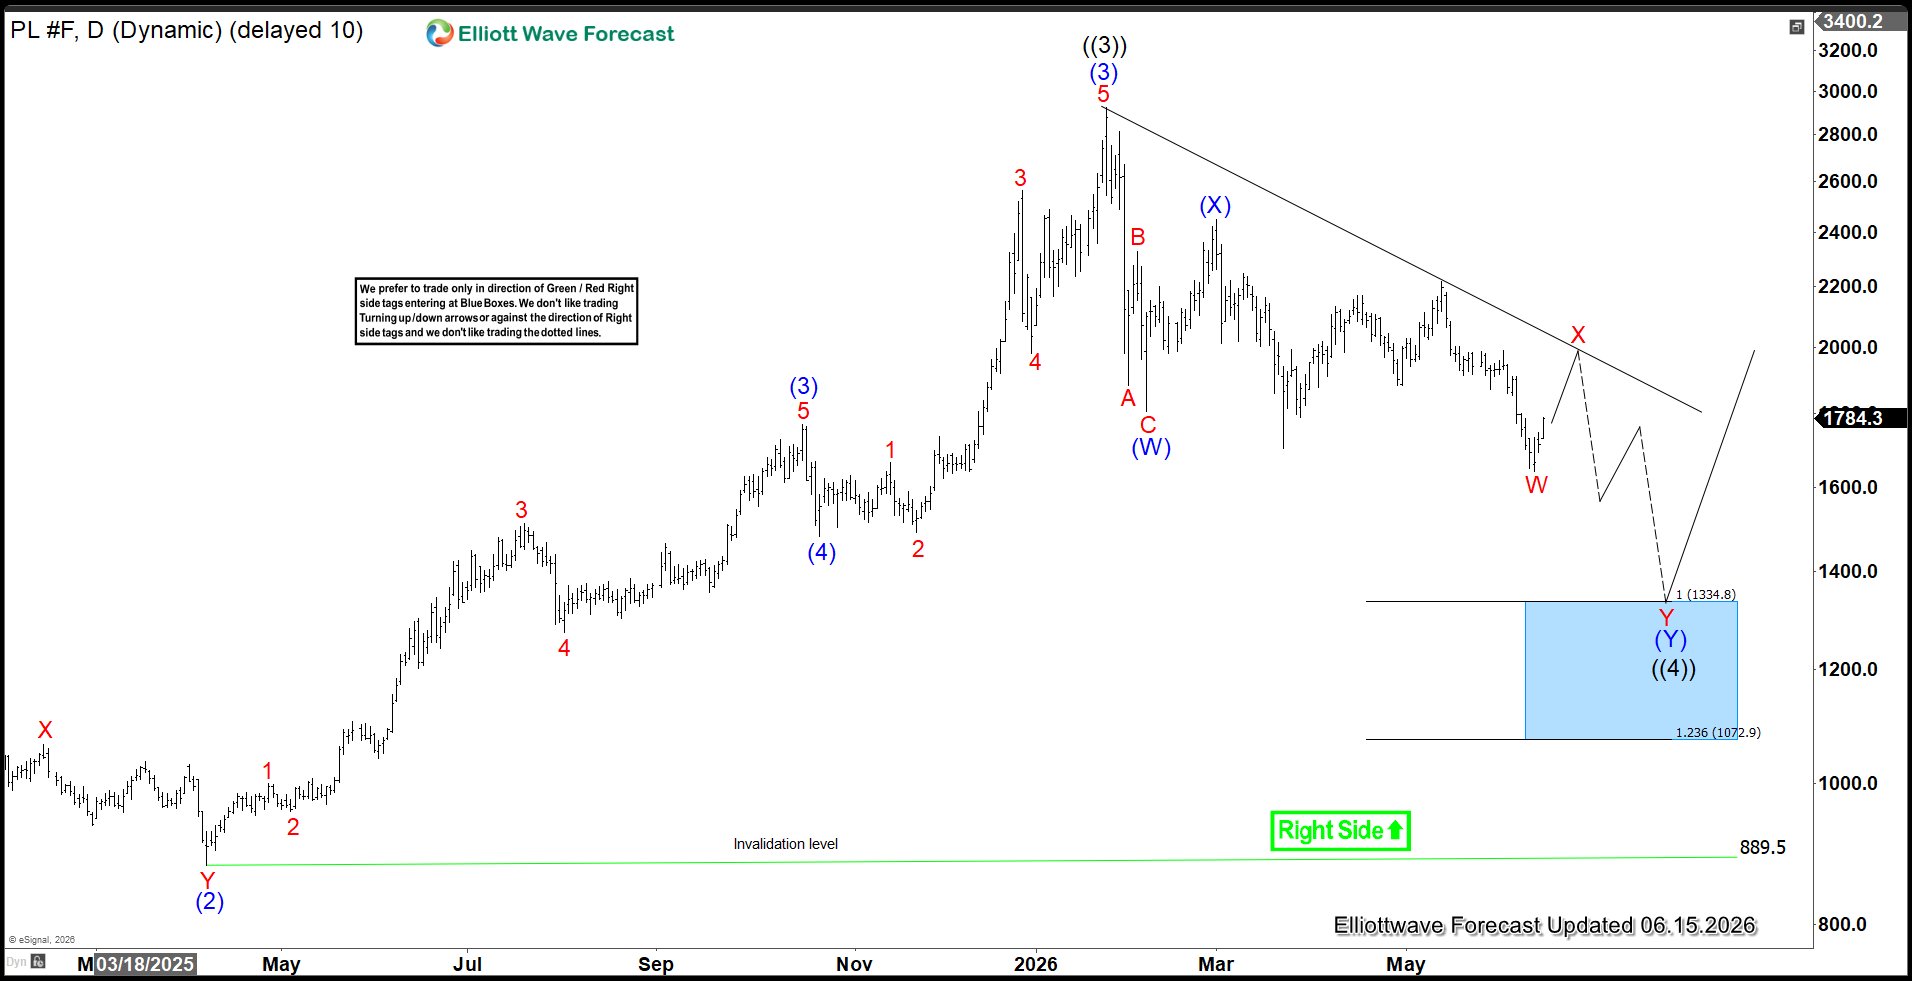
On the daily Platinum chart, the advance to 2925 is identified as the completion of wave ((3)). The market has since turned lower, with wave ((4)) unfolding and still capable of pressing further into the 1072–1334 zone. This area represents the 100%–161.8% Fibonacci extension of wave (W). The primary expectation remains for additional downside toward this target.
An alternate view considers the possibility of truncation, which would negate further weakness. That scenario gains weight only if Platinum decisively breaks above the bearish trend line drawn from the wave ((3)) peak, signaling that the correction has already ended and the next leg higher is underway.
Get daily Elliott Wave insights across commodities, equities, and forex. Start with our 14‑day trial and follow the markets with confidence.
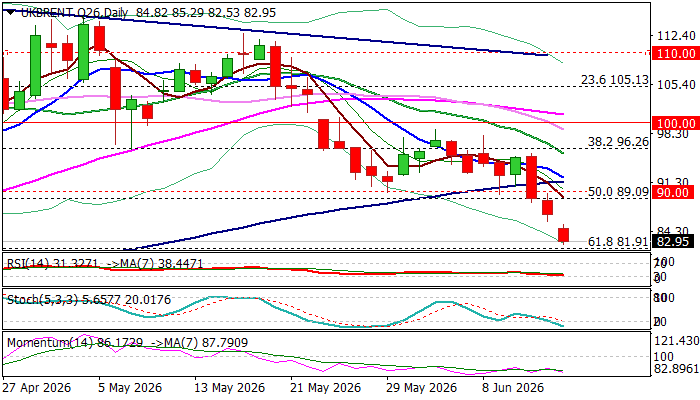
Brent – Peace Deal Optimism Pushes the Price to Three-Month Low
Brent oil opened with a gap lower on Monday and fell to the lowest in over three months, deflated by fresh wave of optimism about the end of US/Iran war.
Two sides announced that they had reached an initial deal which should be signed next Friday.
Potential end of the war and reopening of strategic Strait of Hormuz provided strong relief after three-month conflict significantly hurt global energy supply and drained reserves (approx. 20 million barrels per day passing through Hormuz).
Technical picture on daily chart has weakened further, as the bear-leg that emerged after failure under psychological $100 barrier accelerated in past three sessions and registered weekly close below next strong supports at $90/$89 (round-figure / former higher base / 50% retracement of $58.70/$119.47 rally).
Strong negative momentum and converging 10/100DMAs, on track to form bear-cross, add to bearish outlook, though warning that bears may start to face headwinds comes from oversold stochastic and falling RSI touching the boundary of oversold zone.
Upticks in current environment should be limited and ideally stay below $90 zone, to provide better levels for re-entering bearish market.
Immediate support lays at $81.91 (Fibo 61.8%) / $80.00 (round-figure) followed by $77.74 (200DMA) and $73.04 (Fibo 76.4%) in extension.
Res: 86.08; 89.09; 90.00; 91.54
Sup: 81.91; 77.74; 75.76; 73.04
S&P 500: on Track for a Recovery
- SpaceX’s success and geopolitics are driving the S&P 500 higher.
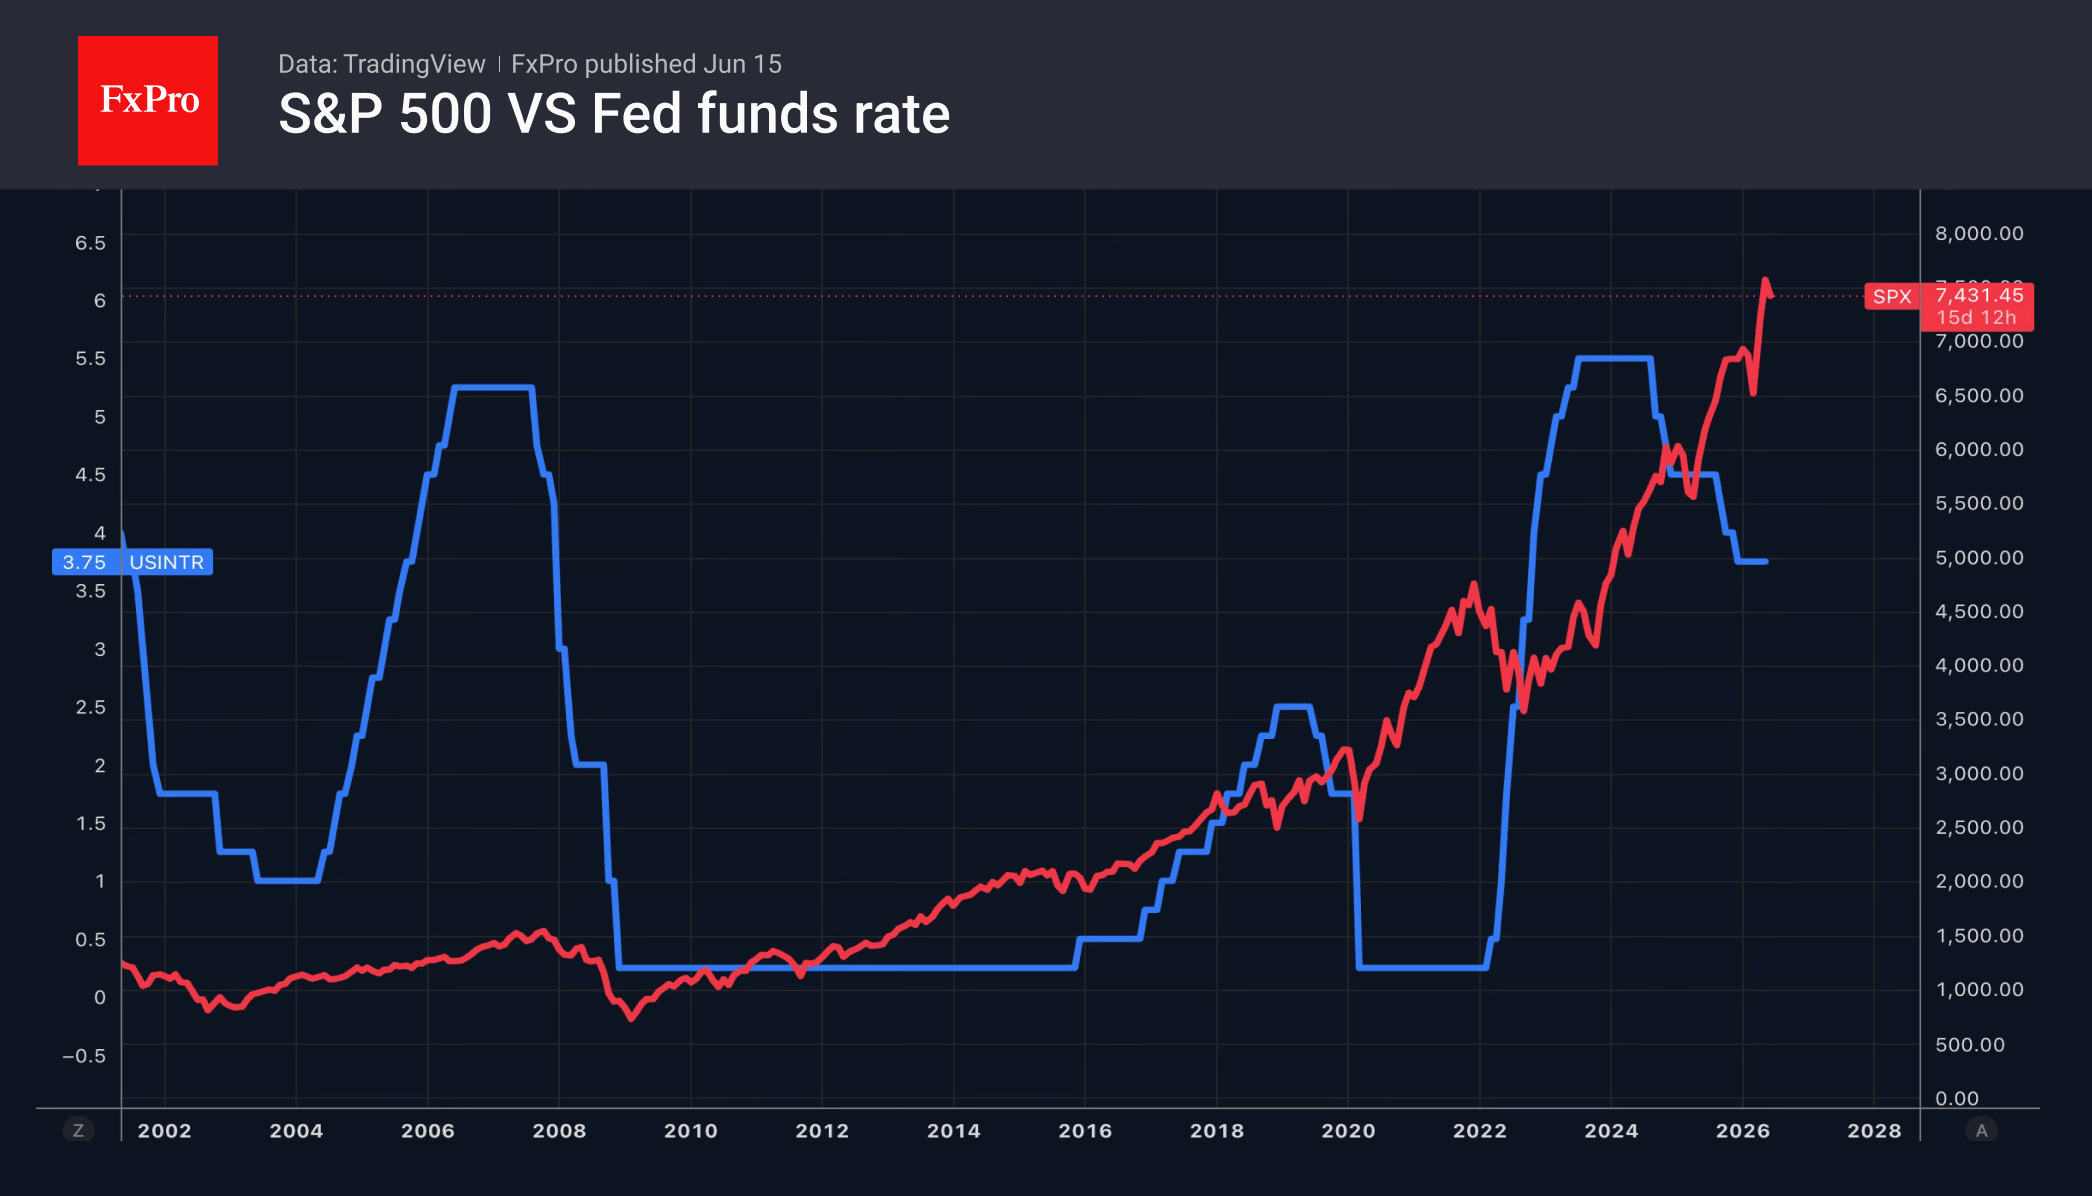
- Investors are hoping for future Fed rate cuts.
Rumours of an imminent end to the conflict in the Middle East, SpaceX’s successes, positive news from the US economy and a decline in the likelihood of the Fed tightening policy have allowed the S&P 500 to resume its rally. The catalyst was Pakistan’s announcement that the final text of the US-Iran memorandum had been agreed upon. Tehran noted that the positions of the parties had never been as close as they are now.
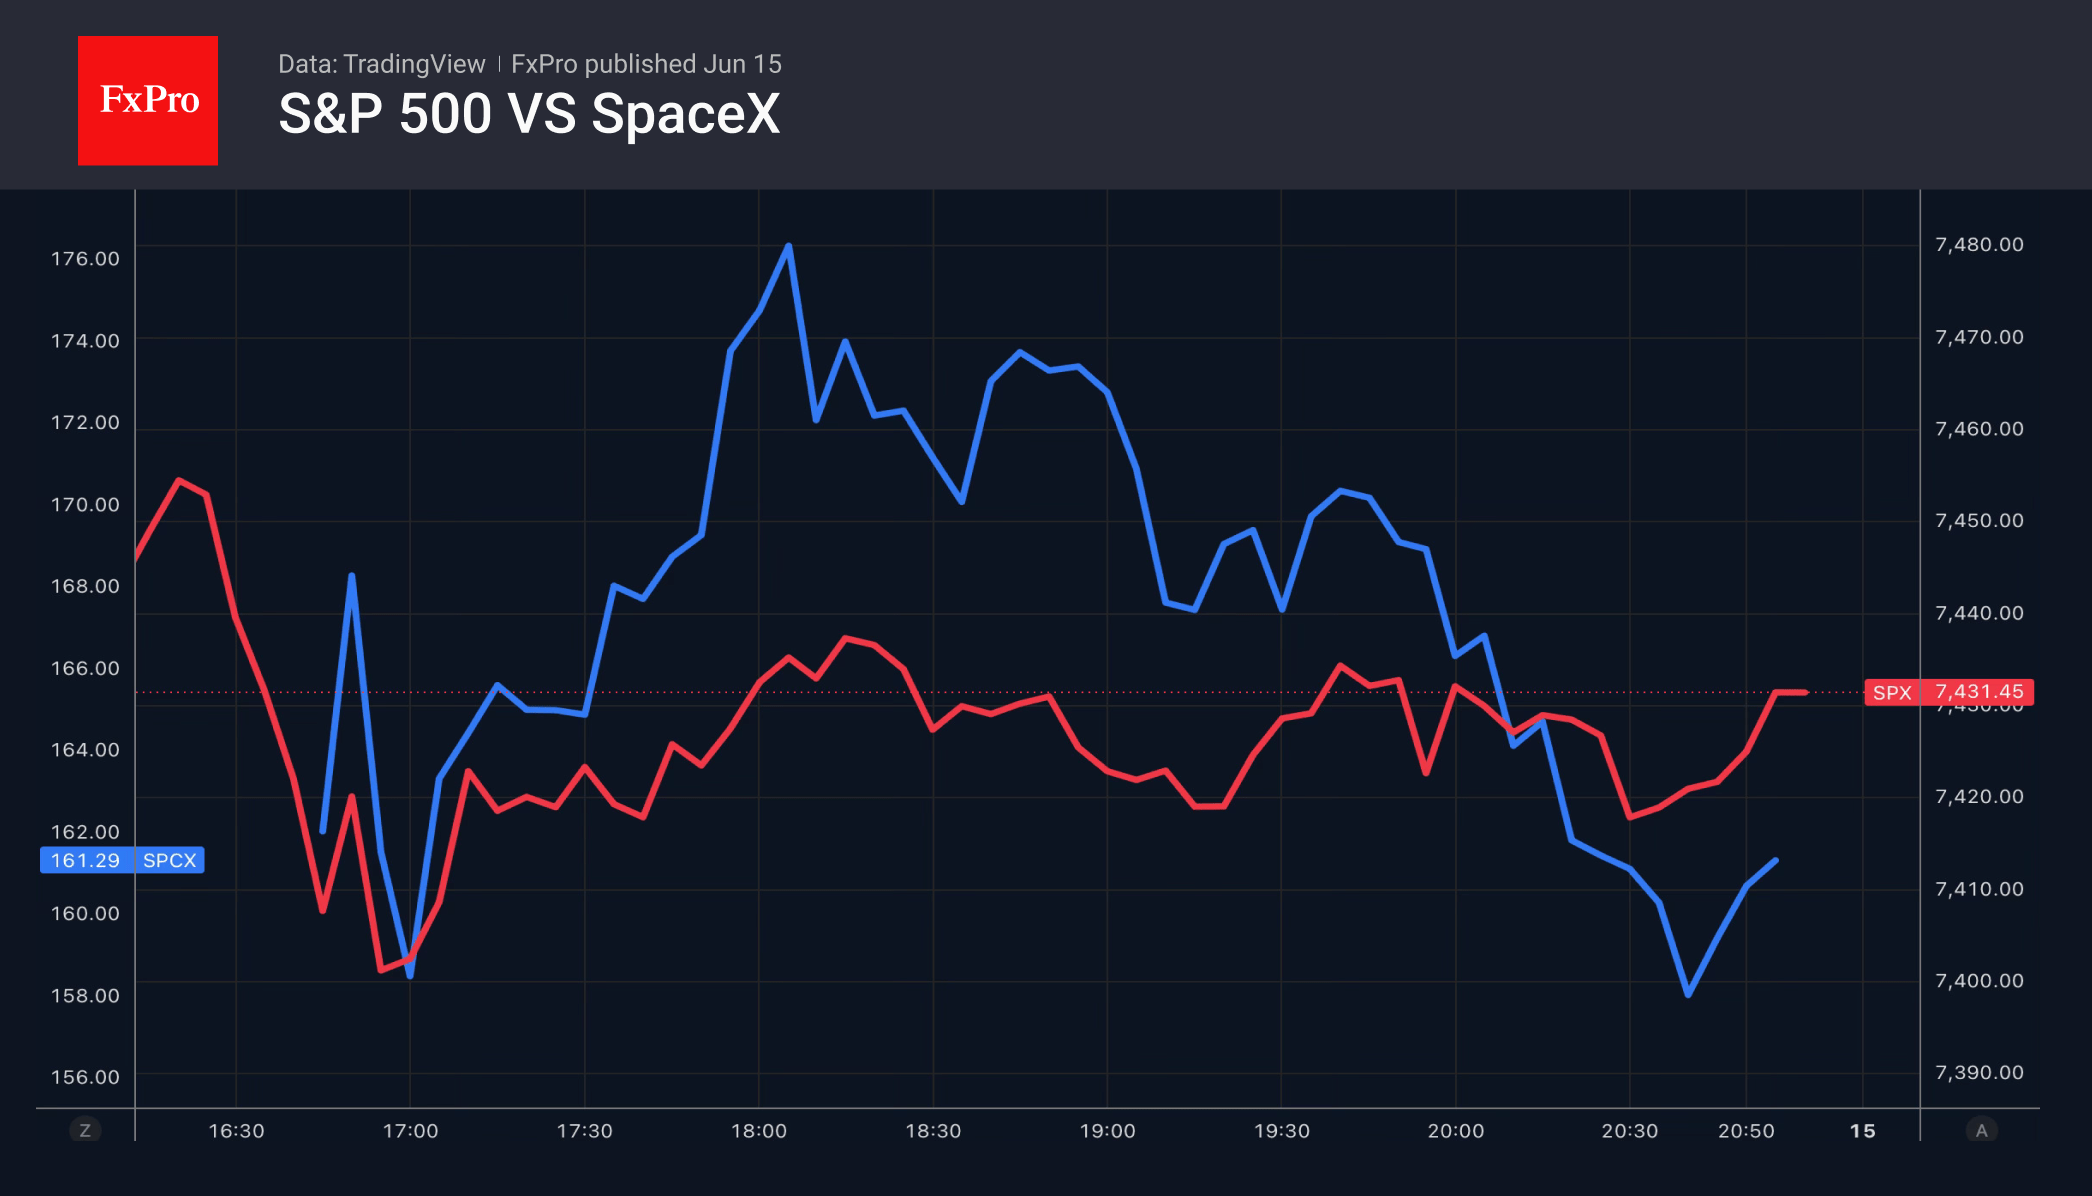
SpaceX opened trading 11% above its IPO price of $135 per share. At one point, the shares rose by 31% but closed the day up 19%. How quickly will the euphoria over buying shares in a loss-making company, whose main profits come from its artificial intelligence division, fade? More importantly, the initial public offering proved successful, allowing us to look forward to the IPOs of OpenAI and other big tech companies in the coming months.
The S&P 500 was buoyed by the University of Michigan’s consumer sentiment index, which recorded its first rise in four months. Americans felt some relief as petrol prices fell and now expect inflation to rise to 4.6% over the next 12 months, down from 4.8% a month earlier, which also helped dampen expectations of further Fed tightening.
The markets expect that, at his first meeting as Fed Chair, Kevin Warsh will emphasise the temporary nature of the inflationary rise. Such ‘dovish’ signals will raise hopes of a resumption of the monetary expansion cycle and provide a tailwind for the S&P 500. Morgan Stanley forecasts it will rise to 8,000 by the end of 2026. Citigroup has raised its forecast from 7,700 to 8,100.
Conversely, other banks and investment firms advise caution. Many of Bank of America’s indicators are sending ‘bearish’ signals, whilst Wells Fargo has described the recent sell-off in chipmakers’ shares as investors waking from a slumber.
In fact, expectations of strong corporate earnings, a robust US economy, reduced geopolitical risks, sustained high demand for artificial intelligence technology, and the belief that the Fed will cut rates sooner or later are creating a solid foundation for the S&P 500 rally to continue. That said, no trend is complete without periods of consolidation.
The FxPro Analyst Team
EUR/USD Daily Outlook
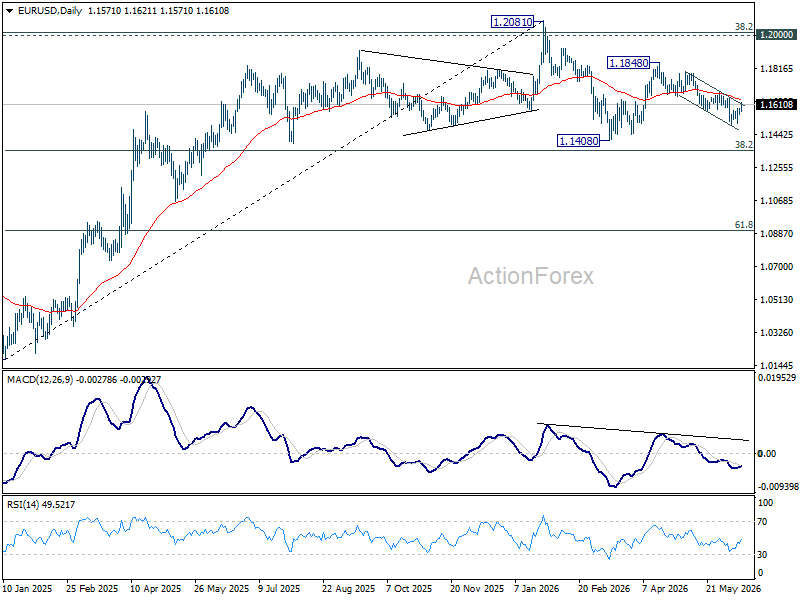
Intraday bias in EUR/USD stays neutral at this point. Risk will stay on the downside as long as 1.1685 resistance holds. Break of 1.1499 will resume the fall from 1.1848 towards 1.1408 support. However, firm break of 1.1685 will argue that fall from 1.1848 has completed, and bring stronger rally.
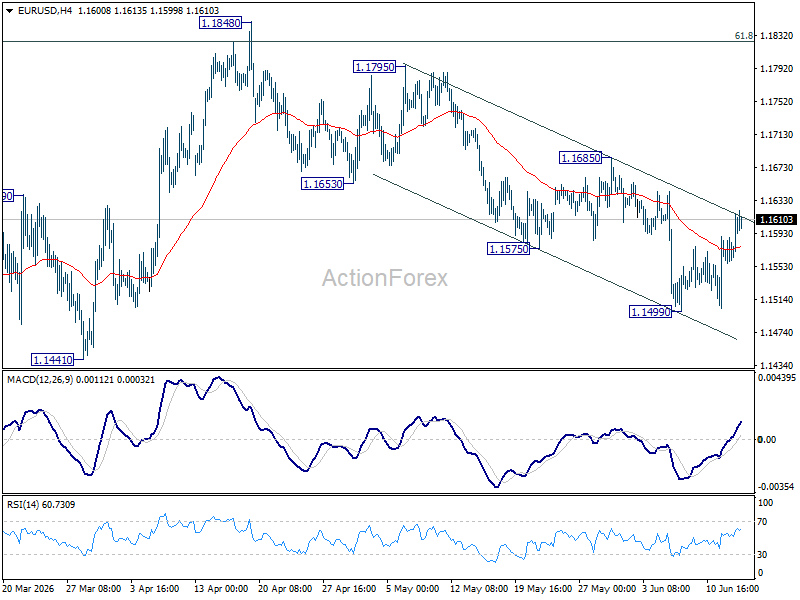
In the bigger picture, the strong support from 38.2% retracement of 1.0176 to 1.2081 at 1.1353 suggests that the pullback from 1.2081 is more likely a corrective move. Strong support was also found in 55 W EMA (now at 1.1550). Focus is back on 1.2 key cluster resistance level. Decisive break there will carry long term bullish implications. Nevertheless, break of 1.1408 support will revive the case of medium term bearish trend reversal.
USD/JPY Daily Outlook
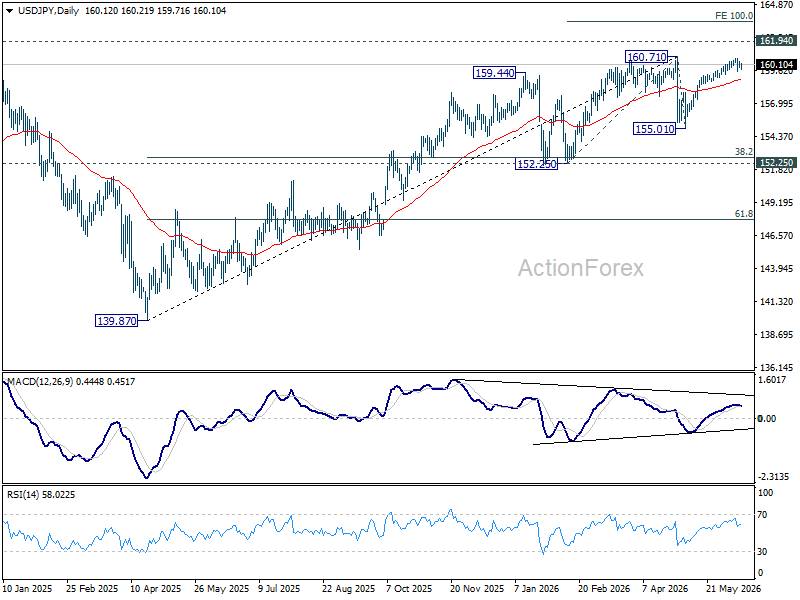
Intraday bias in USD/JPY remains neutral first. On the downside, break of 159.54 will extend the fall from 160.58 short term top to 38.2% retracement of 155.01 to 160.58 at 158.45. However, decisive break of 160.71 will confirm up trend resumption. That should push USD/JPY through 161.94 to 100% projection of 152.25 to 160.71 from 155.01 at 163.47 next.
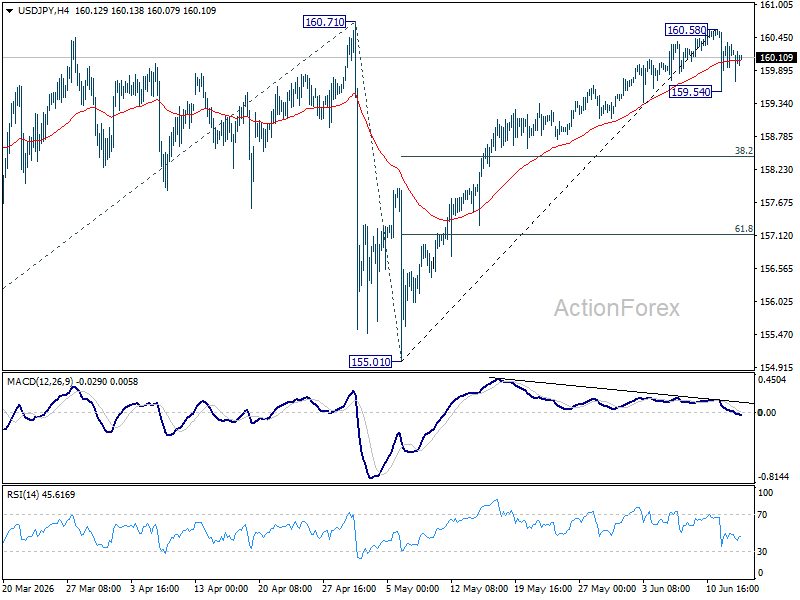
In the bigger picture, for now, corrective pattern from 161.94 (2024 high) is still seen as completed at 139.87. Rise from there is seen as resuming the long term up trend. So, break of 161.94 is expected at a later stage to resume the long term up trend. However, sustained break of 55 W EMA (now at 155.13) will dampen this view and bring deeper fall back towards 139.87 to extend the pattern from 161.94.