
Sample Category Title
The Yen: Time for a Hike!
• The Bank of Japan is ready to raise the overnight rate.
• Speculators are closing out their long positions on the US dollar.
The US dollar opened with a downside gap, which is unlikely to be closed any time soon. Donald Trump announced a deal with Iran and the reopening of the Strait of Hormuz from 19 June. The US President stated that the agreement would bring peace to the entire region. Brent fell below $84 per barrel, whilst speculators began actively selling the greenback.
By 9 June, hedge funds and asset managers held the highest net long positions in the US dollar since February 2025. The de-escalation in the Middle East is reversing this trend, with the USD being sold both as a safe-haven asset and as the currency of a net energy exporter.
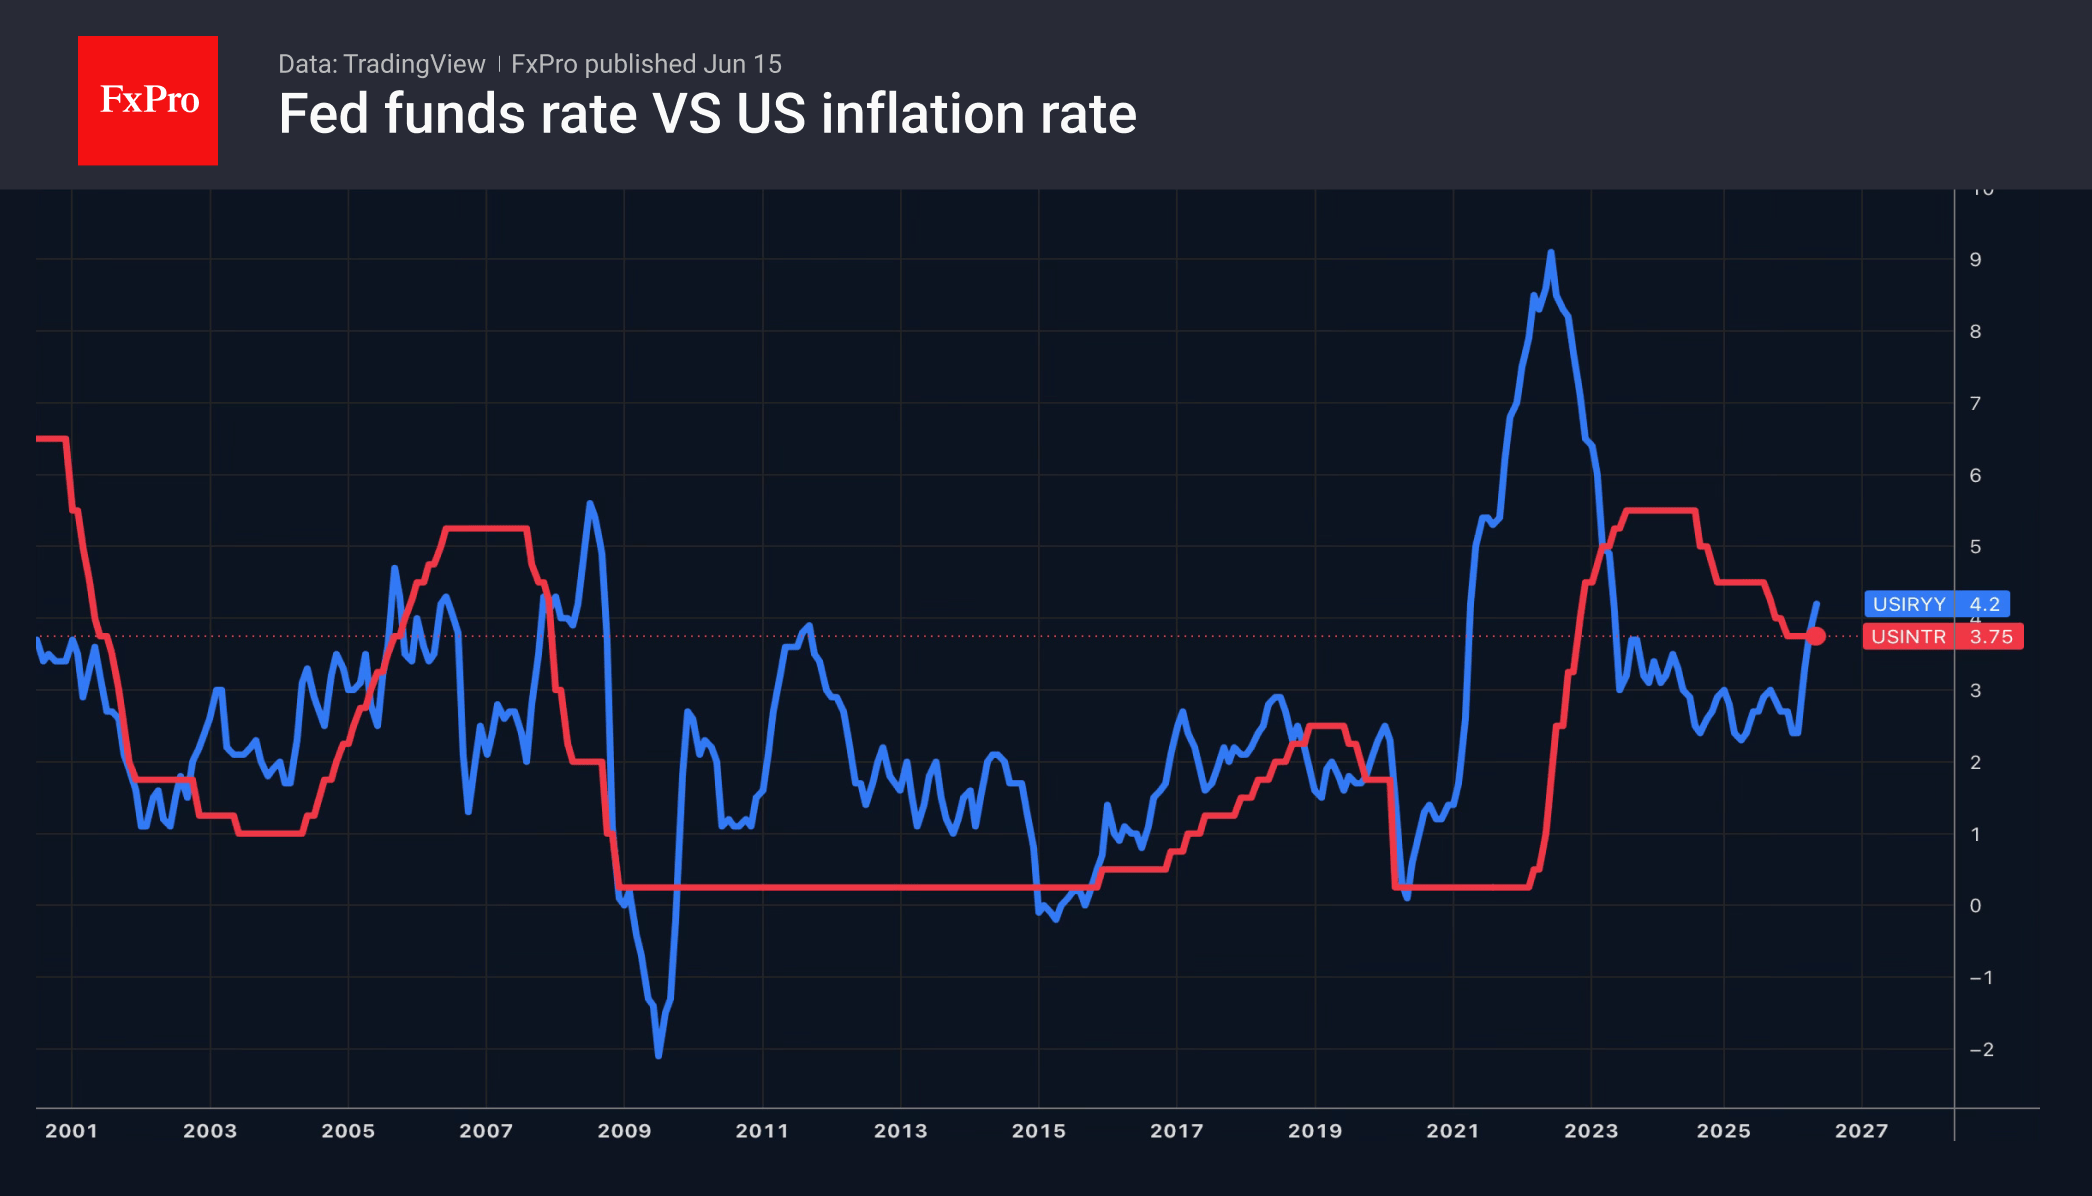
Over the past week, the markets have reduced the likelihood of a key rate hike before the end of the year from 75% to 50%. The first FOMC meeting chaired by Kevin Warsh risks pushing that figure even lower. Whereas in 2025 the Fed cut rates due to a weak labour market, the ‘doves’ no longer have that trump card. Most likely, the new Fed chair will emphasise the temporary nature of high inflation. In other words, consumer prices, following oil, have peaked and will now fall.
Such rhetoric aligns with the White House’s mantra of transitory inflation and will prompt investors to wonder whether Kevin Warsh can maintain the Fed’s independence. If not, the bears on the USD index will have a new trump card.
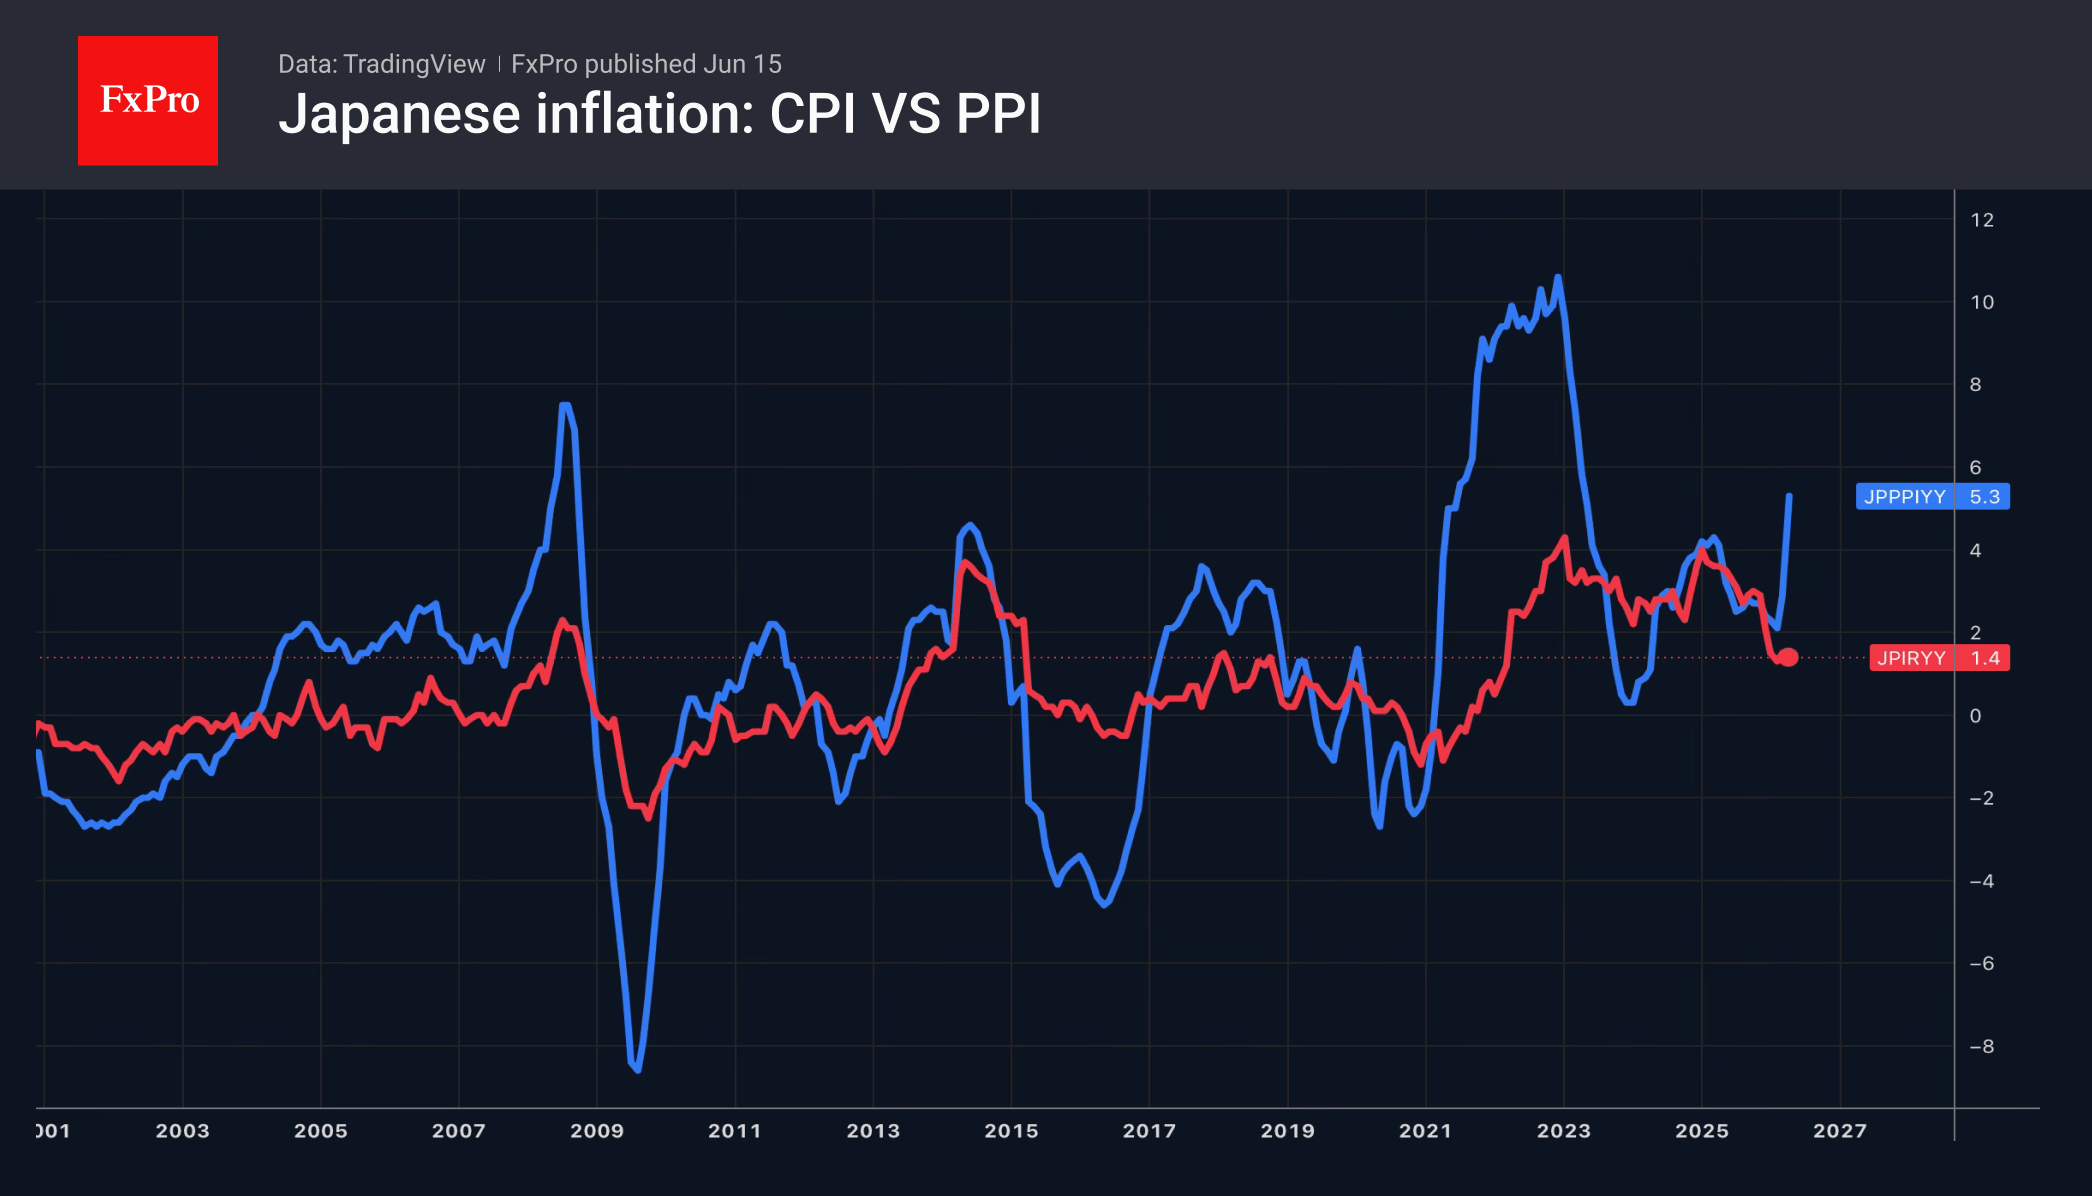
Ahead of the FOMC meeting, investors’ attention will be focused on the Bank of Japan’s meeting. It is forecast to raise the overnight rate from 0.75% to 1%, the highest level since 1995. Despite a slowdown in consumer prices, producer prices have accelerated significantly. Coupled with wage growth, economic strength, and the yen’s weakness, this makes a tightening of monetary policy necessary.
However, news of Kazuo Ueda’s hospitalisation initially sent the odds of an overnight rate hike tumbling from nearly 100% to 73%. They subsequently rose. Investors will be looking for signals from the Bank of Japan’s deputy governors on the continuation of the cycle, which will influence USDJPY’s fate.
The third week of June will be packed with central bank meetings. Alongside the US and Japan, the UK, Sweden, Norway, Switzerland, Australia and other regulators will announce their interest rate decisions.
The FxPro Analyst Team
EU and Eurozone Trade Balances Slip Into Deficit Amid Strong Import Growth
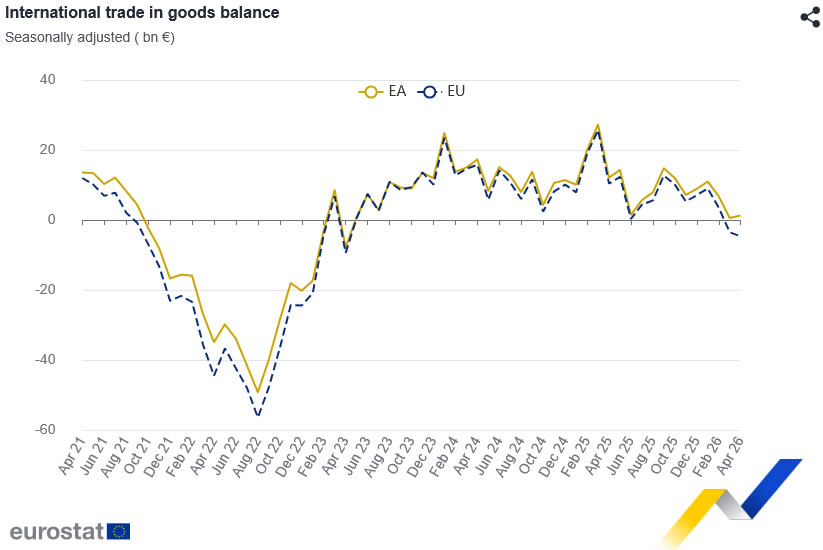
The Eurozone recorded a EUR 1.0bn deficit in goods trade with the rest of the world in April, a sharp deterioration from the EUR 8.7bn surplus recorded a year earlier. While exports continued to grow, stronger import demand more than offset the gains, highlighting the impact of rising external purchases on the region's trade position.
Exports rose 5.0% yoy to EUR 255.4bn, up from EUR 243.3bn in April 2025. However, imports increased at a much faster pace of 9.3% yoy to EUR 256.4bn, compared with EUR 234.6bn a year earlier.
The broader European Union showed a similar pattern, with its trade balance shifting from a EUR 7.3bn surplus to a EUR 7.1bn deficit as imports surged 10.1% yoy while exports rose 3.2% yoy.
The geographical breakdown revealed notable divergences among major trading partners of the EU. Exports to the United States fell -12.7% yoy, reducing the EU's trade surplus with its largest export market to EUR 9.9bn from EUR 17.1bn a year earlier. Meanwhile, exports to Switzerland rose 18.0% and shipments to the United Kingdom increased 7.8%.
On the import side, purchases from Taiwan surged 47.2%, while imports from Norway jumped 30.0%, contributing to wider trade deficits with both economies. The data suggest that strong import growth, rather than weak exports, was the primary driver behind the deterioration in the Eurozone's trade balance.
Eurozone Trade in Goods (April 2026)
| Indicator | Apr |
|---|---|
| Trade Balance | EUR -1.0bn |
| Exports | +5.0% Y/Y |
| Imports | +9.3% Y/Y |
European Union Trade in Goods (April 2026)
| Indicator | Apr 2026 |
|---|---|
| Trade Balance | EUR -7.1bn |
| Exports | +3.2% Y/Y |
| Imports | +10.1% Y/Y |
Major Trading Partners (EU Trade)
| Partner | Export Y/Y | Import Y/Y | Trade Balance (EUR bn) |
|---|---|---|---|
| United States | -12.7% | +3.9% | +9.9 |
| China | +1.8% | +7.1% | -31.9 |
| United Kingdom | +7.8% | +7.6% | +16.0 |
| Switzerland | +18.0% | +4.2% | +8.2 |
| Norway | +12.8% | +30.0% | -4.9 |
| India | +11.5% | -6.9% | -1.2 |
| Taiwan | -0.5% | +47.2% | -2.8 |
Full Eurozone and EU trade balance release here.
Eurozone Industrial Production Edges Up 0.1%, Capital Goods Weaken
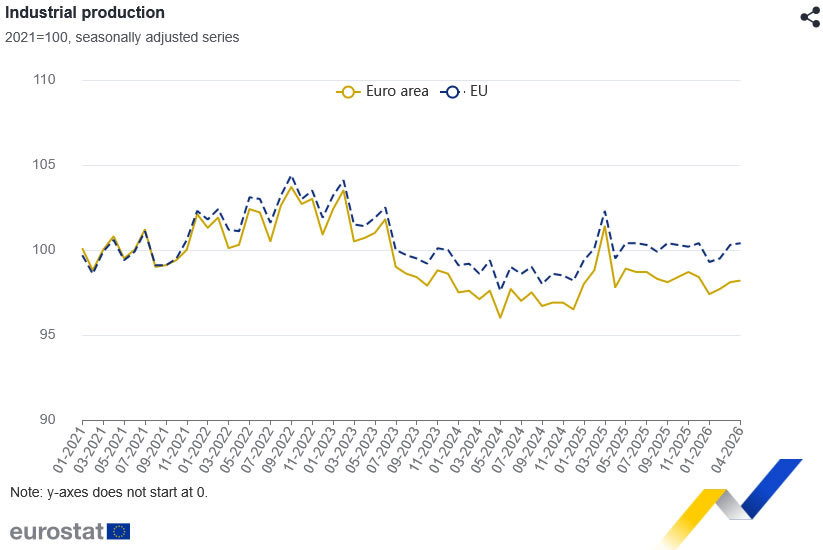
Eurozone industrial production rose by a modest 0.1% mom in April, falling short of expectations for a 0.2% mom increase. The data pointed to continued resilience in parts of the manufacturing sector, but the overall gain was constrained by weakness in capital goods and energy production.
Among the major categories, output of non-durable consumer goods rose 1.7% mom, while durable consumer goods increased 1.0% mom and intermediate goods gained 0.8% mom. However, these advances were partly offset by a -0.5% mom decline in capital goods production and a -0.4% mom fall in energy output.
Across the broader EU, industrial production also rose 0.1% mom. Malta recorded the strongest monthly increase at 5.2%, followed by Sweden at 3.4% and the Netherlands at 1.6%. At the other end of the spectrum, Bulgaria posted a 4.6% decline, while Greece and Poland saw output fall by 3.5% and 3.4% respectively.
| Category | Apr (M/M) |
|---|---|
| Industrial Production | 0.1% |
| Intermediate Goods | +0.8% |
| Energy | -0.4% |
| Capital Goods | -0.5% |
| Durable Consumer Goods | +1.0% |
| Non-Durable Consumer Goods | +1.7% |
Bitcoin Analysis: Iran Peace Deal Sparks Hope — Is Bitcoin Ready to Bounce?
After months of uncertainty and escalating tensions, the United States and Iran have reached a peace agreement that includes the reopening of the Strait of Hormuz. The deal appears solid for now, though markets remain cautious — particularly given President Trump's unpredictable track record, which leaves room for potential reversals.
This shift in the geopolitical landscape has moved sentiment toward risk-on, offering relief to assets that had been under pressure in recent months. Cryptocurrencies, and Bitcoin in particular, are among the primary beneficiaries — especially given that BTC/USD is also sitting at a technically significant zone.
Technical Analysis of BTC/USD
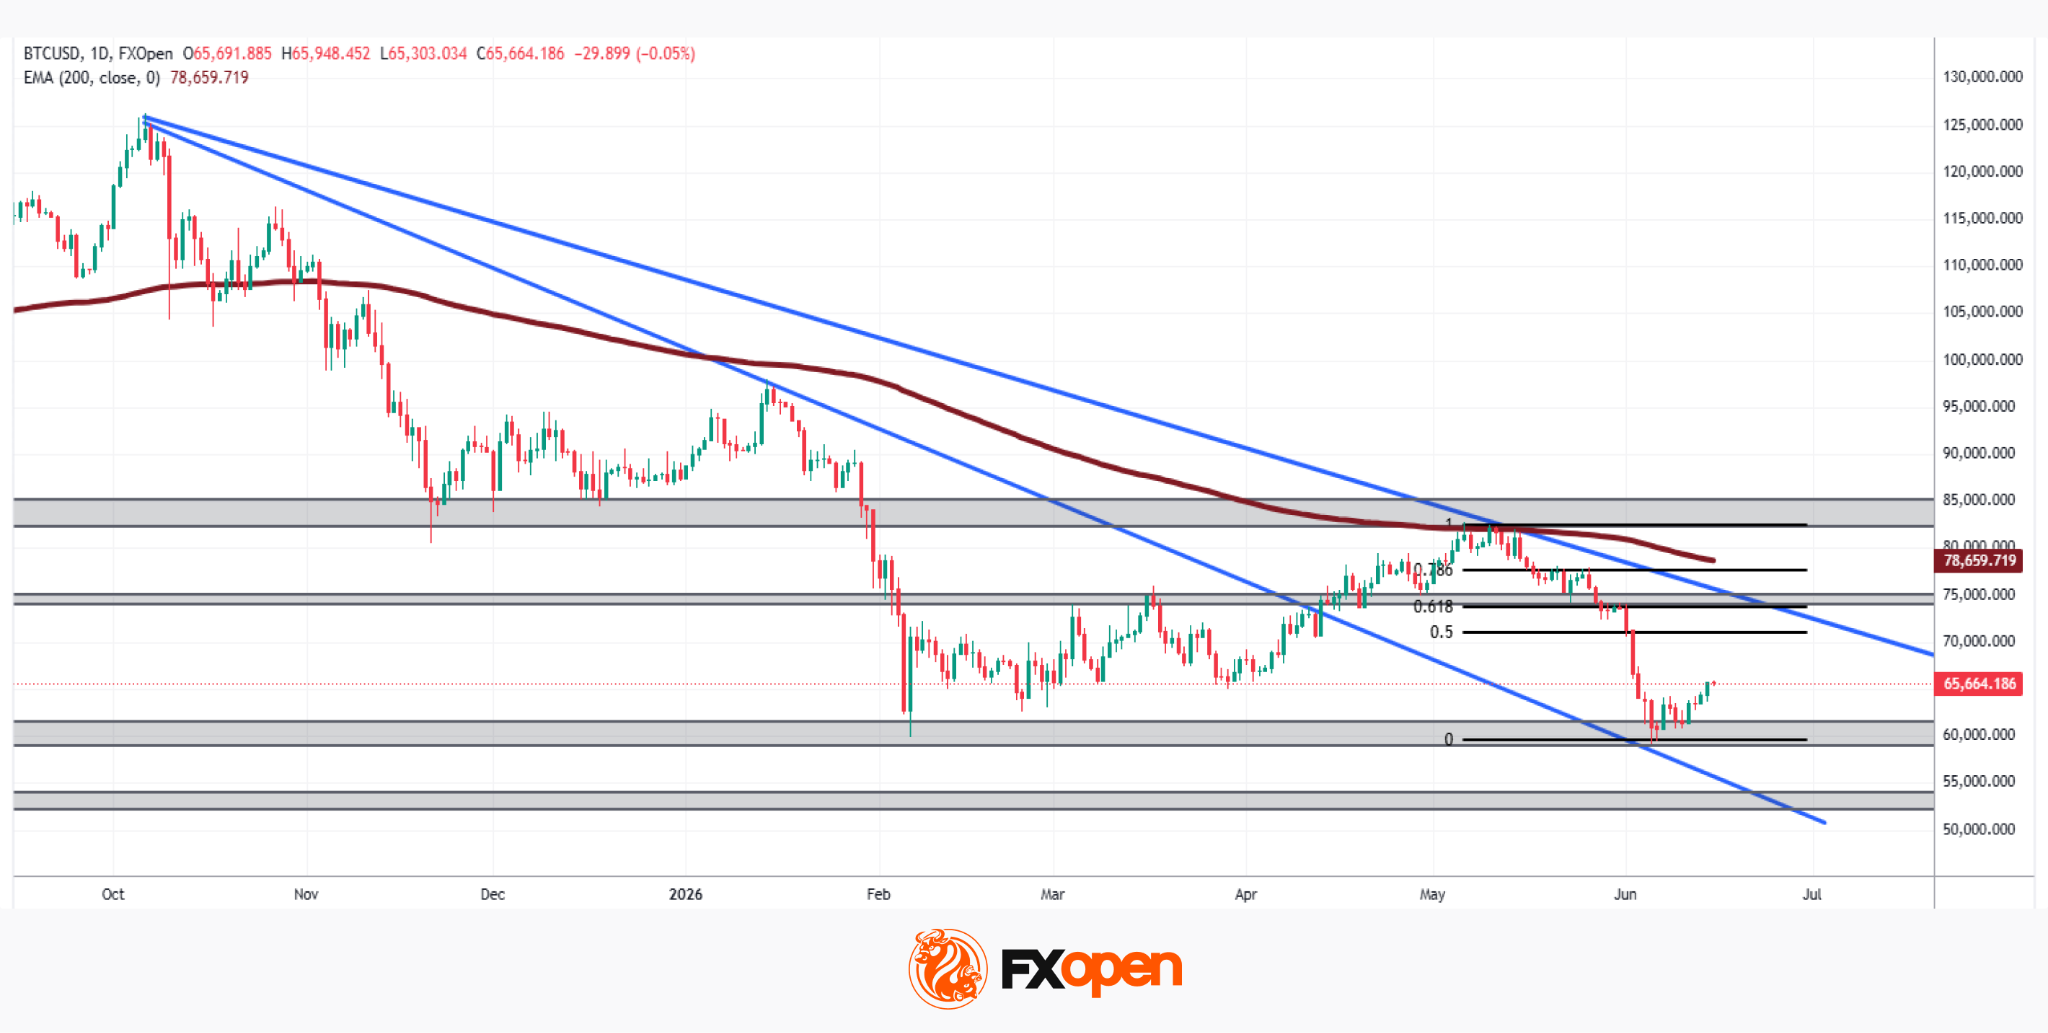
At the beginning of the month, Bitcoin retested a key support level — both psychologically and technically — around the $60,000 area. The reaction was significant: from the 5 June low near $59,000, the price has recovered approximately 11%, a clear signal that buyers are actively defending this zone. Meanwhile, sellers may have taken profit following a prolonged bearish trend that has seen the asset lose more than 50% from its all-time highs.
Two scenarios are currently in play:
→ On the bullish side, the price has reacted from the $60,000 support zone and, should it achieve a decisive break above the $74,000–$75,000 area, the technical picture could shift meaningfully. This zone represents a particularly significant confluence: it coincides with the 0.618 Fibonacci retracement of the last major bearish impulse, a descending trendline connecting the all-time high with the May 2026 highs, and the approaching 200-period EMA — a level Bitcoin has historically respected. Given the density of technical factors converging in this area, a confirmed break above it could open the door to a more sustained bullish recovery in the short- to medium-term.
→ On the bearish side, any renewed uncertainty around the peace deal — or a deterioration of conditions in the Strait of Hormuz — could weigh heavily on sentiment. In this scenario, a break below the $59,000 low would represent a significant structural failure, with the next meaningful support potentially found in the $54,000–$52,000 zone, where a previous demand area triggered the last major bull run.
Bitcoin, like most financial assets, is closely watching geopolitical developments. Will this peace deal be enough to reignite the leading cryptocurrency — or will uncertainty prevail?
FXOpen offers the world's most popular cryptocurrency CFDs*, including Bitcoin and Ethereum. Floating spreads, 1:2 leverage — at your service (additional fees may apply). Open your trading account now or learn more about crypto CFD trading with FXOpen.
*Important: At FXOpen UK, Cryptocurrency trading via CFDs is only available to our Professional clients. They are not available for trading by Retail clients. To find out more information about how this may affect you, please get in touch with our team.
This article represents the opinion of the Companies operating under the FXOpen brand only. It is not to be construed as an offer, solicitation, or recommendation with respect to products and services provided by the Companies operating under the FXOpen brand, nor is it to be considered financial advice.
Bitcoin at $66K as US-Iran Deal Revives Risk Appetite
Market Overview
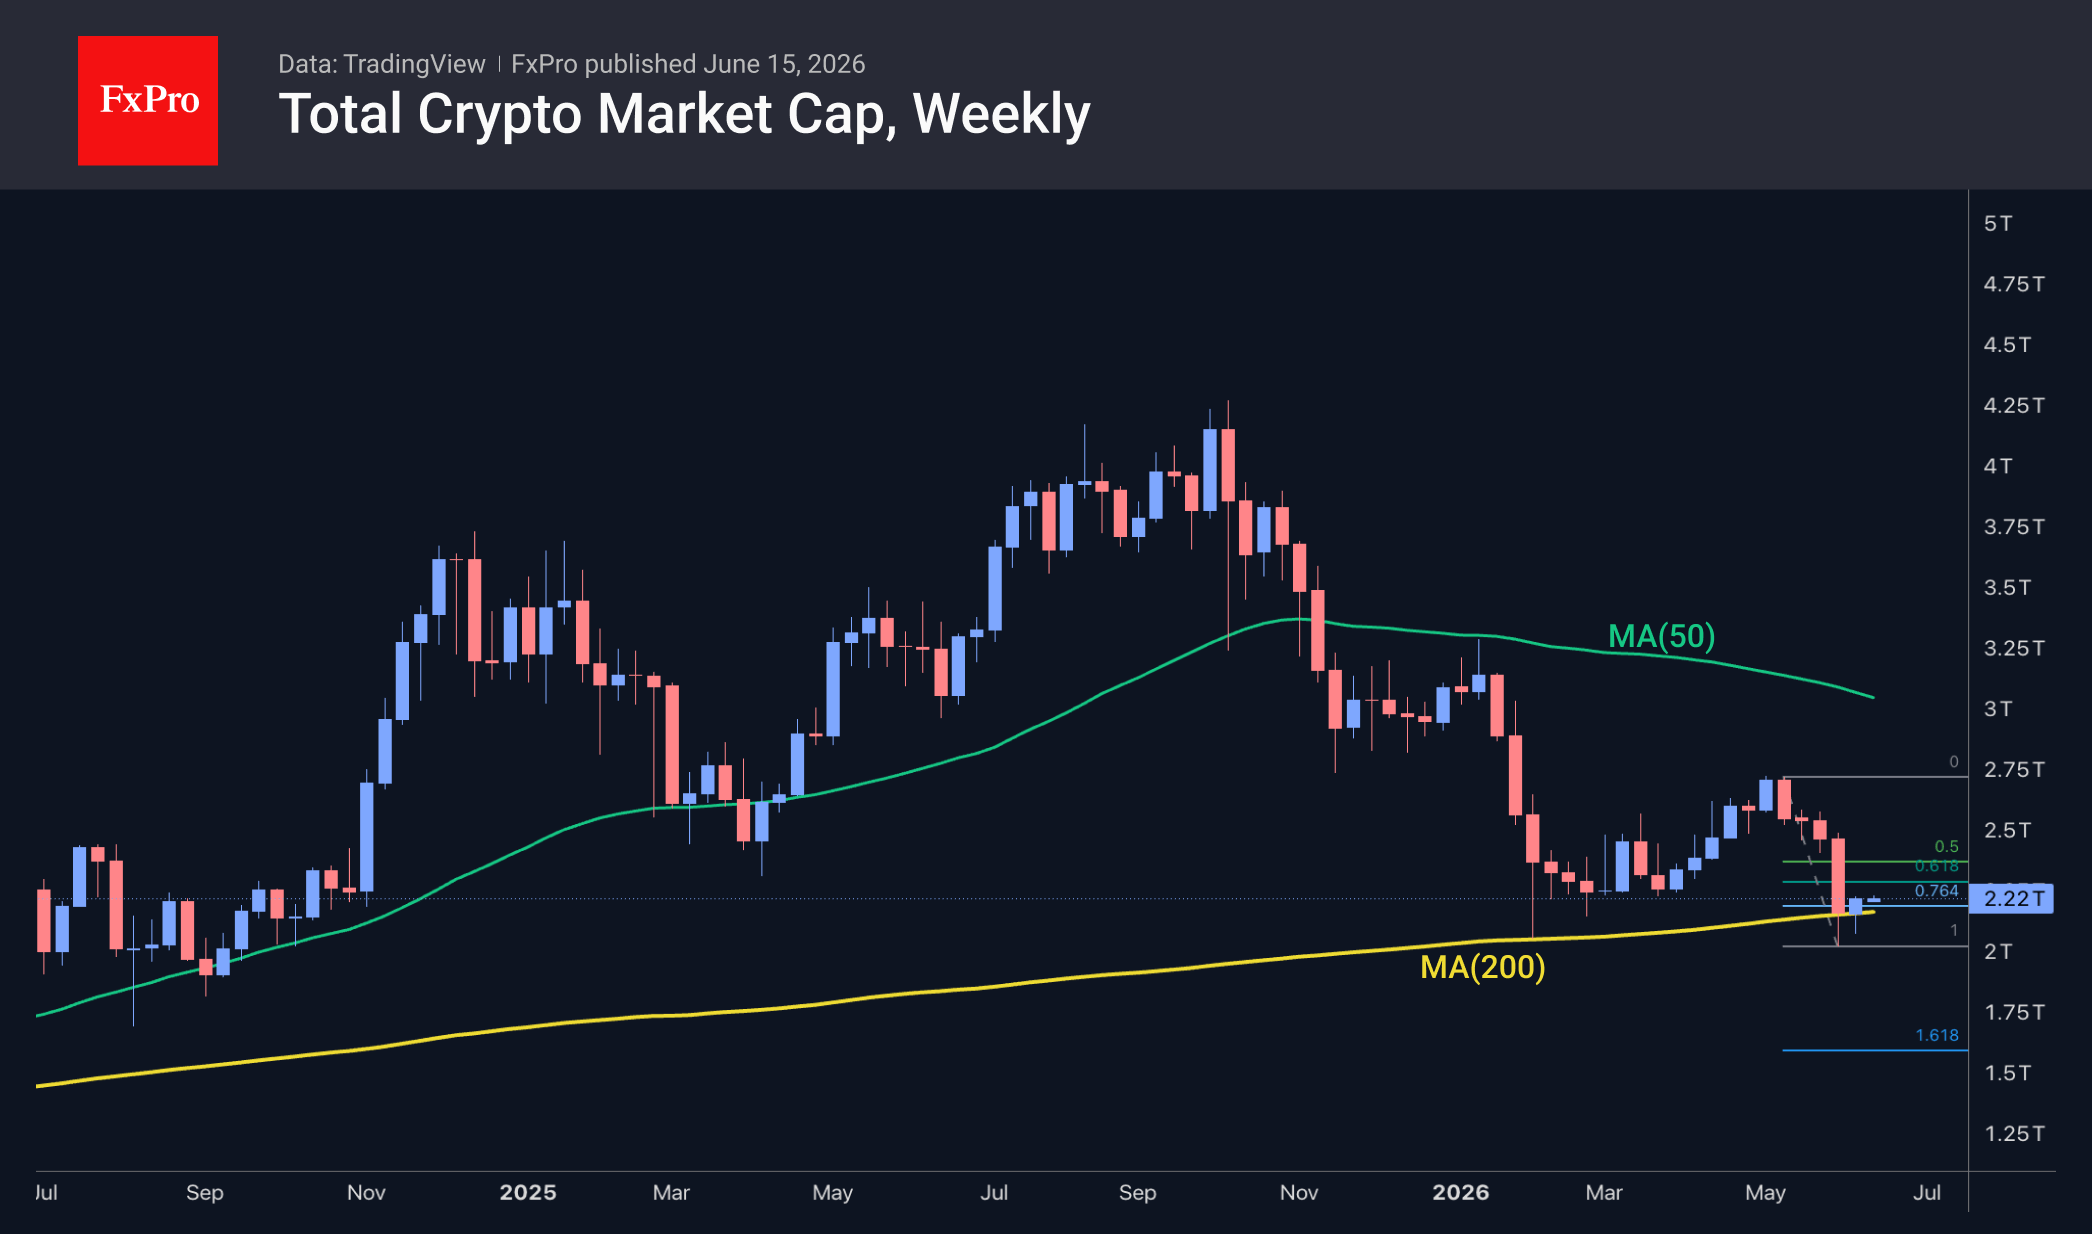
The crypto market capitalisation has risen by 1.8% over the past 24 hours to $2.24 trillion, spurred by the preliminary agreement between the US and Iran to end the conflict. Risk appetite has surged, pushing the crypto market towards the upper boundary of the upward channel it has been trading within since 6 June. Technically, cryptocurrencies found support on touching the 200-week moving average, indicating that the long-term positive outlook remains intact. On the other hand, the short-term view suggests that a recovery up to $2.30T could be interpreted as a corrective bounce following the downward momentum from May’s highs.
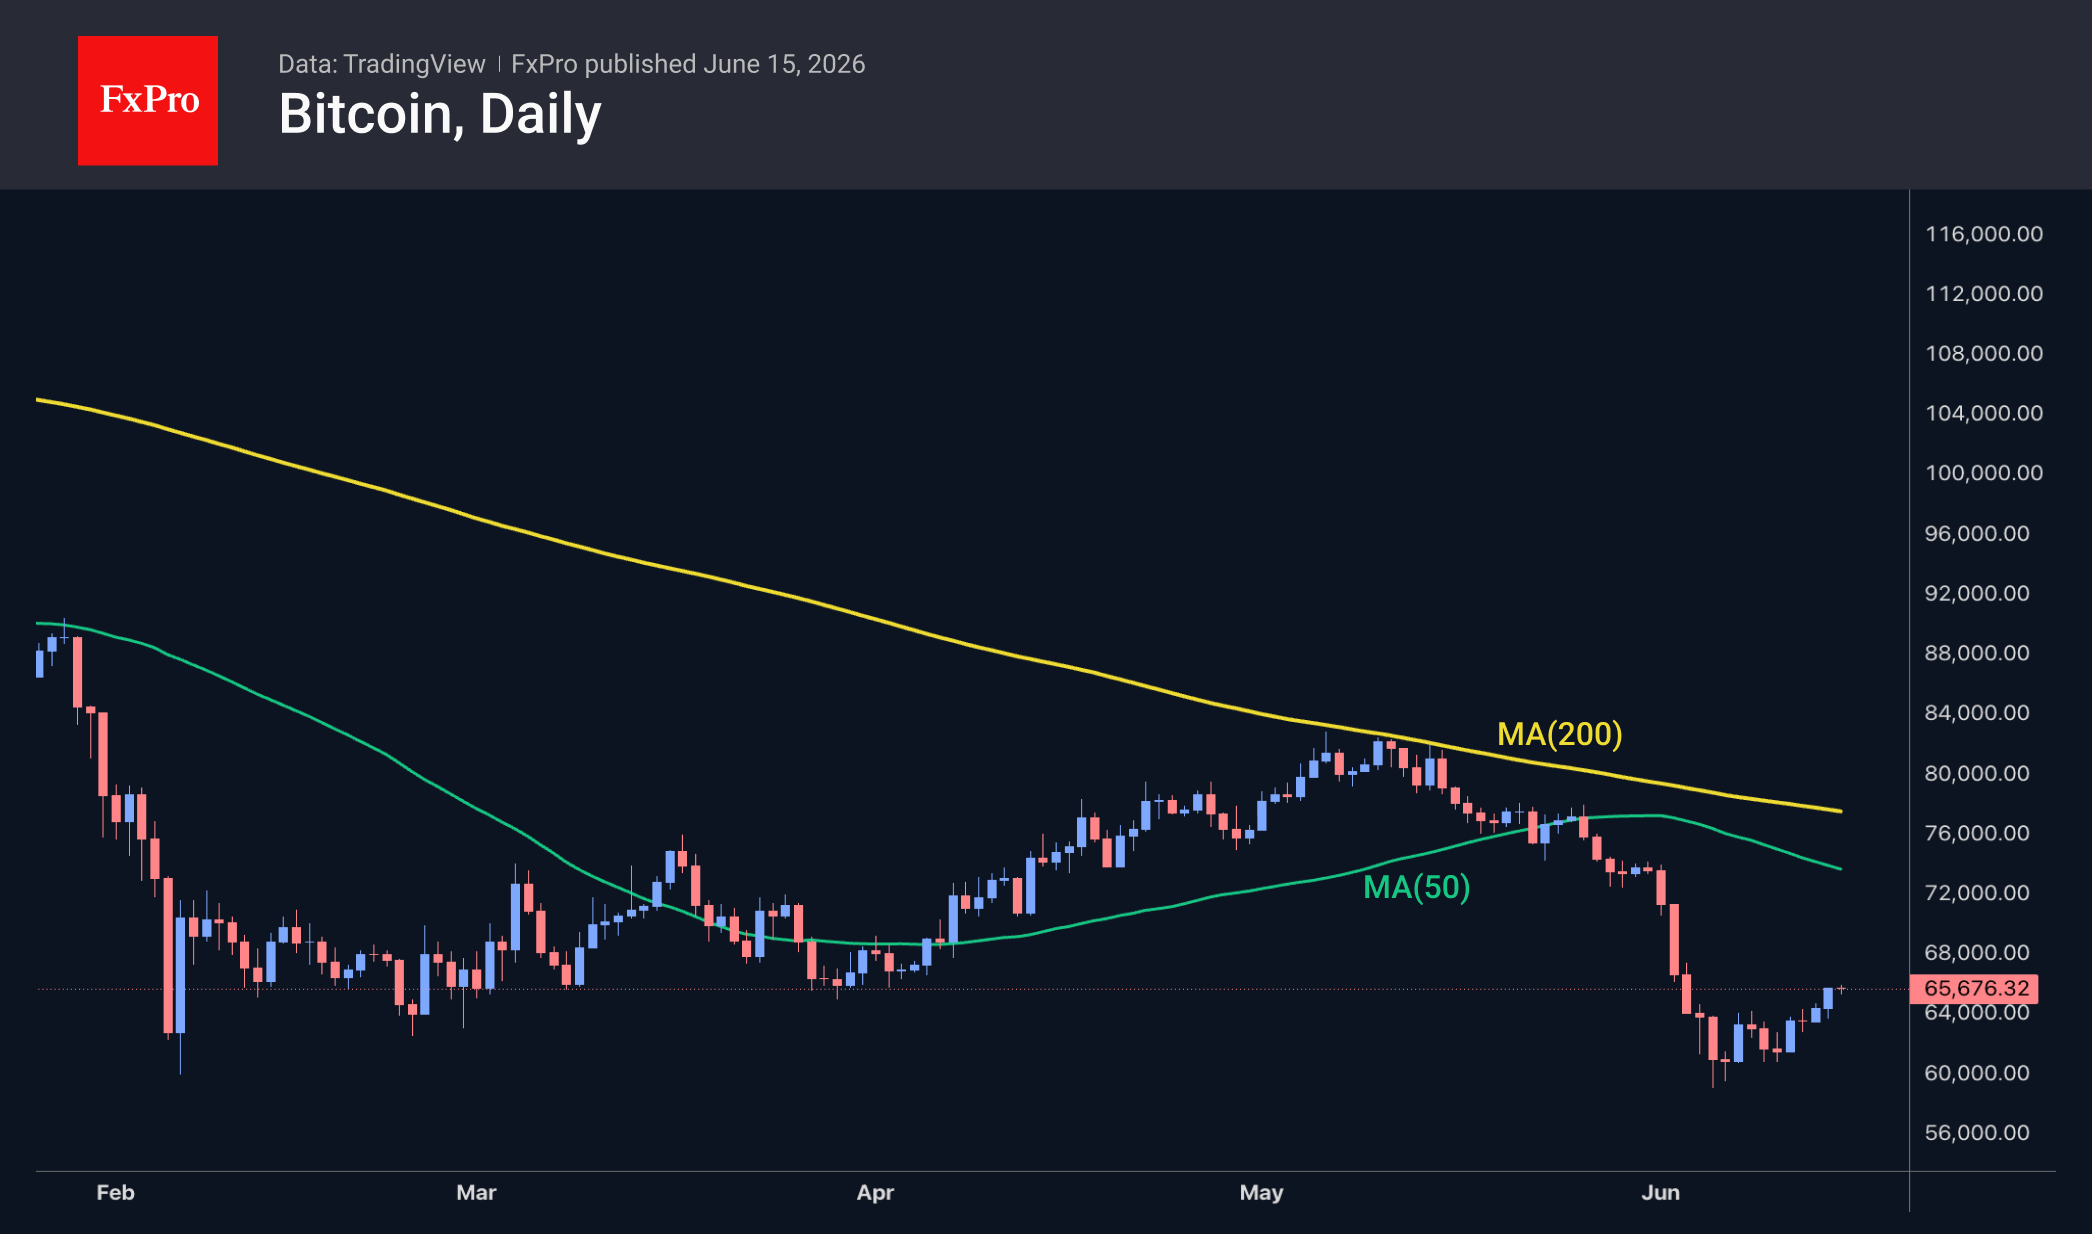
Bitcoin is trading near $66K, up 2.4% over the past 24 hours. This recovery towards the February-April lows could serve as a good test for the bulls. If the recovery stalls near current levels, there will be reason to suggest the rebound is nearing its end and that further declines are possible. If, however, the previous support level does not turn into resistance, bullish sentiment will rise significantly in the coming days.
News Background
According to SoSoValue, net weekly outflows from spot BTC ETFs fell to $316 million from a record high the previous week. On Friday, the first inflow was recorded after nearly a month of outflows.
Investors are losing interest in Bitcoin and gold as hedges against the depreciation of fiat currencies, JPMorgan notes.
Bitcoin is showing signs of a late-stage correction: most recent buyers are now sitting on losses; demand remains weak and does not match the levels typically associated with the formation of a long-term bottom, according to Glassnode.
According to Galaxy Research, only four out of 13 key indicators currently point to a bottom in the Bitcoin market cycle. The firm expects BTC to potentially fall to the $40K–$46K range.
The leading cryptocurrency is trading at a mining cost of $61.2K. Of this amount, electricity costs account for around $49K, and a long-term bottom may form near this level, Capriole Investments suggests.
Bitcoin has already formed the bottom of the current cycle at just above $59K, according to Standard Chartered. The market is beginning to lay the groundwork for a new phase of growth, and current levels look attractive to long-term investors.
As a result of the latest adjustment, Bitcoin’s mining difficulty plummeted by 10.09% to 124.93 T. This is the largest decline in the metric since early February, when the collapse at that time was influenced by a winter storm in the US.
The FxPro Analyst Team
EUR/USD Ahead of the New Week: Expecting High Volatility
The EURUSD pair is starting Monday's trading session near 1.1468.
This week, global financial markets will closely monitor two pivotal drivers: the prospects of a US-Iran nuclear deal and the upcoming Federal Reserve meeting. Any signs of progress in the negotiations could strip the geopolitical premium out of oil prices, subsequently weakening safe-haven demand for the US Dollar.
Concurrently, the market is bracing for the first Fed meeting chaired by Kevin Warsh, which is expected to set the tone for interest rate expectations heading into the second half of the year.
This meeting is critical for EURUSD. Just last week, robust US inflation and labor market data bolstered the Greenback, reinforcing expectations that the Fed will maintain its hawkish stance. Meanwhile, investors will continue to digest the impact of the ECB's recent rate hike, looking for further guidance from European policymakers.
Additional direction will come from US macroeconomic releases, including retail sales and industrial production, which will provide further clarity on the health of the US economy and the trajectory of its monetary policy.
EUR/USD Technical Analysis
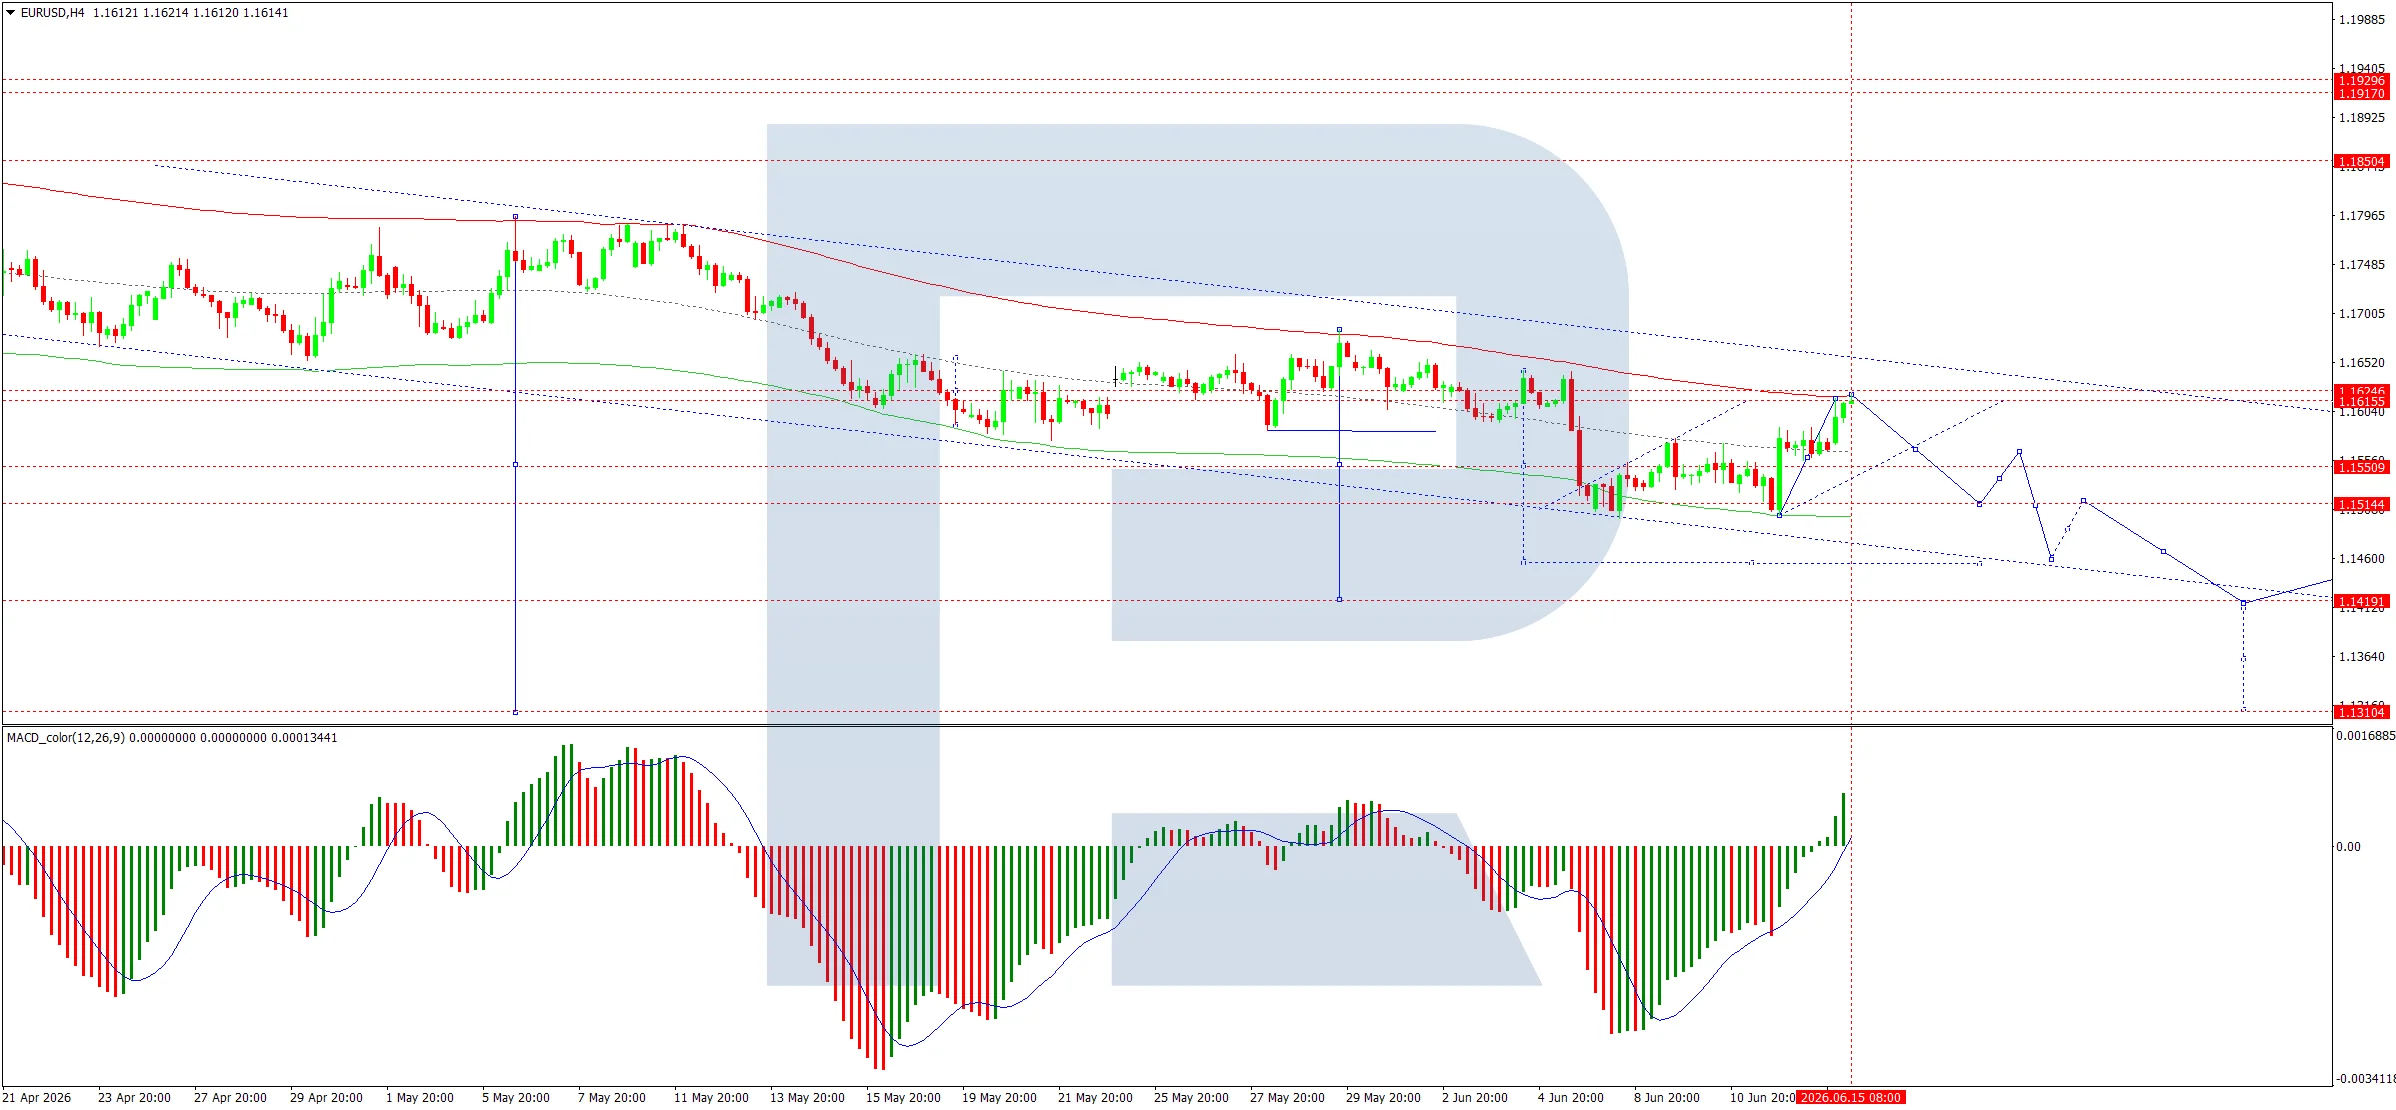
On the 4-hour chart, the EURUSD pair has formed a consolidation range around 1.1575, briefly testing the downside toward 1.1550.
Upside Scenario: A breakout above this range could trigger a corrective wave toward 1.1612, followed by a subsequent decline back to 1.1500.
Downside Scenario: A clean break below the consolidation range will open the door for a downward wave targeting 1.1444.
Technical Confirmation: The MACD indicator supports the bearish outlook. Its signal line remains above the zero mark but is pointing sharply downward, reflecting persistent bearish momentum and potential for trend continuation.
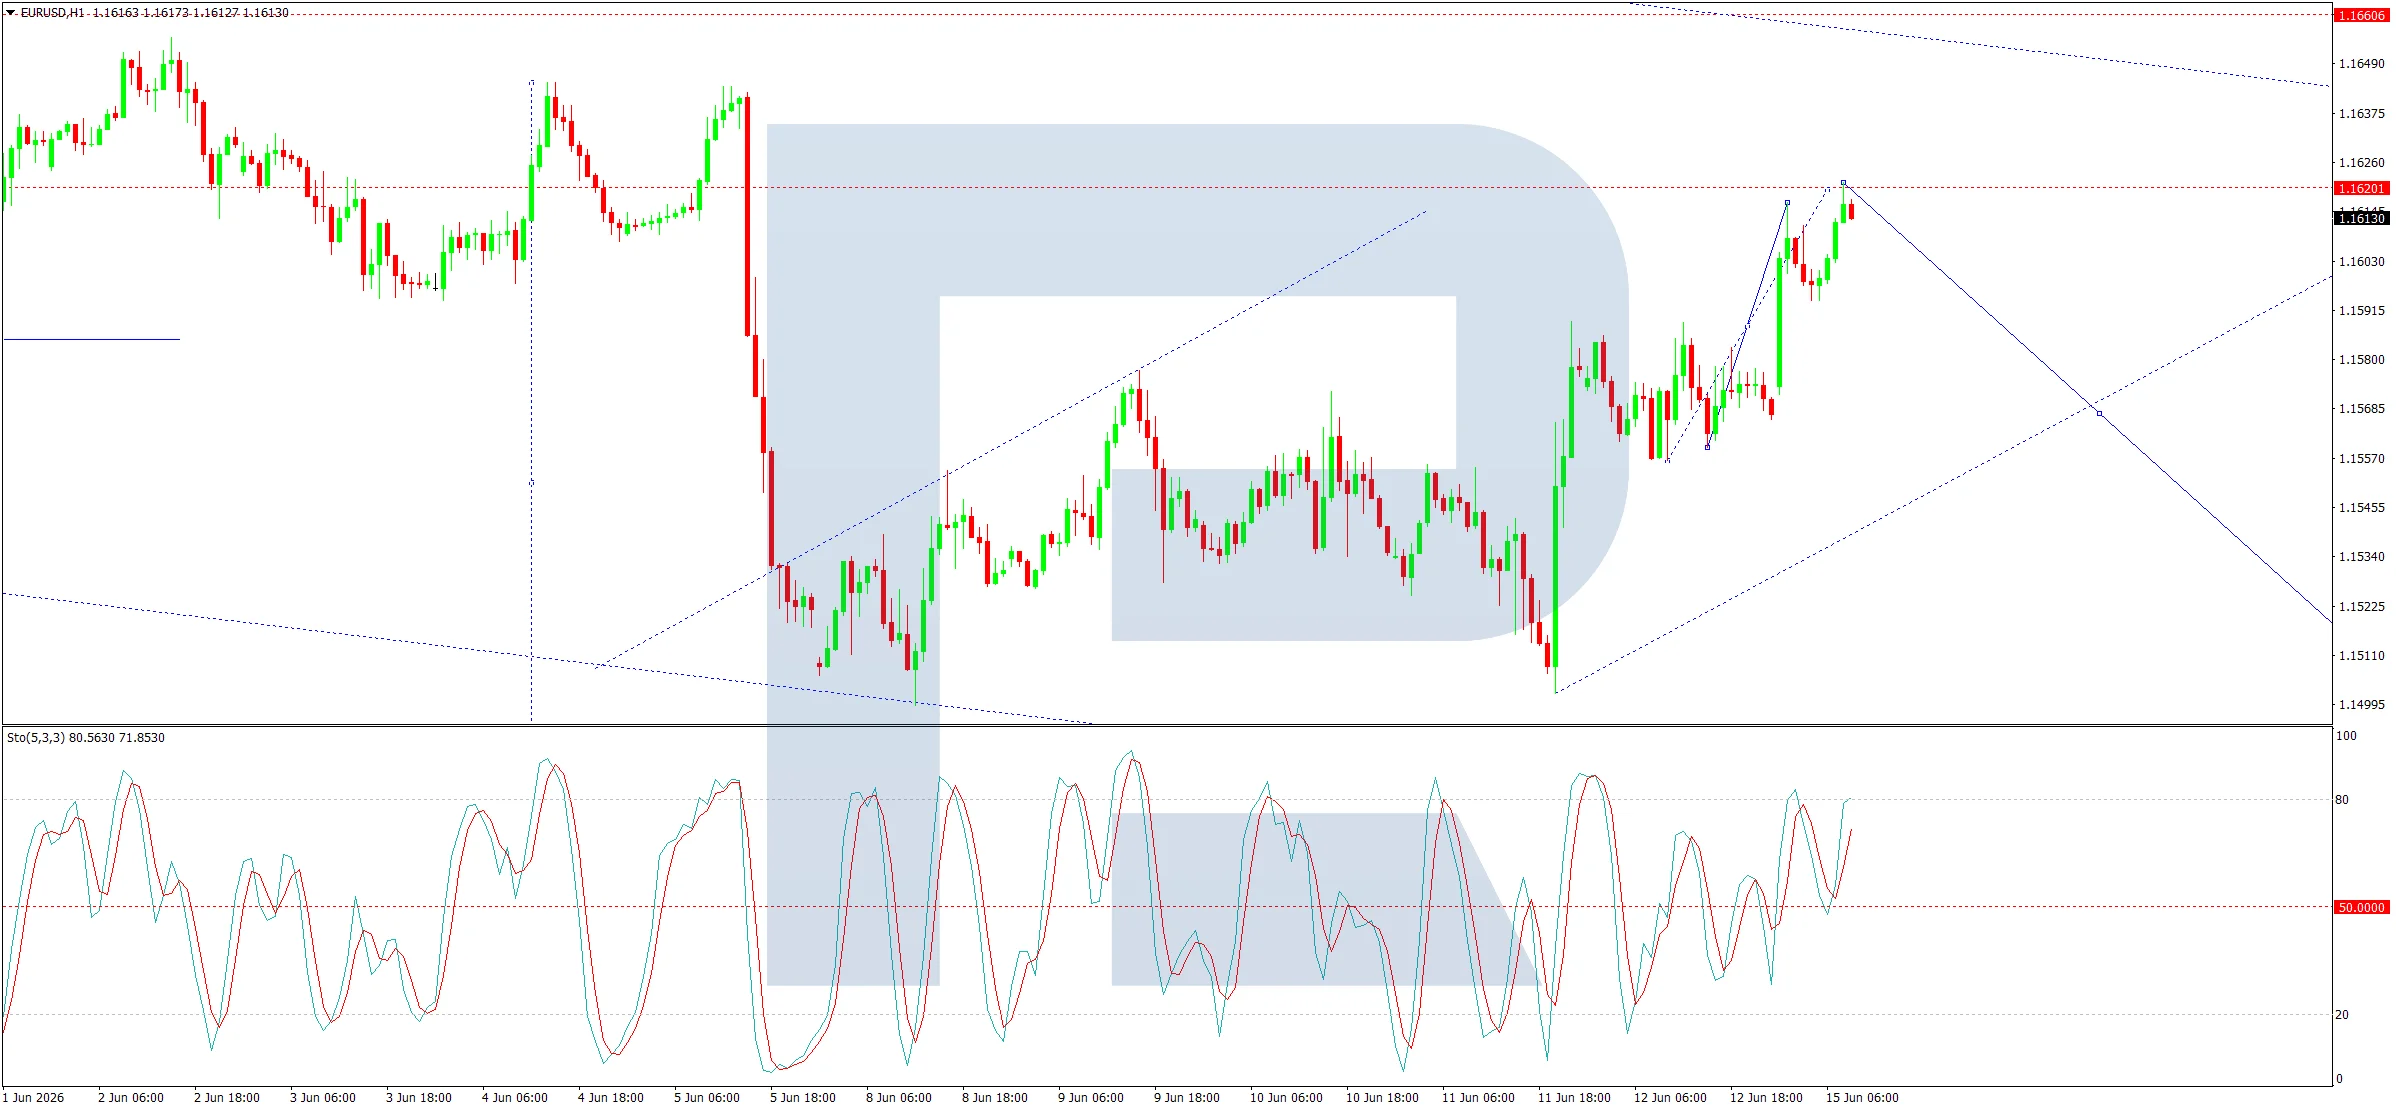
On the 1-hour chart, the market has completed an upward wave toward 1.1612 and is currently consolidating just below this level.
The immediate outlook suggests an expansion of this consolidation range—downward to 1.1500 and upward to 1.1550—before a broader decline resumes toward 1.1444.
Technical Confirmation: This scenario is backed by the Stochastic oscillator, where the signal line has crossed below the 80 level and is heading straight down toward 20, signaling oversold conditions ahead.
Conclusion
EURUSD faces a critical week ahead with the upcoming Federal Reserve meeting and US-Iran nuclear negotiations set to drive significant volatility. Technical indicators suggest that downside risks remain dominant in the near term, with key support levels at 1.1500 and 1.1444 likely to be tested as traders await clarity on monetary policy and geopolitical developments.
Gold’s Bullish Reversal Takes Shape After US-Iran Breakthrough, 4366 Key Test Ahead
The biggest geopolitical breakthrough of 2026 may have just given Gold the catalyst it needed. Gold opened the week with a bullish gap and surged back above 4,300 after Washington and Tehran announced a formal Memorandum of Understanding to end their months-long war.
The agreement, brokered through intensive mediation by Pakistan and Qatar, includes:
- Ceasefire: An immediate and permanent termination of military operations across all fronts, including the conflict in Lebanon.
- The Reopening of the Strait of Hormuz: The critical choke point—through which 20% of the world's oil flows and which has been choked off for months—will officially reopen with full freedom of navigation. President Trump announced he is lifting the U.S. naval blockade of Iranian ports.
- The Timeline: The official signing ceremony is scheduled to take place this coming Friday, June 19, in Switzerland.
- The Nuclear Buffer: Both sides have agreed to a 60-day window for intensive technical negotiations regarding Iran's nuclear program and potential U.S. sanctions relief. For now, Iran has agreed to freeze expansion of its uranium enrichment.
For markets, the significance extends far beyond diplomacy. The Strait of Hormuz carries roughly one-fifth of global oil supplies, and fears of prolonged disruption had been a major driver of inflation concerns over recent months. With oil now rapidly unwinding its war premium, investors are reassessing the outlook for inflation, interest rates and global growth. That shift has helped fuel a powerful rally in Gold, which appears capable of looking beyond the correction that dominated the past several weeks.
The rally has now reached a crucial technical juncture. Gold is closing in on the 4,366.22 cluster resistance zone (38.2% retracement of 4,889.24 to 4,023.57 at 4,354.25). Firm break would strongly suggest that the decline from 4,889.24 has already ended at 4,023.57, just ahead of the key 4,000 psychological support. Next target will be 4,595.14 cluster resistance (61.8% retracement at 4,558.55). Firm break there will pave the way back to 4,889.24 resistance next.
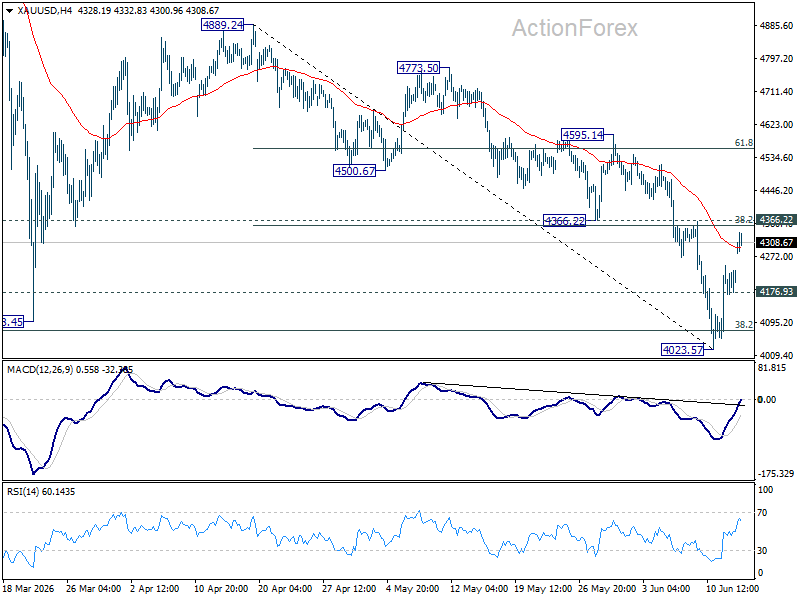
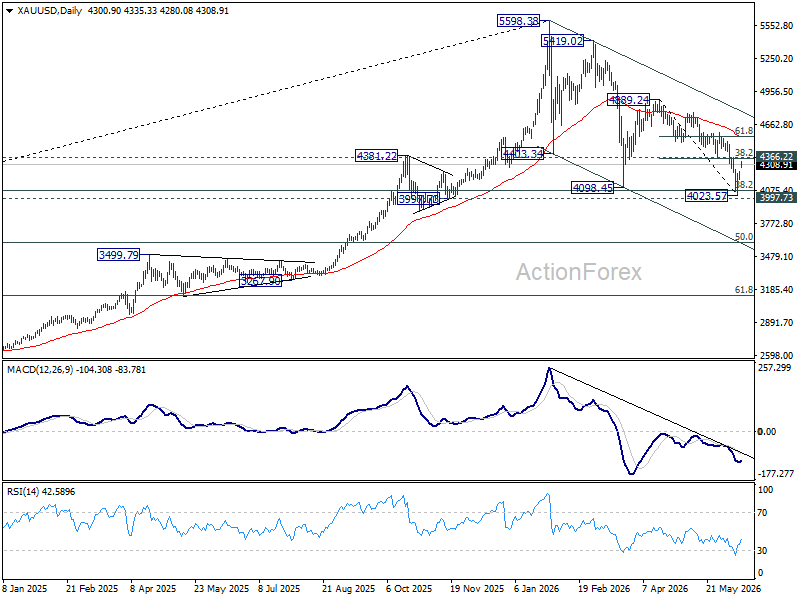
More importantly, the broader bullish structure remains intact. The key 4,000 support zone survived repeated tests during the correction, preserving the view that price action from the 5,998.38 record high is developing into a consolidation rather than a trend reversal. As long as that support area continues to hold, the larger uptrend remains alive. That is, the long term up trend is expected to resume through this high at a later stage.
The diplomatic breakthrough between the US and Iran changed more than the outlook for oil. It may also have provided the turning point that allows Gold to complete its correction and begin the next leg higher. The market now has a level to watch. If 4,366 breaks, the conversation could quickly shift from whether the correction is over to how soon Gold can challenge its record highs again.
Nikkei 225 Strengthens Ahead of the Bank of Japan Decision
Investors are focused on the Bank of Japan's policy meeting on 16 June. According to a Reuters survey published on 10 June, the majority of economists expect the benchmark interest rate to be raised to 1% — a level not seen for decades. The market is also reacting to the Producer Price Index (PPI) data released on 10 June, which points to ongoing inflationary pressures.
For the Japanese market, not only the rate decision itself matters, but also its impact on the yen. Monetary policy expectations influence the outlook for export-oriented companies included in the Japan 225 index (J225 on FXOpen), prompting investors to assess both the BoJ's decision and any signals regarding policy moves in the second half of the year.
Technical Picture
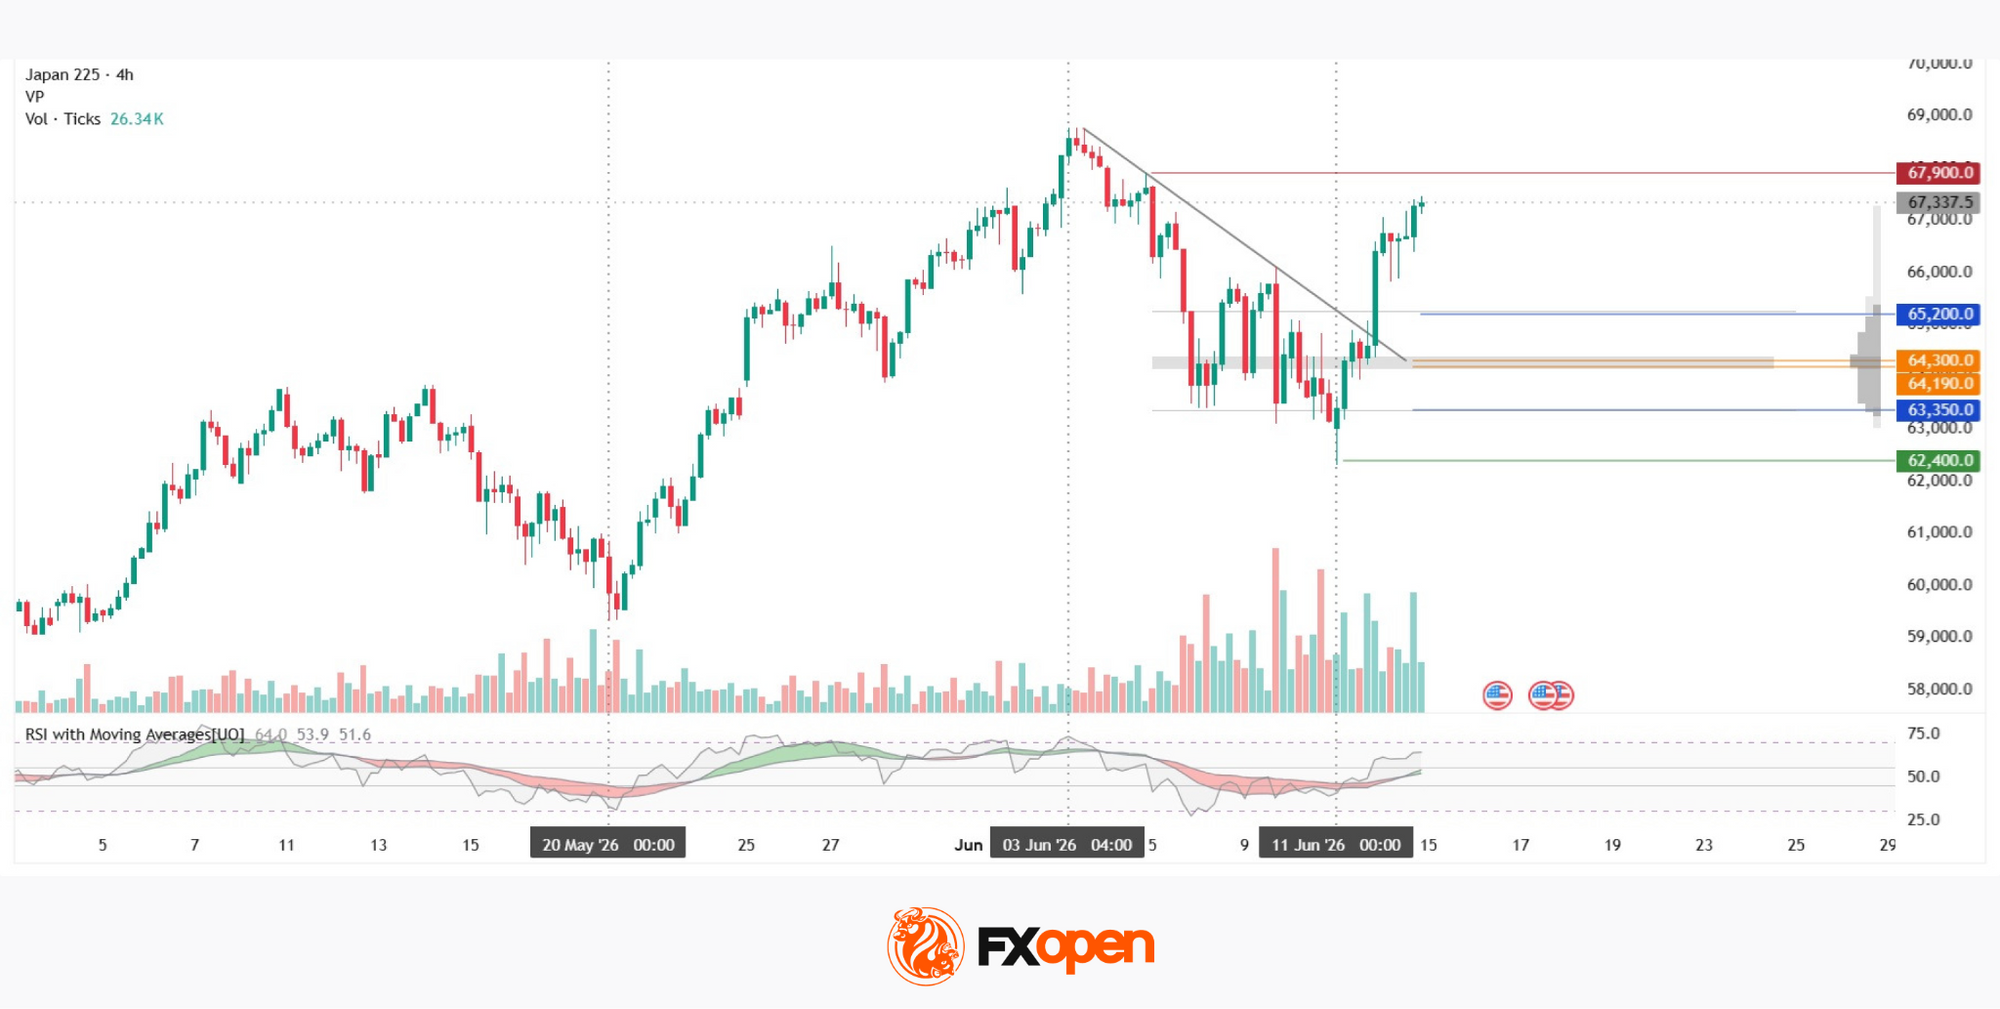
After completing its upward trend near the 68,700 area, the Japan 225 index came under pressure and formed a corrective trend structure. However, sellers have lost momentum in recent sessions, and following the break of the trend, the price has moved above the upper boundary of the profile. If the current bullish impulse persists, the resistance area around 67,900 could attract renewed selling interest. Should buying activity weaken, the upper boundary of the current profile at 65,200 may serve as the nearest support zone.
A deeper decline would bring the Point of Control (POC) area at 64,190–64,300 into focus. If sellers manage to push the price below both the POC and the lower boundary of the profile, the green support zone around 62,400 could become the next key downside target.
RSI + MAs currently shows readings of 64, 53 and 51. The main RSI line remains above both averages and has not yet entered overbought territory. The moving averages are turning higher and have approached the upper boundary of the neutral zone near 55. It is also worth noting the elevated trading volume recorded on 12 June, which adds significance to the current market setup.
Key Takeaways
The market is awaiting the Bank of Japan's interest-rate decision amid a recovery following the recent correction. The next move may depend both on the regulator's rhetoric and on the market's ability to remain above the upper boundary of the profile. RSI + MAs remains in the green.
Trade global index CFDs with zero commission and tight spreads (additional fees may apply). Open your FXOpen account now or learn more about trading index CFDs with FXOpen.
This article represents the opinion of the Companies operating under the FXOpen brand only. It is not to be construed as an offer, solicitation, or recommendation with respect to products and services provided by the Companies operating under the FXOpen brand, nor is it to be considered financial advice.
ECB’s Lagarde Sees Broader Inflation Effects Despite Iran Peace Progress
ECB President Christine Lagarde warned that elevated energy prices are no longer confined to fuel markets and are increasingly feeding into broader inflation across the Eurozone economy. Speaking to France Culture on Monday, Lagarde said the indirect effects of inflation have become visible "more or less everywhere" in recent weeks, highlighting growing concerns that the energy shock triggered by geopolitical tensions is becoming more deeply embedded.
Her comments reinforce the ECB's recent focus on second-round inflation effects, where higher energy costs gradually pass through to transportation, production and consumer prices. Such spillovers complicate the policy outlook as policymakers assess whether inflation pressures will ease naturally as oil prices retreat or persist even after the initial shock fades.
At the same time, Lagarde welcomed the latest announcement that Washington and Tehran had reached an agreement to end the conflict, describing it as "good news." She said any peace deal that helps restore normal traffic through the Strait of Hormuz should be viewed positively, adding that geopolitical tensions globally appear to be "easing". However, her remarks suggest the ECB remains alert to the possibility that inflationary damage has already spread beyond energy markets, even as oil prices decline.
Sunrise Market Commentary
Markets
The US and Iran have reached a deal. The news was confirmed by all parties involved, a first. Rumours circulated since President Trump backtracked late Thursday on renewed attacks on Iran and instead announced the end of the war. He then added on Friday that an agreement was near, floating the possibility of signing it as soon as last weekend. The optimism this time around was shared by Iranian sources as well, even though the official communication from the Middle Eastern country remained more cautious. Sealing the deal over the weekend proved too ambitious, with Israel’s attack on Beirut causing last-minute frictions. But officials from both the US and Iran have now agreed to meet in Switzerland on June 19 to formally sign the agreement. The exact text of the MoU will be published thereafter, but among the provisions that matter are a 60-day extension to the April 8 ceasefire, the gradual reopening of the Strait of Hormuz and the lifting of the US naval blockade. After the signing, nuclear talks will begin. The unfreezing of blocked Iranian funds, a key demand, would be phased and dependent on the progress of those talks. This is one of the biggest risks for any deal to still unravel at a later stage. Continued military attacks by Israel in Lebanon are another. Iran had always been adamant that hostilities must end in Lebanon as well. Israel, in the meantime, has already informed the world that it is not bound by the US-Iran agreement.
Markets are keen to look at it from the positive side. Brent oil prices crashed below $90 per barrel on Friday and deepened losses today to $83.6. That is the lowest level since early March. News timing issues muddy the day-to-day comparison between US and German bonds. The combined decline in US Treasury yields since the war news flow improved amounts to 9-13 bps, including this morning’s move. German rates eased 1.5-6.2 bps in a bull steepening move on Friday and are set for a sharp drop at today’s open. Euro area money markets, for now, still assume at least one more ECB rate hike later this year. President Lagarde, in a speech this morning, justified Thursday’s move by saying second-round effects were emerging. She welcomed the agreement but added that the central bank is very closely monitoring services inflation. Asian stock markets are rallying at breakneck pace. Japanese and South Korean equities are up around 5%. European and US futures suggest a 1.5% higher open. The US dollar trades on the back foot, weighed down by risk-on sentiment and lower oil prices. EUR/USD climbs back above 1.16. The trade-weighted DXY dollar index slides to 99.4 compared with a recent intraday high of 100.31. We expect the current market sentiment to hold on a day-to-day basis ahead of this week’s key events, including the Fed, BoJ and BoE policy meetings. UK politics also return to the fore with the Manchester by-election (June 18), setting the stage for a challenge to Prime Minister Starmer.
News & Views
Inflation in Brazil in May again rose faster than expected at 0.58% M/M and 4.72% Y/Y (compared with 0.67% M/M and 4.39% Y/Y in April). As such, the Y/Y measure surpassed the upper end of the central bank’s 3% ± 1.5% target range. On a monthly basis, the increase was mainly due to higher food and beverage prices (1.33%), but several other categories also contributed, including housing (1.22%), clothing (0.62%), and health and personal care (0.9%). Transportation costs declined 0.46% M/M, but this came after an already sharp jump in March due to higher oil prices. The central bank meets this week (June 16-17). The bank cut its policy rate by 25 bps at both the March and April policy meetings. The Selic rate currently stands at 14.5%. Even though the real policy rate remains very high, the broadening of inflation into categories related to domestic demand and not solely the result of the energy supply shock might cause the BCB to take a cautious stance on further easing. The real strengthened substantially on Friday, with USD/BRL easing from 5.112 to close at 5.059. Aside from domestic considerations, some dollar weakness is also at play.
In an article in The Times, Bank of England Governor Bailey defended both the buying of government bonds by the central bank during the global financial crisis and the Covid crisis, as well as the current reduction of bond holdings. The BoE governor indicated that quantitative easing provided crucial support to the economy during periods of crisis and that the overall impact of the QE programme on taxpayers was broadly neutral. He argued that the active selling of bonds, in addition to allowing bonds to mature, tightens monetary policy, but should be paused now, as it would leave the BoE in a stronger position to purchase assets again in the future if needed.