
Sample Category Title
USD/CAD Daily Outlook
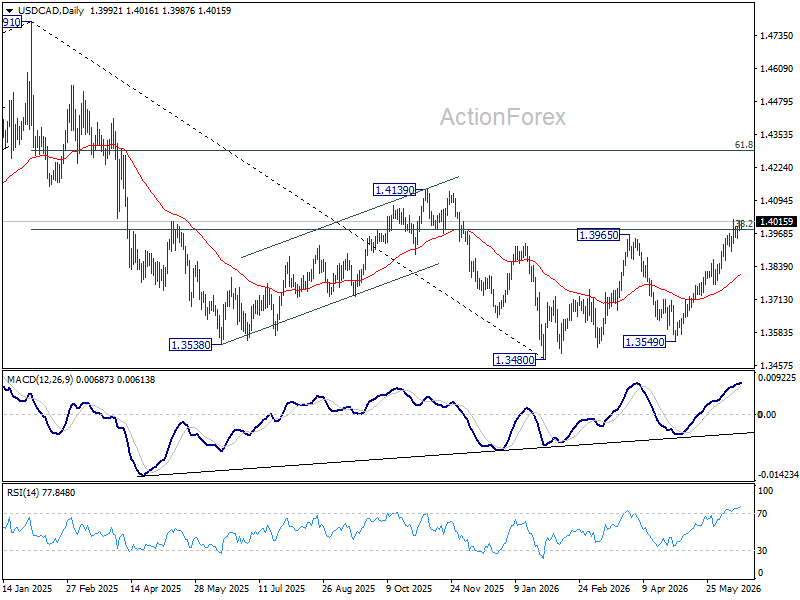
USD/CAD is still bounded in range below 1.4023 and intraday bias stays neutral. Further rise is expected as long as 1.3897 support holds. On the upside, sustained break of 38.2% retracement of 1.4791 to 1.3480 at 1.3981. Decisive break there will carry larger bullish implications and target 61.8% retracement at 1.4290 next. However, firm break of 1.3897 will turn bias back to the downside for deeper pullback.
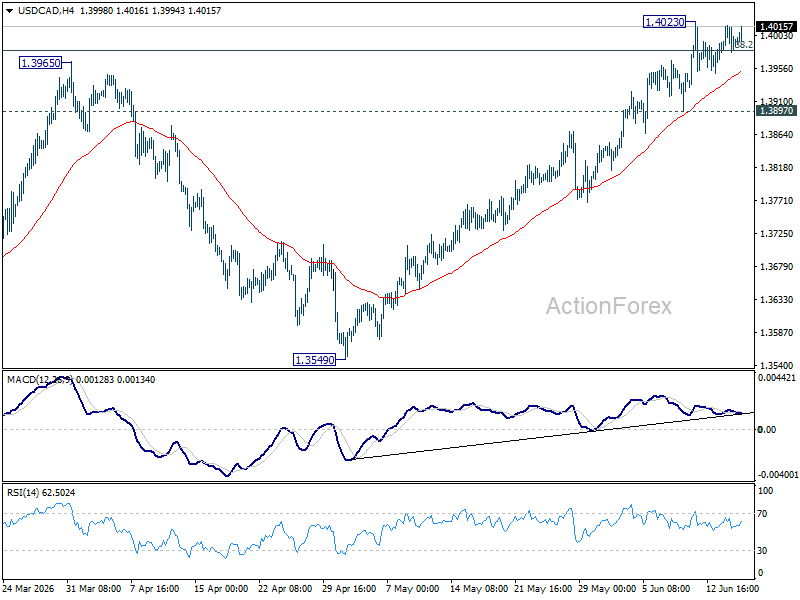
In the bigger picture, price actions from 1.4791 are seen as a corrective pattern to the whole up trend from 1.2005 (2021 low). Rejection by 38.2% retracement of 1.4791 to 1.3480 at 1.3981 will keep the decline intact, and bring another fall through 1.3480 at a later stage. However, firm break of 1.3981 will argue that the decline has completed, and set up further rise back to retest 1.4791 instead.
GBP/JPY Daily Outlook
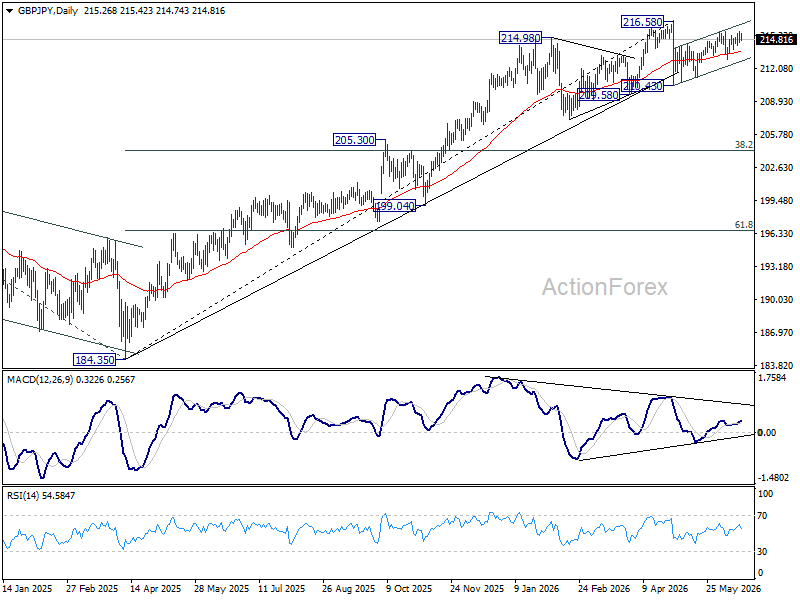
No change in GBP/JPY's outlook and intraday bias stays neutral for the moment. On the upside, above 215.59 will resume the rise from 210.43 to retest 216.58 high. On the downside, break of 212.90 will resume the fall from 215.59 to 211.23 support first.
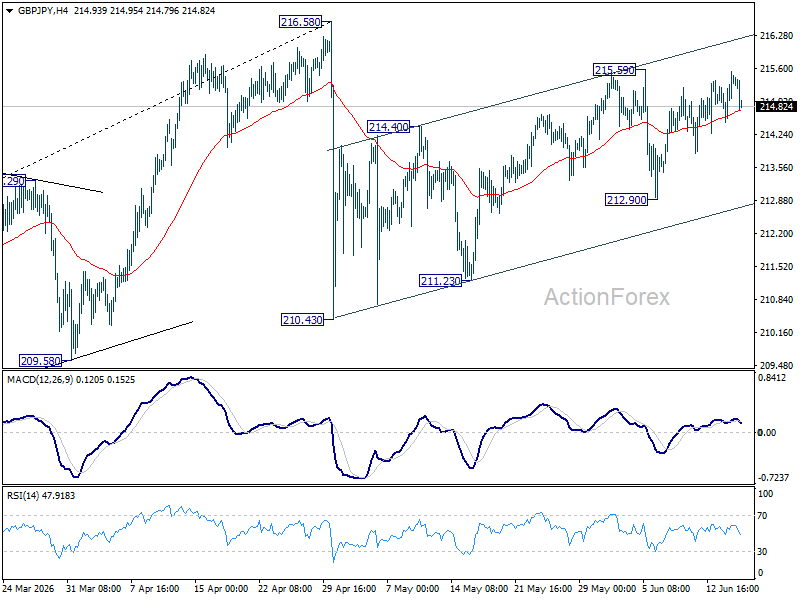
In the bigger picture, there is no clear sign of trend reversal yet. The long term up trend could still extend to 61.8% projection of 148.93 (2022 low) to 208.09 (2024 high) from 184.35 at 220.90 on resumption. However, sustained break of 55 W EMA (now at 207.11) will argue that it's already in medium term down trend for 184.35 support.
EUR/JPY Daily Outlook
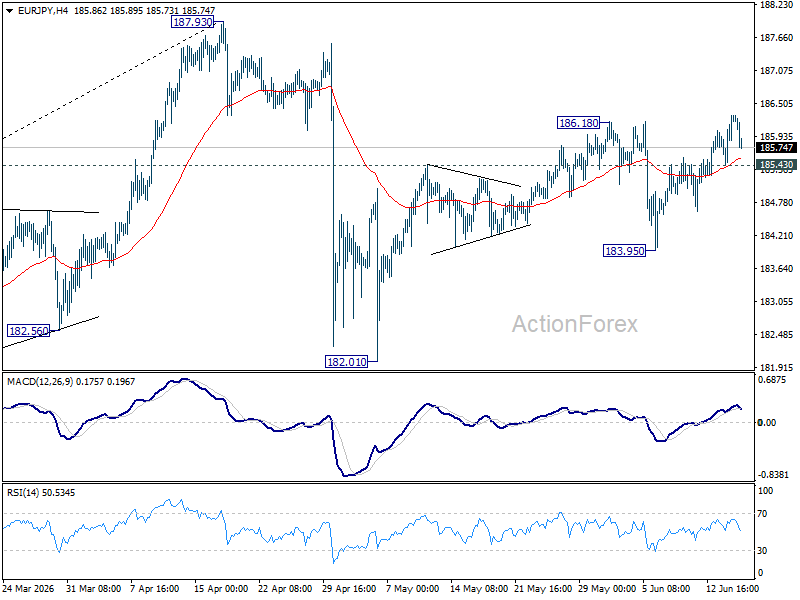
Intraday bias in EUR/JPY is mildly on the upside with breach of 186.18 resistance. Rebound from 182.01 is resuming and would target a retest on 187.93 high. On the downside, below 185.43 minor support will turn bias neutral again. Further break of 183.95 will target 182.01 support and below.
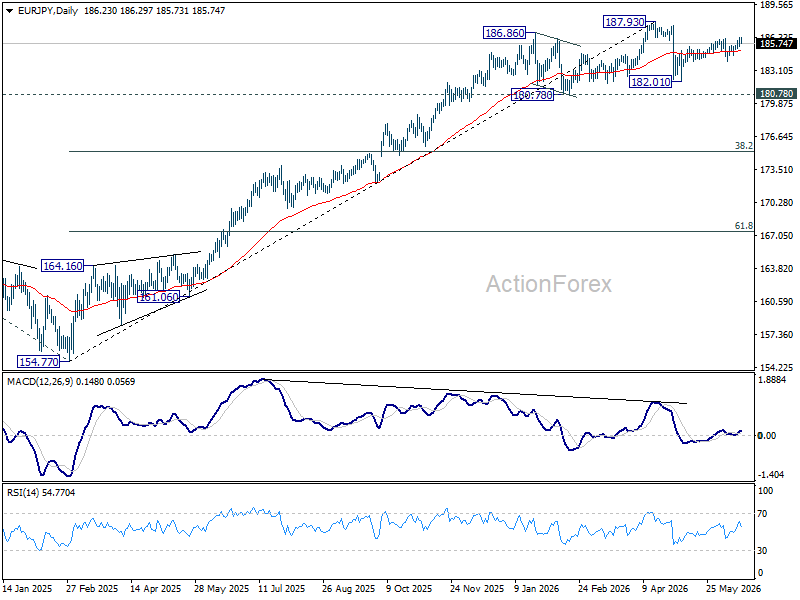
In the bigger picture, there is no sign of reversal yet. Uptrend from 114.42 (2020 low) is still expected to resume at a later stage to 78.6% projection of 124.37 (2022 low) to 175.41 (2025 high) from 154.77 at 194.88. However, sustained break of 55 W EMA (now at 179.23) will argue that it's already in a medium term down trend to 175.41 resistance turned support and below.
EUR/GBP Daily Outlook
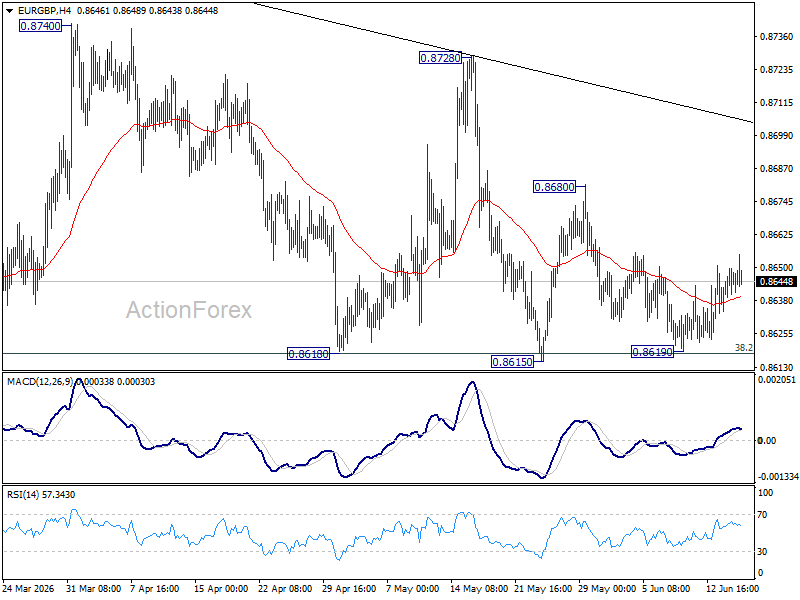
Intraday bias in EUR/GBP remains neutral as sideway trading is in progress On the downside, decisive break of 0.8610 support will revive the case of bearish trend reversal. However, on the upside, break of 0.8680 resistance will bring stronger rebound back to 0.8728 instead.
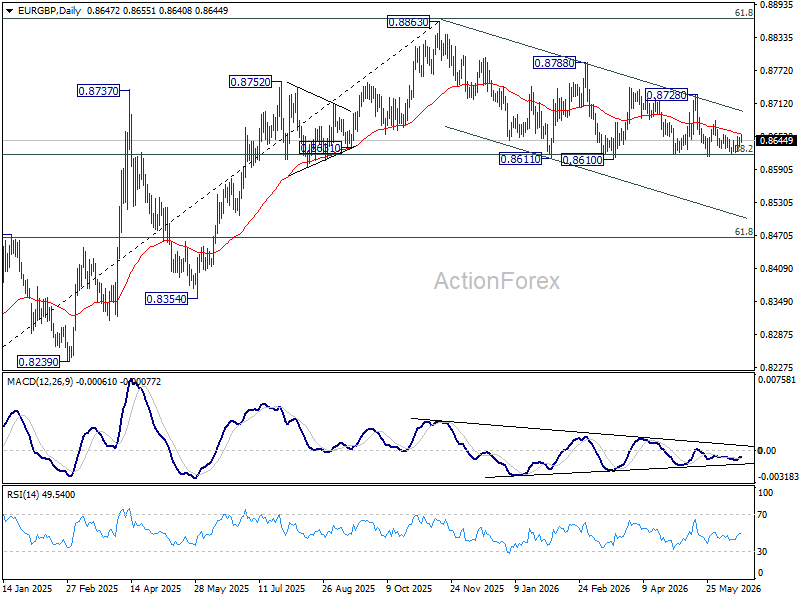
In the bigger picture, focus is staying on 38.2% retracement of 0.8821 to 0.8863 at 0.8618. Strong rebound from there will retain medium term bullishness. Rise from 0.8221 should resume through 0.8863 at a later stage. Nevertheless, sustained break of 0.8618 will confirm that whole rise from 0.8221 has completed at 0.8863. Deeper decline should then be seen to 61.8% retracement at 0.8466 at least.
EUR/AUD Daily Outlook
EUR/AUD recovered mildly today as consolidation from 1.6156 continues. Intraday bias stays neutral and further rise will remain in favor as long as 1.6334 minor support holds. Above 1.6516 will resume the rebound from 1.6108, and target 1.6842 resistance. However, firm break of 1.6334 will turn bias back to the downside for 1.6108/6186 support zone instead.
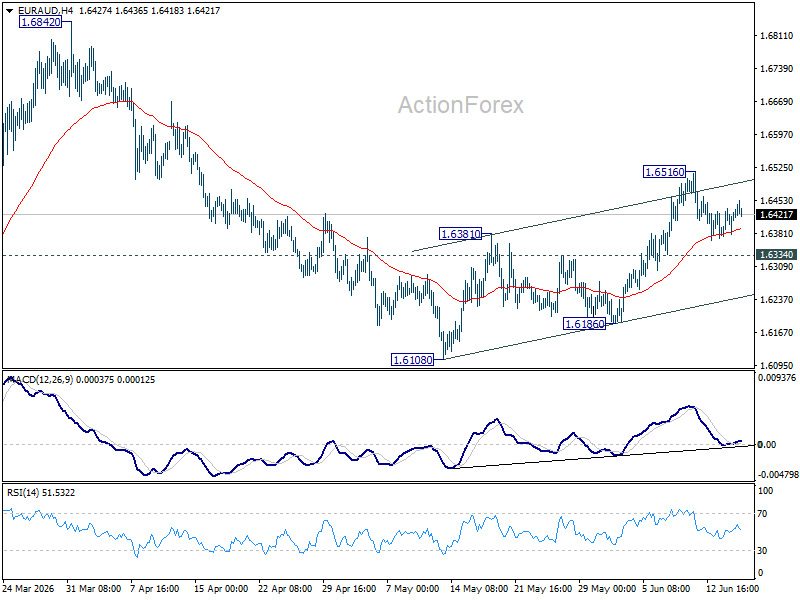
In the bigger picture, outlook will stay bearish as long as 1.6842 resistance holds. Fall from 1.8554 (2025 high) is expected to continue to 61.8% retracement of 1.4281 to 1.8554 at 1.5913. Decisive break there will pave the way back to 1.4281 (2022 low). However, firm break of 1.6842 should confirm medium term bottoming, and bring stronger rally.

EUR/CHF Daily Outlook
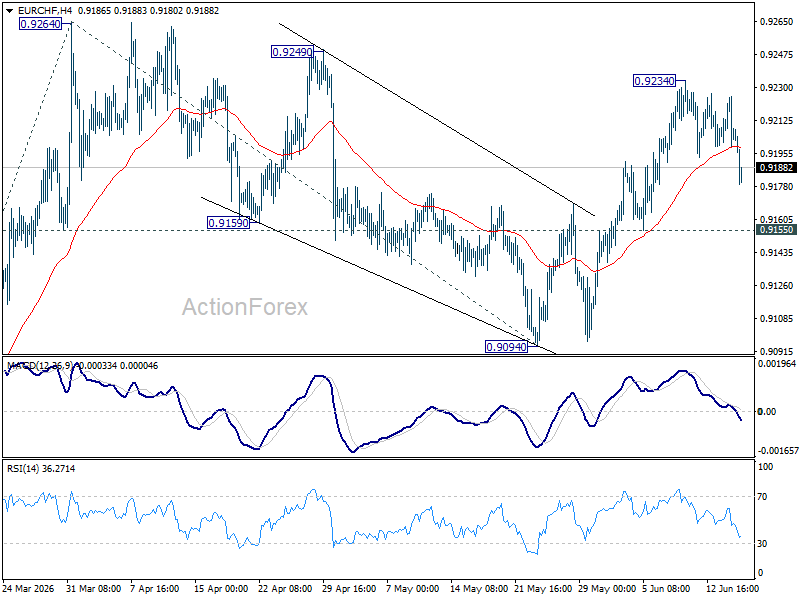
EUR/CHF's retreat form 0.9234 extended lower today, but downside is contained well above 0.9155 support. Intraday bias remains neutral and further rally is still in favor. On the upside, above 0.9234 will bring retest of 0.9264 first. Firm break there will resume the rally from 0.8979 to 100% projection of 0.8979 to 0.9264 from 0.9094 at 0.9379. However, decisive break of 0.9155 will turn bias back to the downside for 0.9094 support instead.
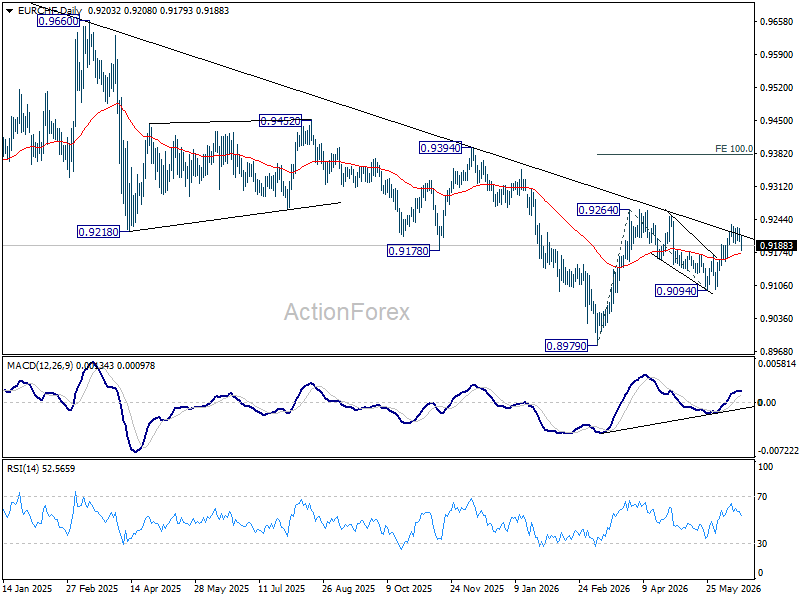
In the bigger picture, as long as 0.9394 resistance holds, down trend from 0.9928 (2024 high) could still be in progress. Firm break of 0.8979 will confirm down trend resumption. However, decisive break of 0.9394 will be an important sign of medium term bullish reversal.
USD/JPY Analysis: BoJ Tightens the Grip — Will the Yen Reverse Course?
On June 16, the Bank of Japan raised its policy rate to 1.0% (7-1 vote) and confirmed a gradual taper of government bond purchases, settling at a "cruising" pace of ¥2 trillion monthly from April 2027. The message is clear: normalisation continues, as inflation risks remain skewed to the upside of the 2% target.
For the yen, the medium-term picture remains constructive, though not without friction — one dissenter warned that Middle East tensions threaten output and jobs more than prices. The BoJ has also built itself a safety net, ready to intervene should yields spike unexpectedly.
Technical Analysis
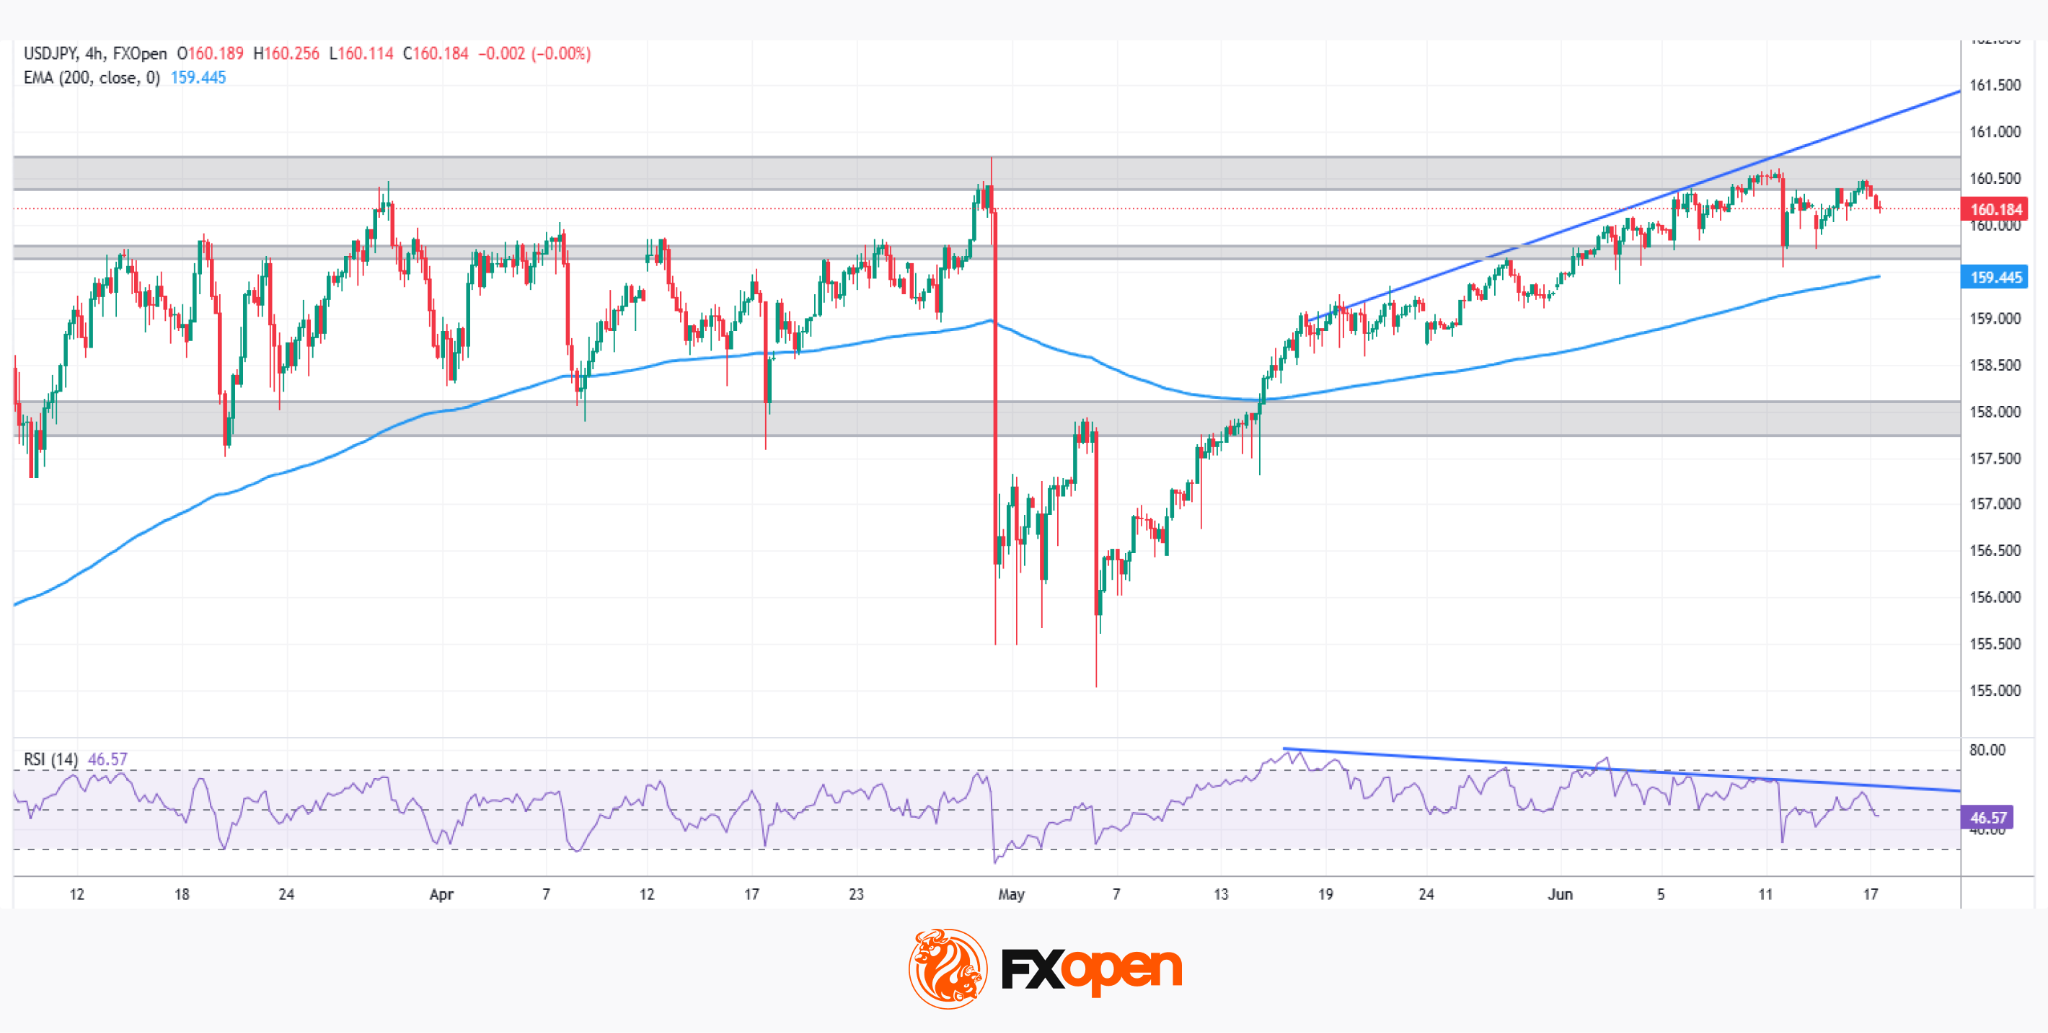
The rate hike didn’t boost the yen. Still, USD/JPY continues to struggle against the formidable resistance at 160.00, a level that carries weight both psychologically and technically. This zone has already rejected multiple advances throughout 2026, and price now approaches it once again — setting the stage for a decisive test.
Bullish scenario: a confirmed break above 160.00-161.00 would need to be followed by a retest on the 4H chart, with a subsequent break of the highs that triggered the initial move — only then would the breakout gain real confirmation, opening the path toward 162.00 and a retest of the 2024 highs. Without this follow-through, the pair may continue to struggle beneath this psychological ceiling, capped by repeated rejection.
Bearish scenario: early confirmation of a reversal would come from a break of the first key support at 159.60-159.80, where the 200-period EMA on the 4H chart is already being tested, much as it has held in the past. A more decisive support could be at 157.80-158.00; a break below this level could trigger a sharper decline. Reinforcing the bearish case is a notable RSI divergence since 18 May, with lower highs on the oscillator against higher highs on price — a classic signal of fading bullish momentum.
The line in the sand is drawn at 160.00-161.00: whoever crosses it first, dollar or yen, will likely set the tone for the months ahead.
Trade over 50 forex markets 24 hours a day with FXOpen. Take advantage of low commissions, deep liquidity, and spreads from 0.0 pips (additional fees may apply). Open your FXOpen account now or learn more about trading forex with FXOpen.
This article represents the opinion of the Companies operating under the FXOpen brand only. It is not to be construed as an offer, solicitation, or recommendation with respect to products and services provided by the Companies operating under the FXOpen brand, nor is it to be considered financial advice.
Gold: Will the Fed Settle the Matter?
- Gold is eagerly awaiting the central bank’s decision.
- The rebound in gold prices is due to weaker headwinds.
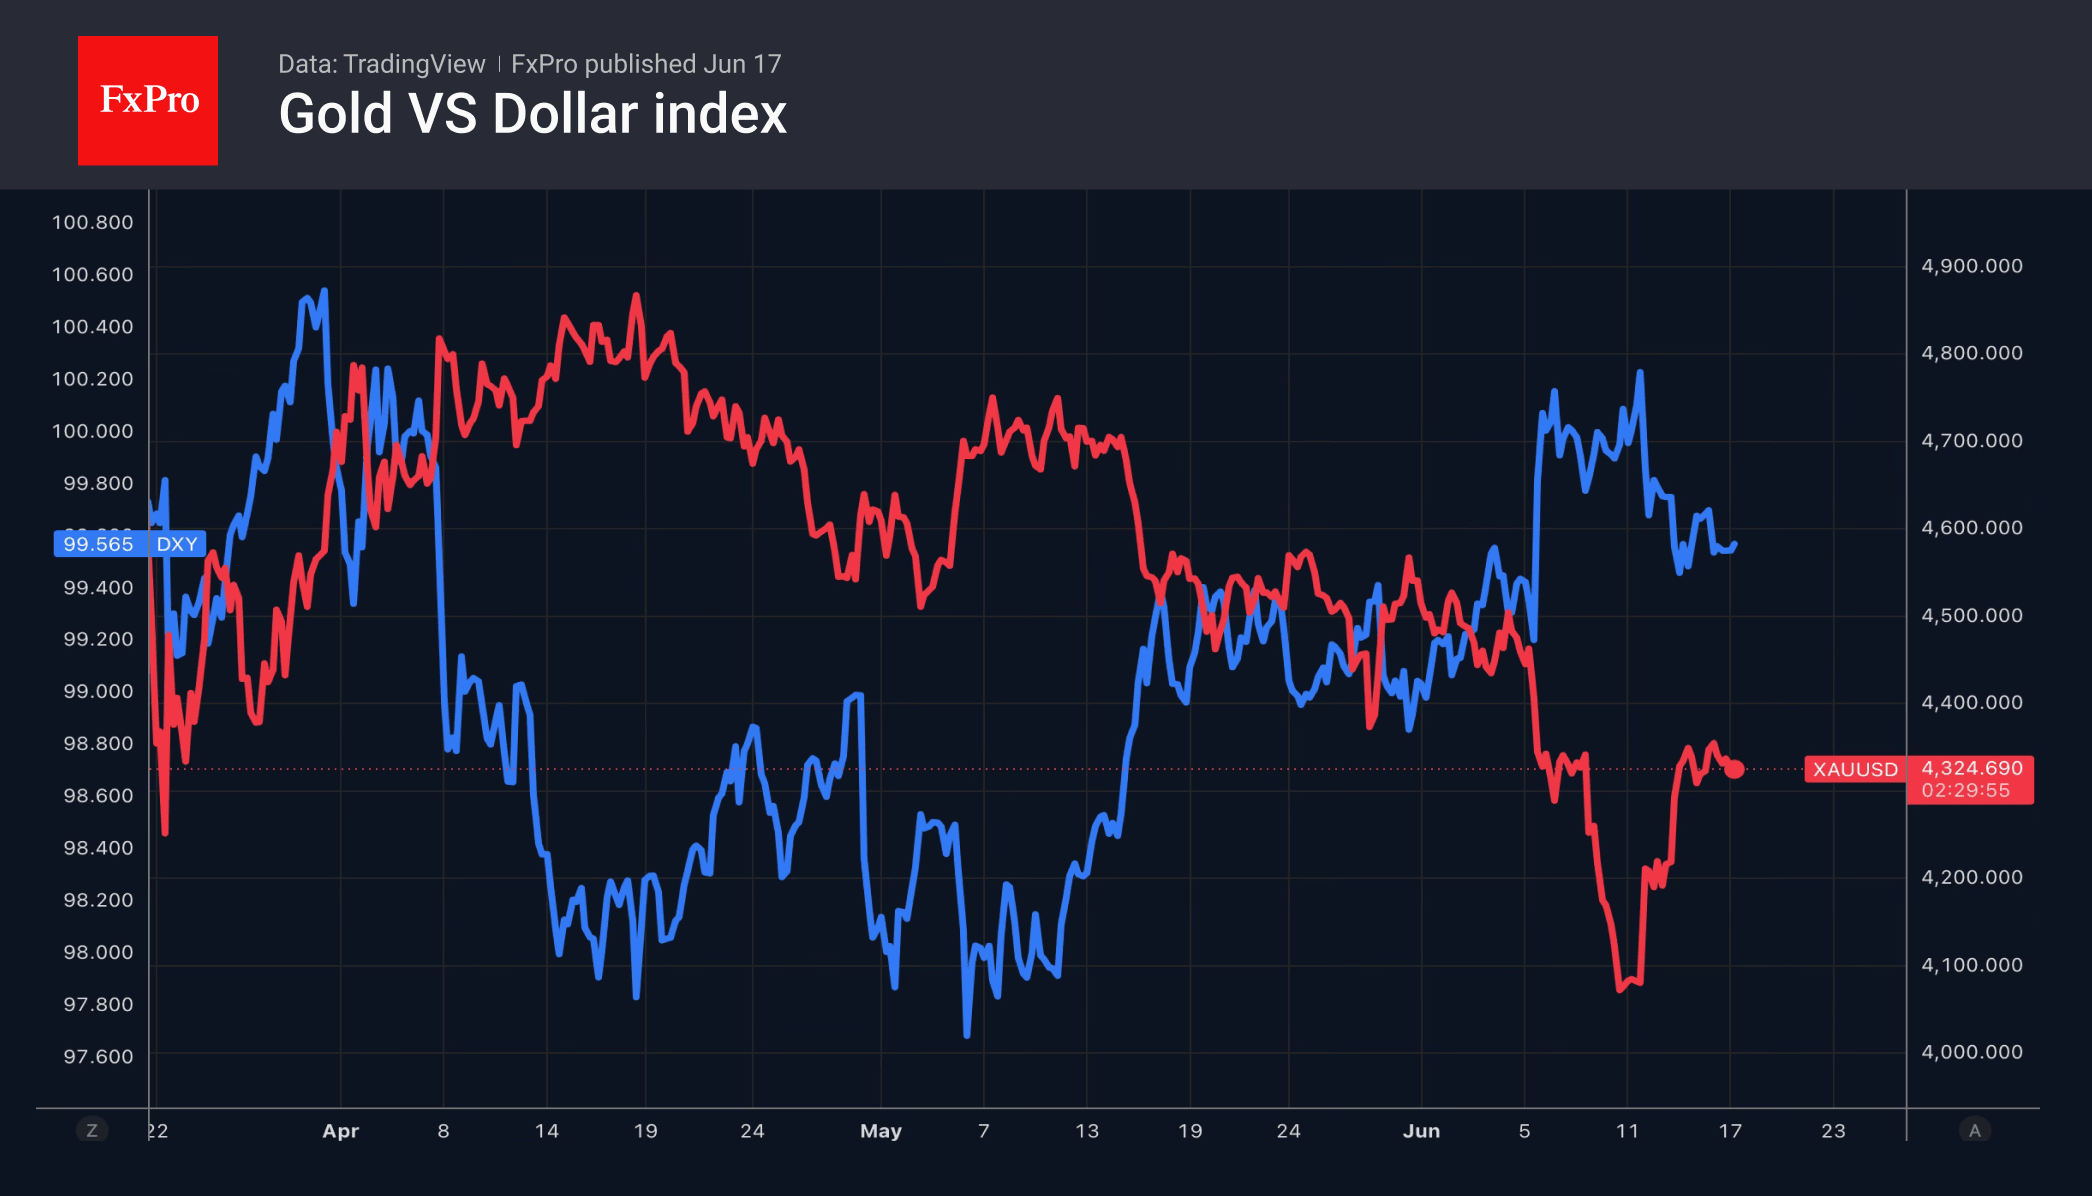
The US dollar continues to retreat as geopolitical risks ease, and concerns about Kevin Warsh’s dovish rhetoric subside. Donald Trump insists that the agreement with Iran is a done deal, which has pushed Brent below $80 a barrel and triggered a recovery rally in US stock indices.
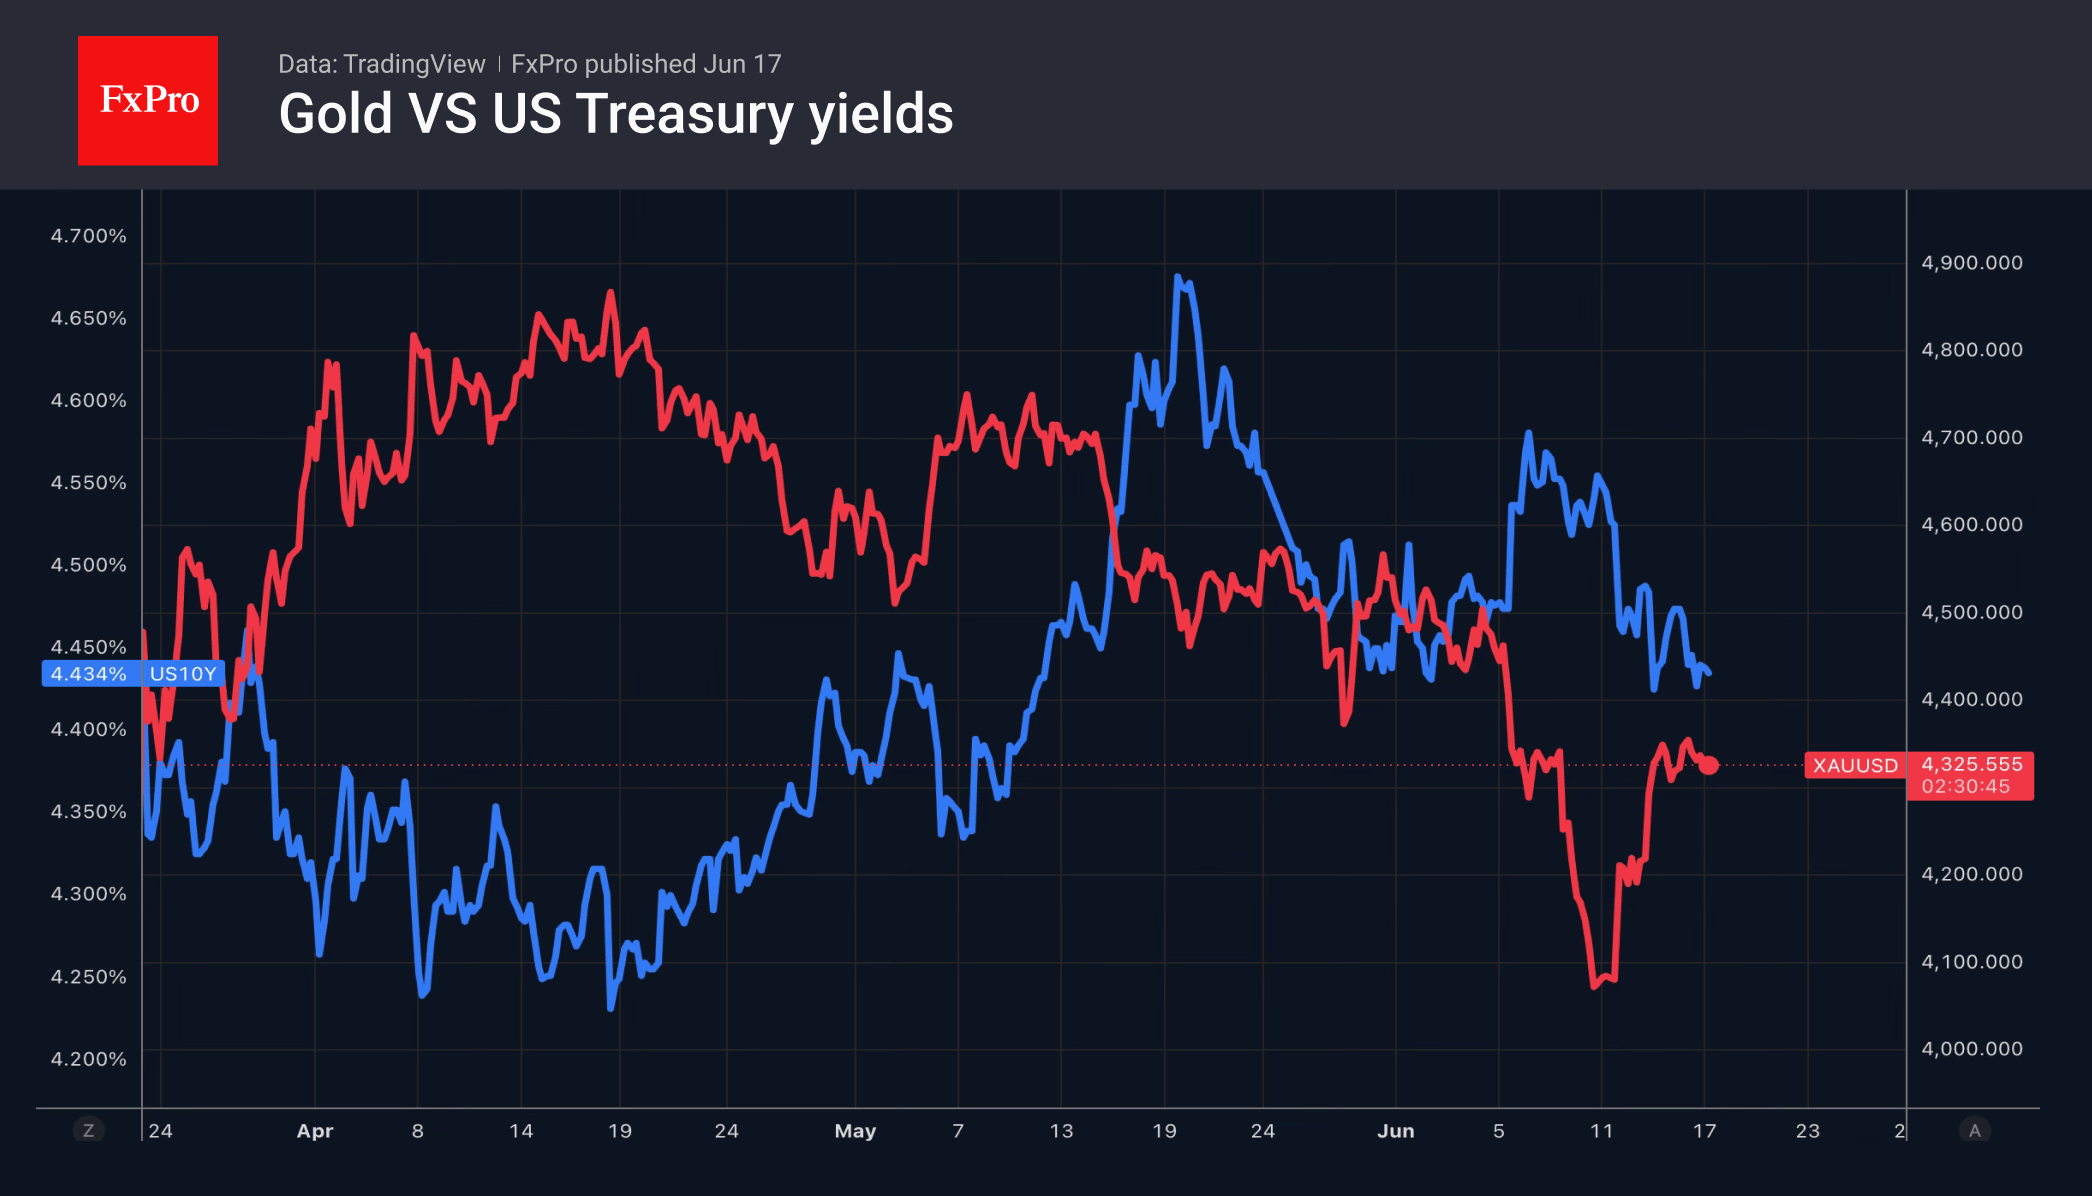
At the same time, fears of a further surge in inflation are receding, as reflected in Treasury bond yields. The precious metal is shifting its focus from the Middle East conflict to monetary policy, re-establishing its correlation with bond prices. The enigmatic nature of Warsh is fuelling fears that the outcome of the meeting could lay the foundations for a long-term weakening of the dollar.
The new chair is an advocate of flexibility at the Fed. He believes the central bank should not paint itself into a corner with forecasts when the future could change significantly. Indeed, by the end of 2025, investors expected interest rates to fall due to a weak labour market and a gradual slowdown in inflation. However, employment is currently growing at its fastest pace since 2023, while consumer prices have surged to 4.2%.
The FOMC’s previous forecasts are out of touch with reality. They assume a cut in interest rates. Investors are now keen to know how many Committee members will signal a rate rise in their updated projections. This conundrum, coupled with the change in wording suggesting that the next step will be a loosening of monetary policy, is the key takeaway from the Fed’s June meeting.
Gold is placing its fate in the hands of the central bank, as the future trajectory of the dollar and US Treasury bond yields depends on the central bank’s decision. The most likely scenario is that the Fed will maintain a ‘wait-and-see’ stance, allowing the precious metal to focus on the fallout from the end of the conflict in the Middle East.
Gold’s rebound from its autumn 2025 low reflects waning headwinds, including the greenback’s strength amid escalating geopolitical tensions, higher energy prices and Treasury yields, as well as reduced demand for bullion from central banks and for ETFs from investors.
The FxPro Analyst Team
Eurozone Core Inflation Accelerates to 2.6% as Services and Energy Drive Prices Higher
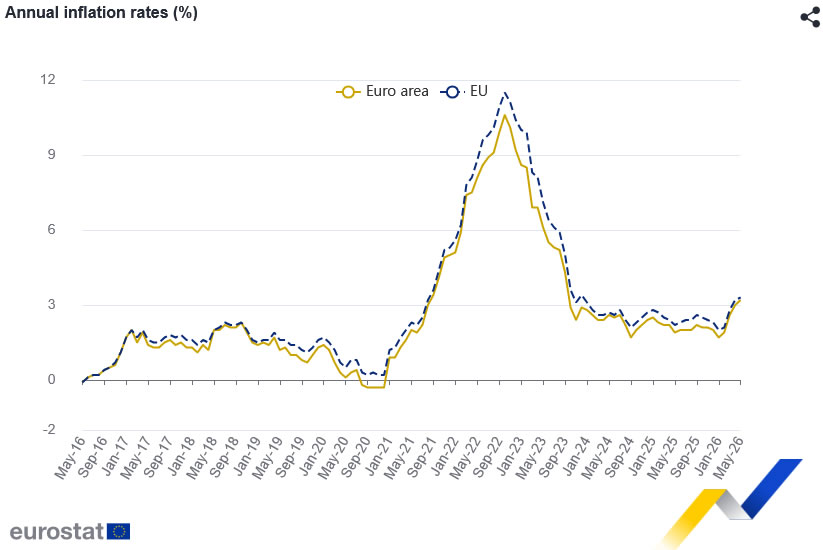
Eurozone inflation was finalized at 3.2% yoy in May, up from 3.0% yoy in April, while core inflation accelerated more sharply from 2.2% yoy to 2.6% yoy. The data confirm that underlying price pressures strengthened across the bloc during the month, reinforcing concerns that inflation is becoming more broad-based despite easing geopolitical tensions and falling oil prices in recent weeks.
Services was the largest contributor to inflation, adding 1.61 percentage points to the headline rate. Energy contributed a further 0.98 percentage points, while food, alcohol and tobacco added 0.36 percentage points and non-energy industrial goods contributed 0.23 percentage points. The figures suggest that inflation is no longer solely an energy story, with domestic services prices continuing to exert significant upward pressure on overall consumer prices.
Across the wider European Union, annual inflation was finalized at 3.3% yoy, up from 3.2% yoy in April. However, inflation trends were highly uneven across member states. Sweden recorded the lowest annual rate at 1.1%, followed by Denmark and Czechia at 1.8%. At the other end of the spectrum, Romania posted inflation of 9.7%, while Bulgaria and Lithuania recorded 6.3% and 5.1% respectively. Compared with April, inflation fell in eleven member states but increased in sixteen.
| Indicator | Apr 2026 | May 2026 | Final |
|---|---|---|---|
| Eurozone CPI Y/Y | 3.0% | 3.2% | 3.2% |
| Eurozone Core CPI Y/Y | 2.2% | 2.6% | 2.6% |
| EU CPI Y/Y | 3.2% | 3.3% | 3.3% |
Contributions to Eurozone Inflation
| Component | Contribution to Headline CPI |
|---|---|
| Services | +1.61pp |
| Energy | +0.98pp |
| Food, Alcohol & Tobacco | +0.36pp |
| Non-Energy Industrial Goods | +0.23pp |
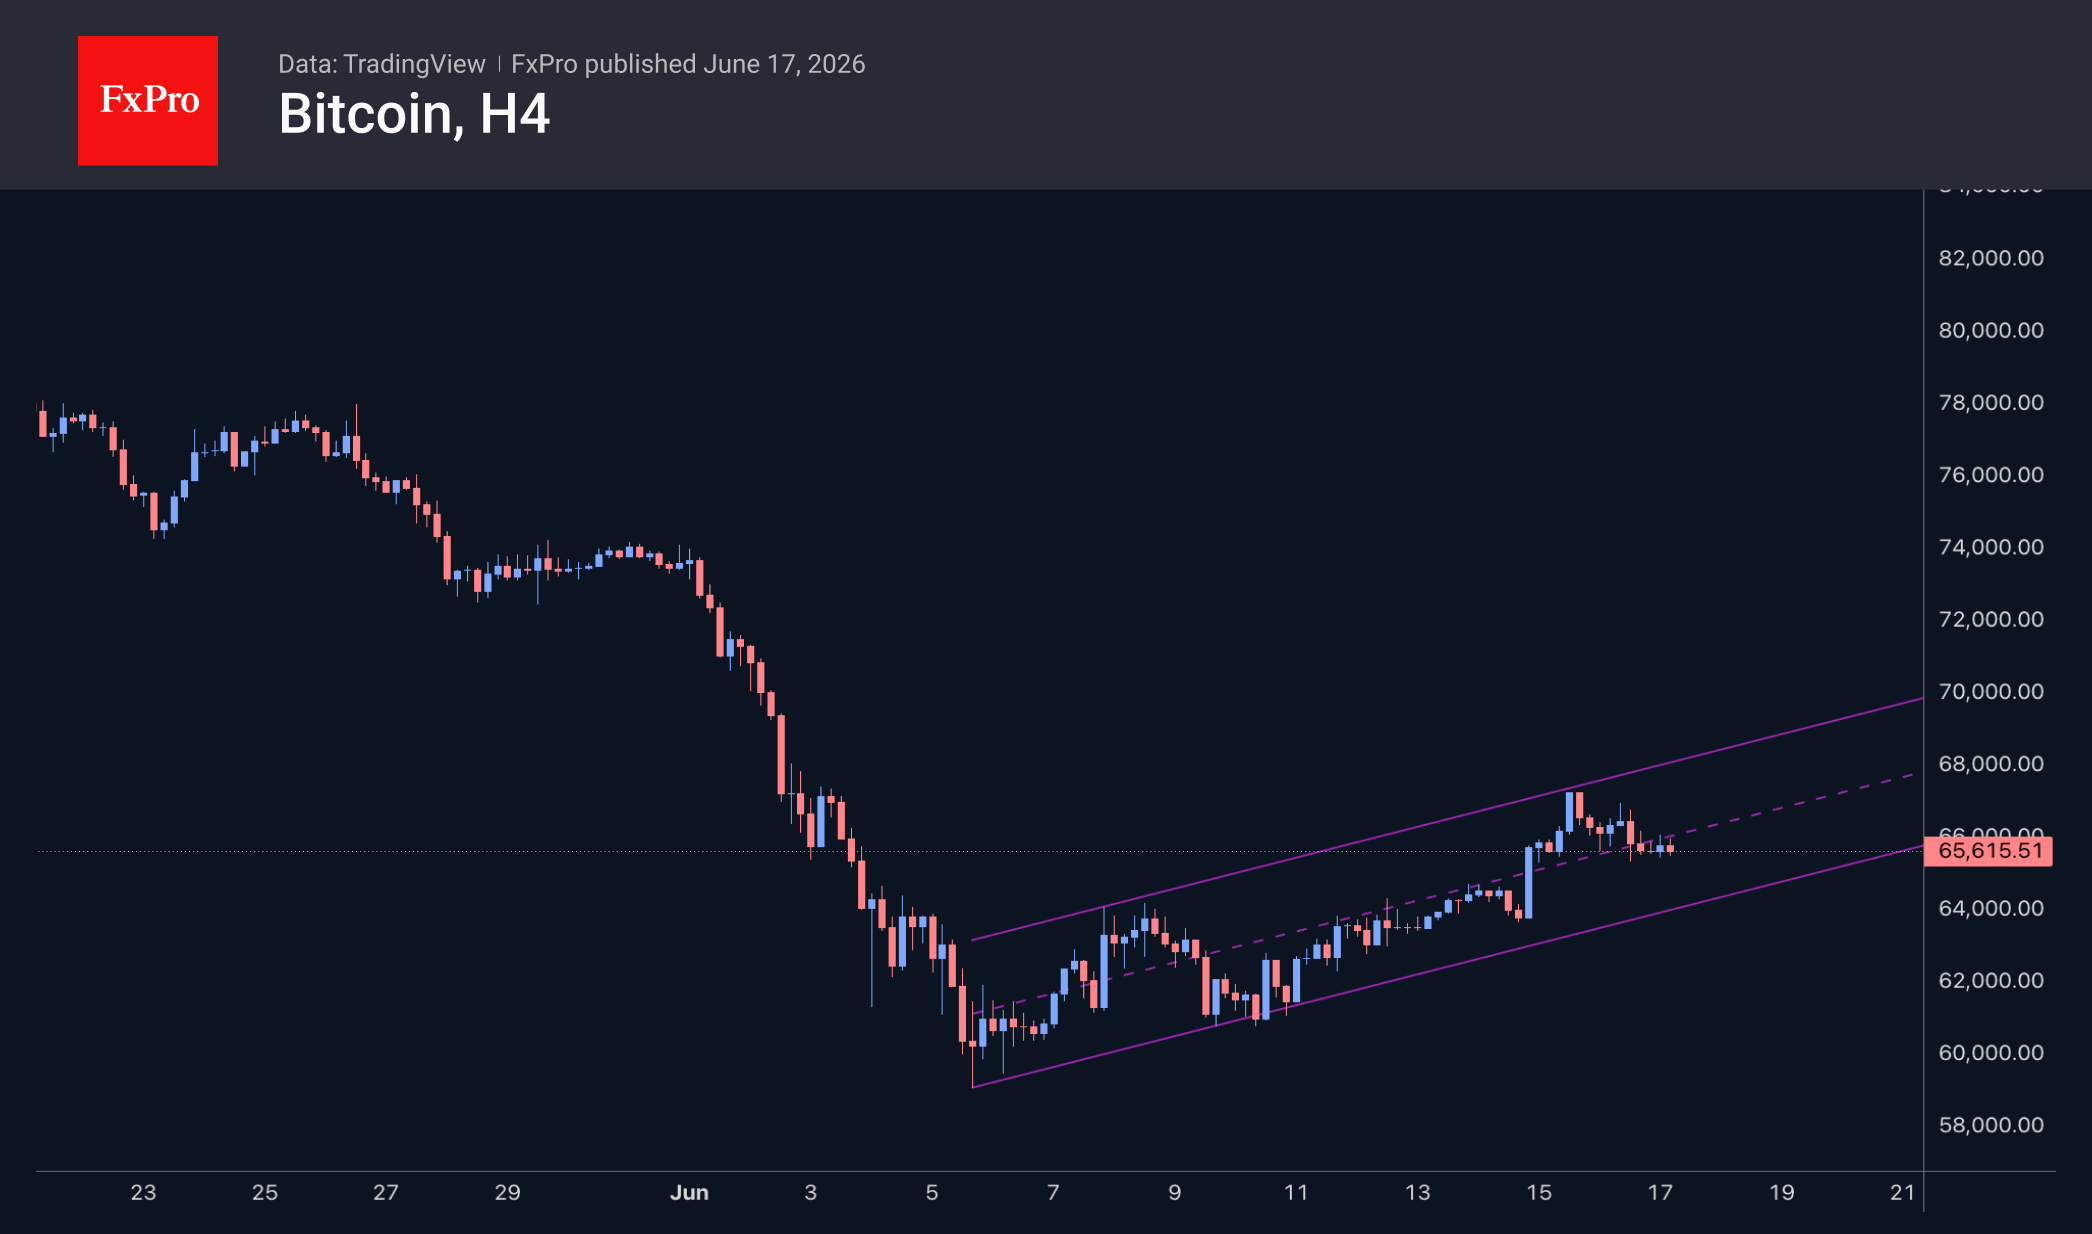
Bitcoin at $65.5K: Rebound Stalls at the 61.8% Fibonacci Level
Market Overview
The crypto market capitalisation has remained steady at $2.26T since Tuesday’s close. Interestingly, such a lull is not being observed in the foreign exchange or equity markets, which refutes the notion of a lull ahead of the new Fed Chair’s first meeting. It appears the recovery rally has lost momentum near the 61.8% Fibonacci retracement level, and cryptocurrency investors are awaiting fresh signals. Should the market reverse lower, it could return to the $2T range fairly quickly.
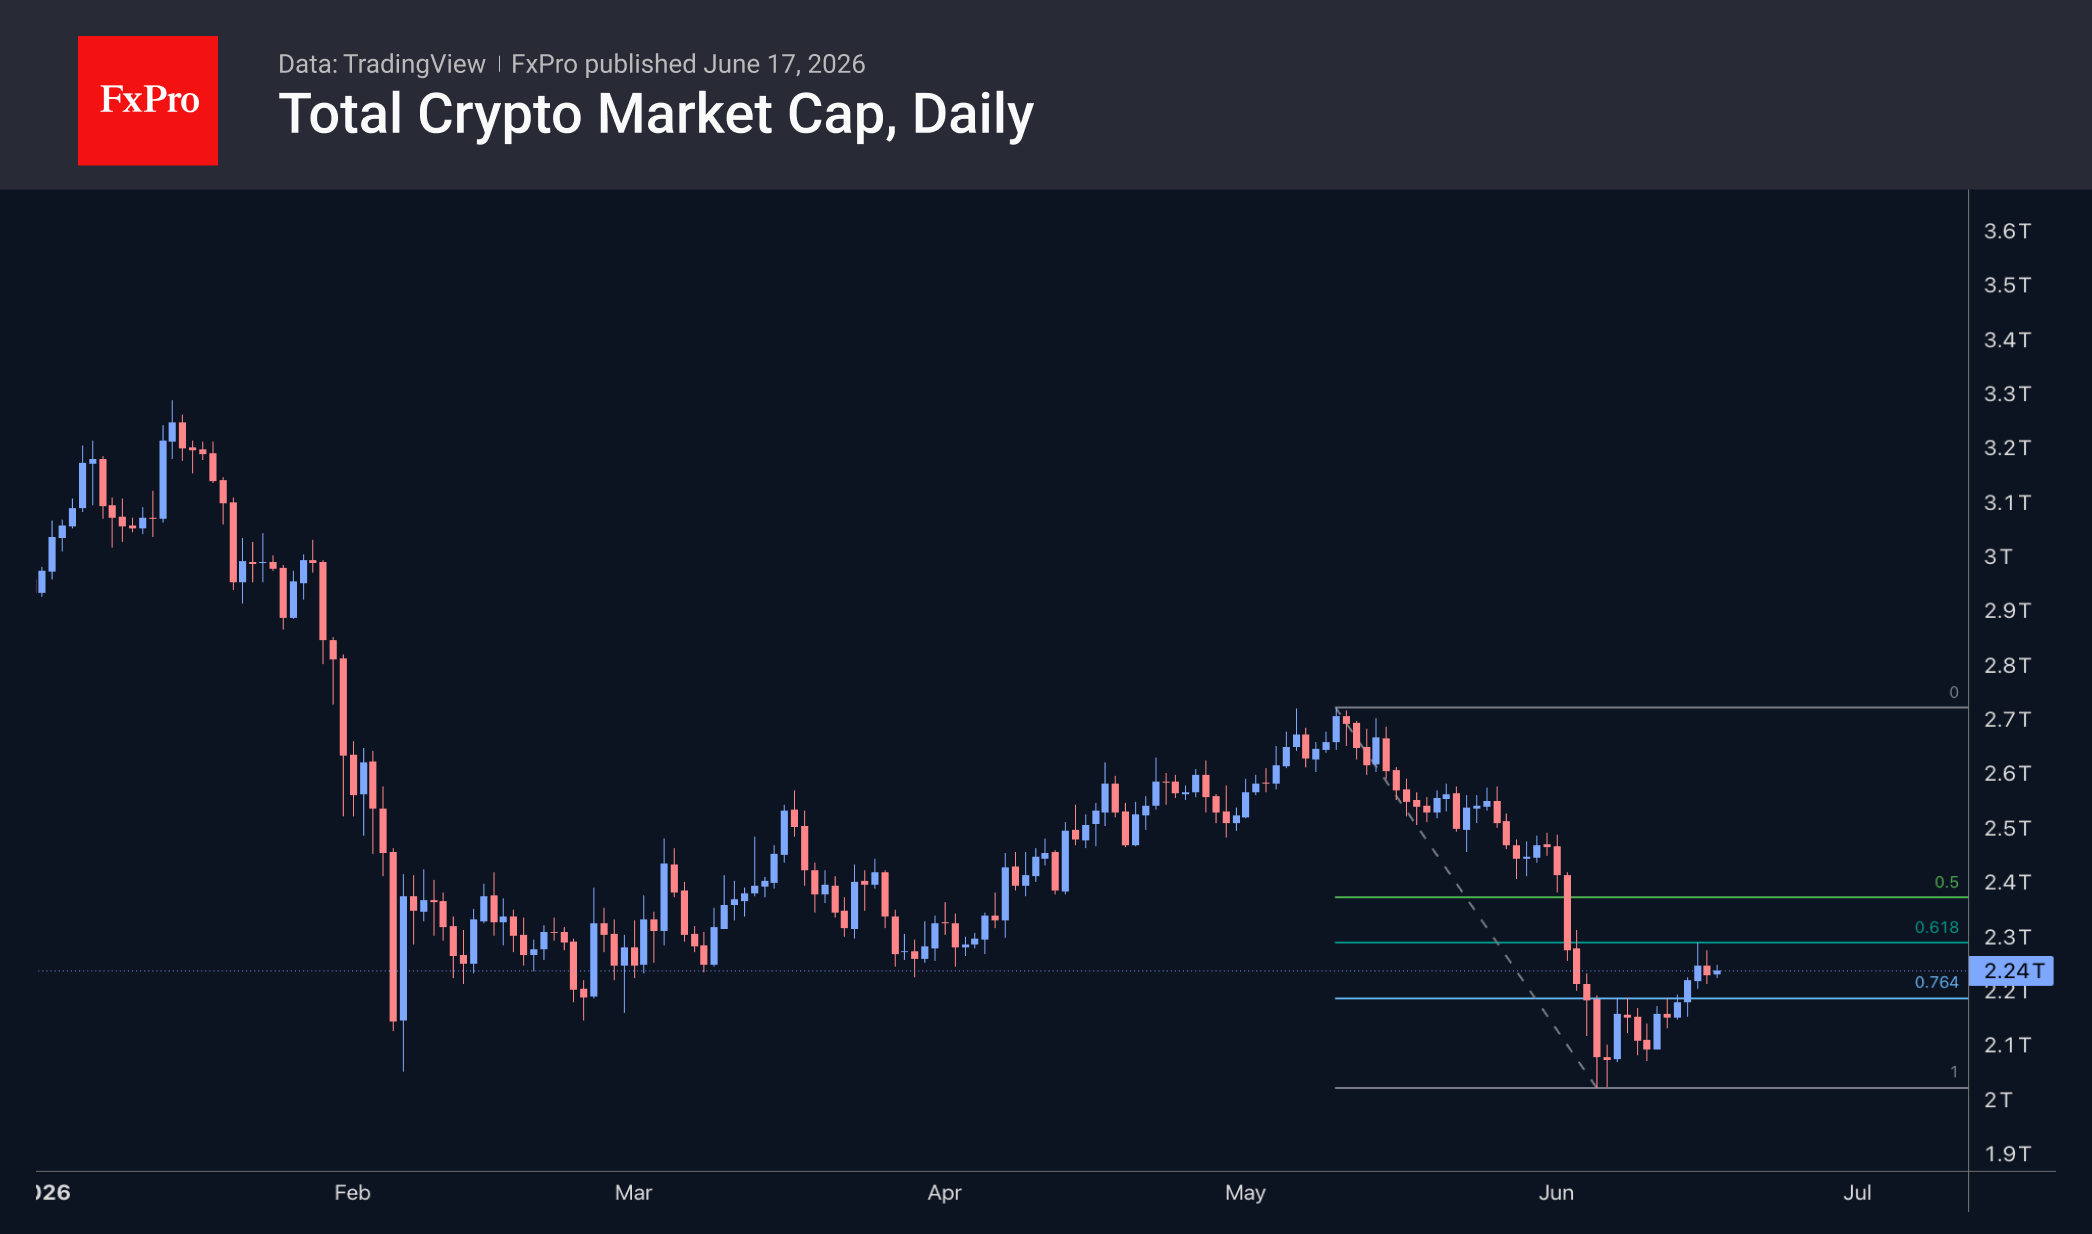
Bitcoin has pulled back to $65.5K and is at the centre of the upward trading range within which the rally has been unfolding over the last 11 days. For now, price action fits a relatively positive scenario, although the rapid loss of recovery momentum is noteworthy.
News Background
Experts are divided on whether Bitcoin has bottomed out. However, for long-term investors, the exact entry point is not decisive if the asset is expected to rise to $100K or higher, according to Bitwise.
Bitcoin’s recurring cycles of boom and bust are a perfectly normal phenomenon that should not undermine investors’ confidence in the long-term growth potential of the first cryptocurrency, said Brian Armstrong, CEO of the cryptocurrency exchange Coinbase.
According to Arkham, the US’s largest miner, MARA Holdings, acquired 1,000 BTC at an average price of $66.7K per coin. The US mining company’s Bitcoin holdings have reached 36,303 BTC. In the first quarter, MARA sold 20,880 BTC for $1.5 billion at an average price of $70.1K.
Publicly listed Bitcoin miners are increasingly transforming their data centres into infrastructure for artificial intelligence (AI). This trend is gaining momentum amid rising capital expenditure in the AI sector and demand for sites with access to electricity.
Strategy founder Michael Saylor has presented a five-tier model of the Bitcoin economy. In his view, Bitcoin will evolve from a simple asset into the foundation of the global financial architecture.
BlackRock has launched a Bitcoin ETF with an options strategy and “potentially lower volatility”. If BTC falls, options income may partially offset losses, while during a sideways trend or moderate growth, it may improve returns. However, a sharp rise in the asset’s price will limit its potential.
The FxPro Analyst Team