Sample Category Title
Pound Under Pressure: Markets Await Bank of England and SNB Decisions
The British pound remains under pressure following weaker-than-expected inflation data, which has reinforced expectations of further monetary easing by the Bank of England. Investors are staying cautious ahead of today’s policy meetings of both the UK central bank and the Swiss National Bank, which is affecting both GBP/USD and GBP/CHF.
The latest data published yesterday showed a slowdown in inflationary pressures in the UK. The annual consumer price index remained at 2.8%, while monthly price growth came in at just 0.2% compared with expectations of 0.4%. Core inflation also came in below forecasts, easing to 2.6% versus expectations of 2.7%. Additional signs of cooling price pressures came from a slowdown in the retail price index and weaker dynamics across several producer price indicators.
The easing of inflation pressures has increased expectations that the Bank of England could continue its gradual policy easing in the coming months. Although no change in interest rates is widely expected today, markets will focus on the accompanying statement, the voting split within the Monetary Policy Committee, and guidance on future policy steps.
GBP/USD
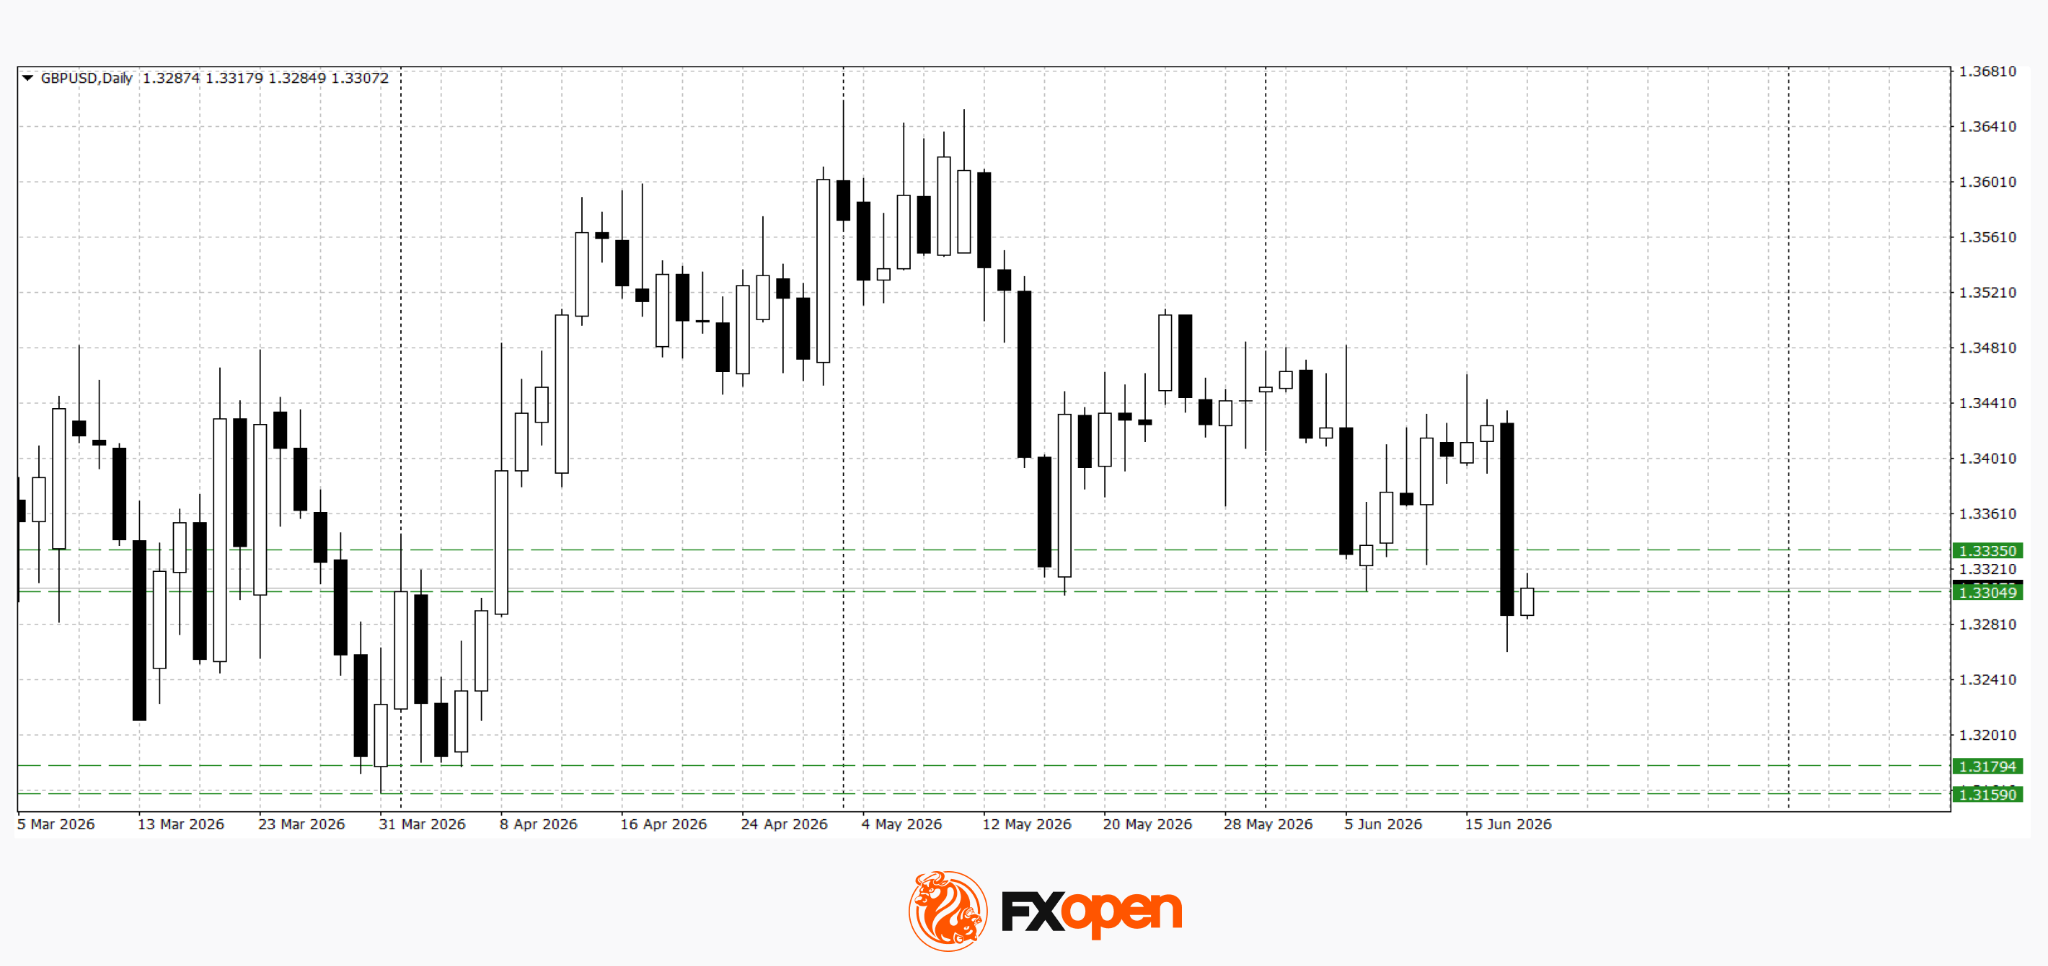
Yesterday, following Jerome Powell’s press conference, the pair fell sharply, renewing its recent low at 1.3300. If the 1.3300–1.3330 range, which has contained the pair’s decline for more than a month, turns into resistance, further downside towards 1.3180–1.3200 may follow. A break of the bearish scenario would require a sustained move above 1.3330.
Key events for GBP/USD:
- today at 09:00 (GMT+3): UK unemployment rate;
- today at 09:00 (GMT+3): UK average earnings (including bonuses);
- today at 15:30 (GMT+3): US Philadelphia Fed manufacturing index.
GBP/CHF
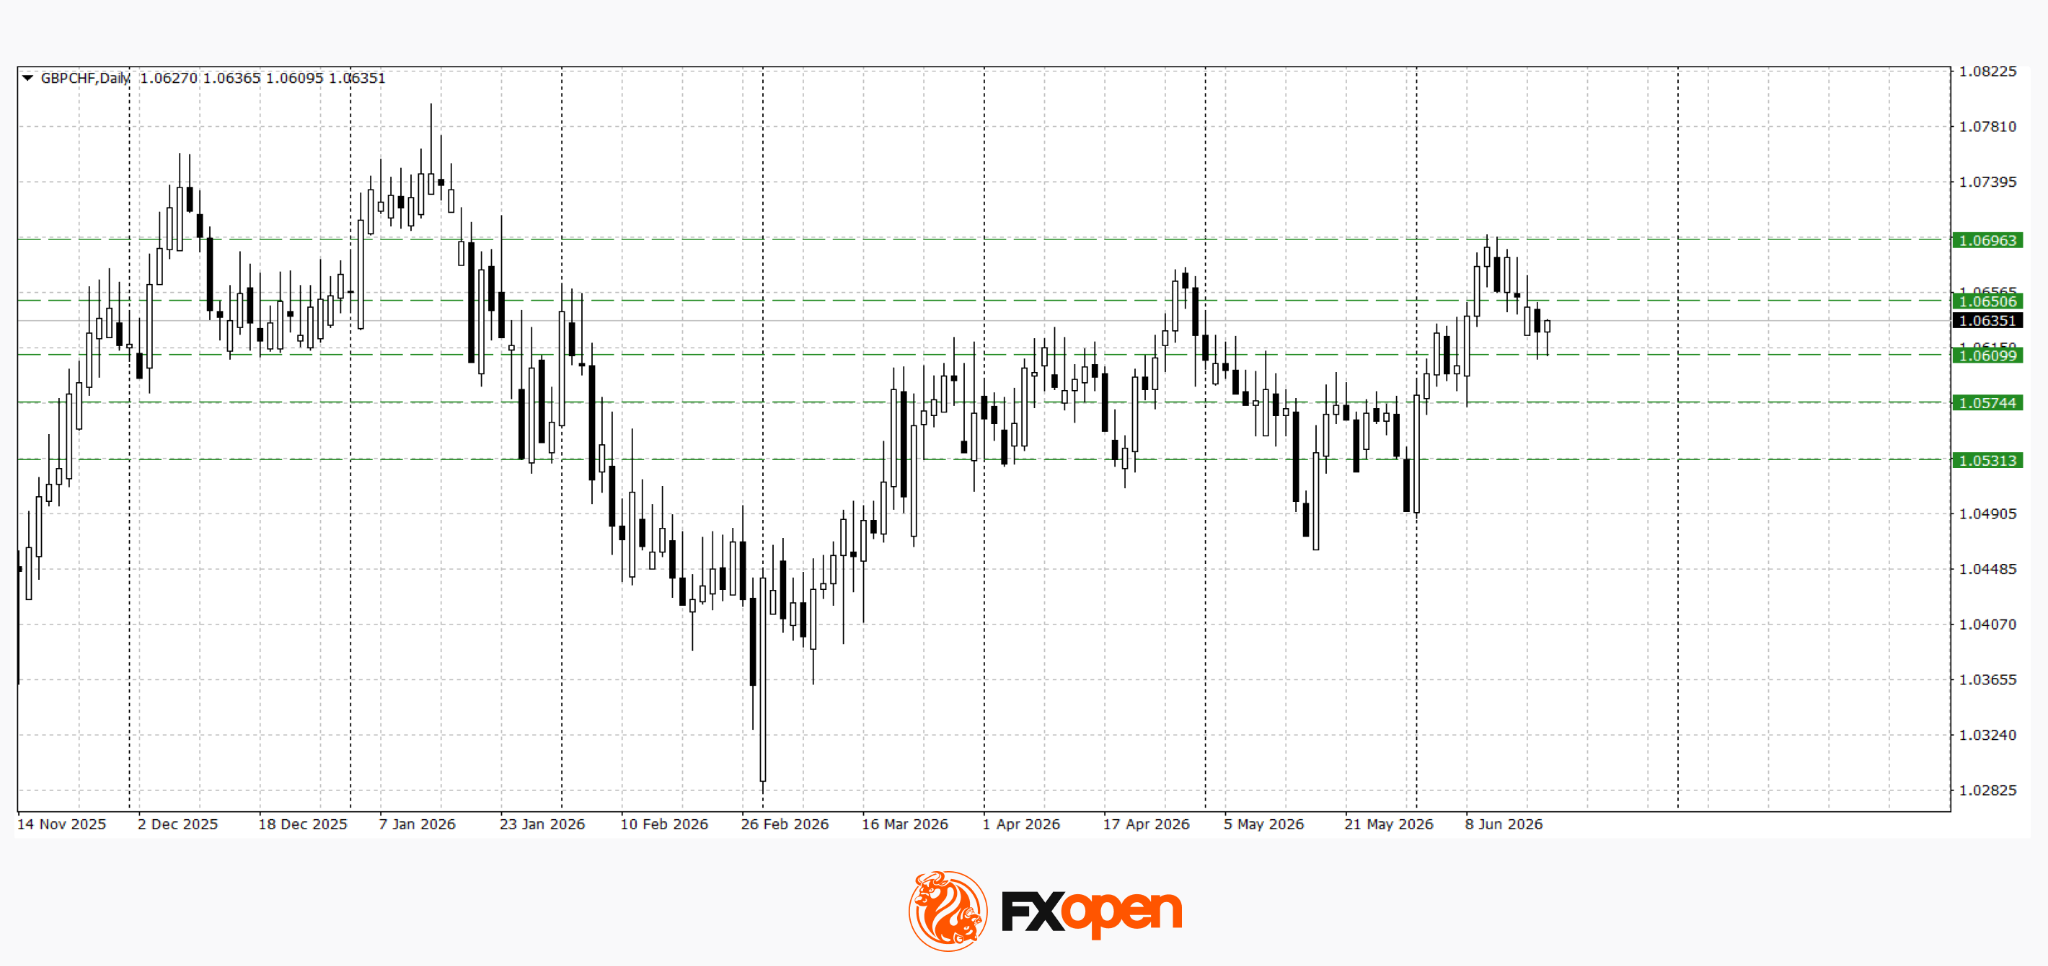
The GBP/CHF pair is showing a relatively modest decline. Price has found support at 1.0600 and is consolidating within the 1.0600–1.0650 range. A breakout from this range would provide clearer direction for the next move. A sustained move above 1.0650 could trigger a retest of the recent high at 1.0700, while a break below the lower boundary could lead to a deeper corrective decline.
Key events for GBP/CHF:
- today at 10:30 (GMT+3): Swiss National Bank interest rate decision;
- today at 11:30 (GMT+3): Swiss National Bank press conference;
- today at 14:00 (GMT+3): Bank of England interest rate decision.
Thus, the key drivers for GBP/USD and GBP/CHF today will be the Bank of England and Swiss National Bank decisions. Following weaker-than-expected inflation data, the market will be looking for confirmation of the UK central bank’s policy stance, while any shifts in expectations for future monetary policy could significantly influence GBP price action in the coming days.
Trade over 50 forex markets 24 hours a day with FXOpen. Take advantage of low commissions, deep liquidity, and spreads from 0.0 pips (additional fees may apply). Open your FXOpen account now or learn more about trading forex with FXOpen.
This article represents the opinion of the Companies operating under the FXOpen brand only. It is not to be construed as an offer, solicitation, or recommendation with respect to products and services provided by the Companies operating under the FXOpen brand, nor is it to be considered financial advice.
SNB Holds at 0%, Sees Energy-Driven Inflation as Temporary
The Swiss National Bank delivered one of the least surprising decisions of the week, leaving its policy rate unchanged at 0% and signaling little urgency to alter its policy stance anytime soon. Despite inflation rising to 0.6% in May from 0.1% in February, the SNB made clear that it views the increase as largely an energy story rather than the start of a broader inflation problem. Policymakers emphasized that "medium-term inflationary pressure... is virtually unchanged" and described current policy settings as appropriate for maintaining price stability.
A key focus of the statement was the Swiss franc. The SNB reiterated that it has an "increased willingness to intervene in the foreign exchange market" and explicitly stated that it would act against a "rapid and excessive appreciation of the Swiss franc." That language underscores the bank's long-standing concern that an overly strong currency could push inflation too low and weigh on economic activity. In effect, the SNB continues to view franc strength as a greater policy challenge than inflation itself.
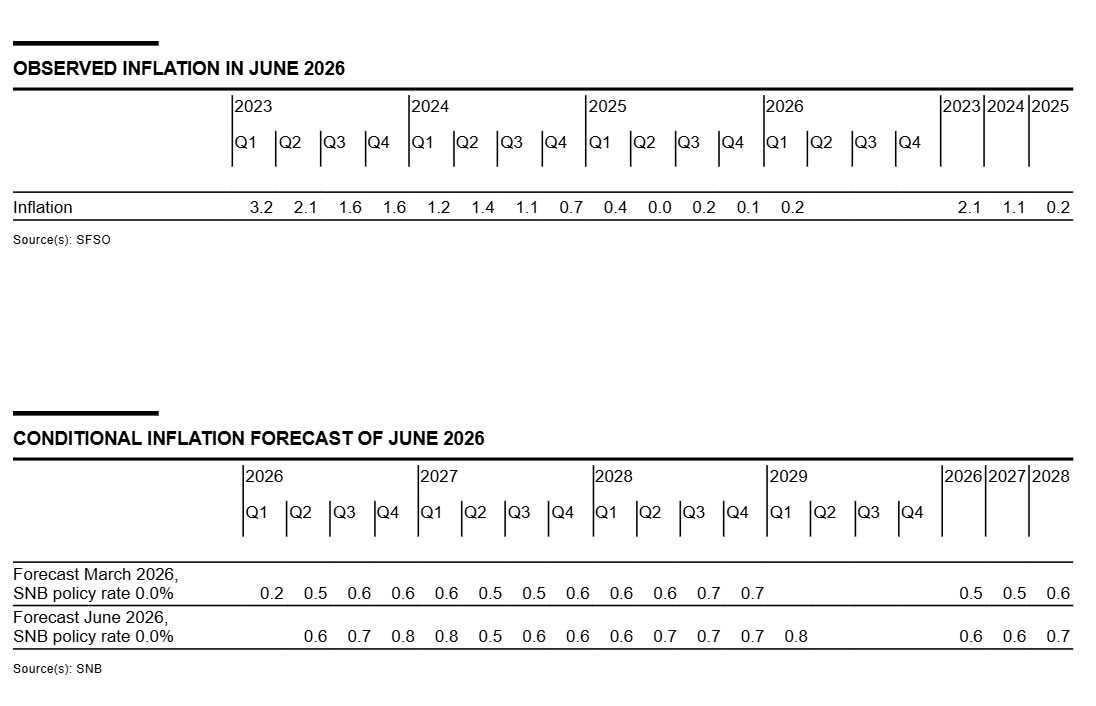
The central bank expects inflation to rise slightly in the near term before easing again as the effects of higher energy prices gradually fade. According to its latest projections, inflation will average 0.6% in both 2026 and 2027 before edging up to 0.7% in 2028. Importantly, the bank stressed that inflation remains within its definition of price stability across the entire forecast horizon, reinforcing expectations that rates can stay at 0% for an extended period.
The statement also highlighted significant uncertainty surrounding the global outlook, particularly developments in the Middle East and commodity markets. Nevertheless, the SNB described the Swiss economy as resilient, even though unemployment has risen somewhat in recent months. For markets, the takeaway is straightforward: unlike some major central banks that are increasingly worried about inflation becoming entrenched, the SNB still sees the current inflation pickup as temporary and remains prepared to use foreign exchange intervention if franc appreciation becomes excessive.
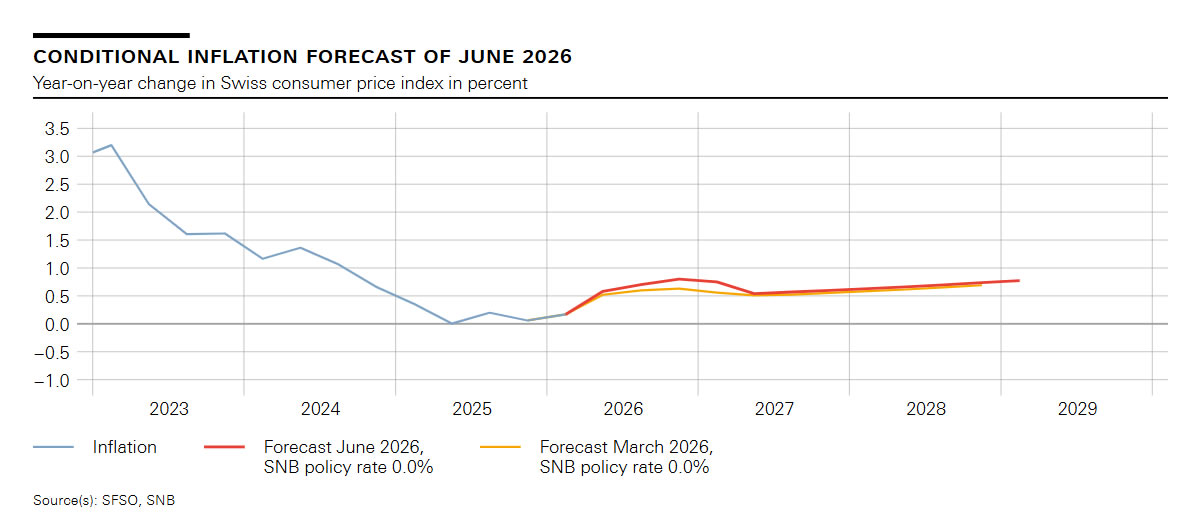
(SNB) Swiss National Bank leaves SNB policy rate unchanged at 0%
The Swiss National Bank is leaving the SNB policy rate unchanged at 0%. Banks' sight deposits held at the SNB will be remunerated at the SNB policy rate up to a certain threshold. The discount for sight deposits above this threshold is unchanged at 0.25 percentage points. If necessary, the SNB has an increased willingness to intervene in the foreign exchange market. The SNB thereby counters a rapid and excessive appreciation of the Swiss franc, which would jeopardise price stability in Switzerland.
Inflation has risen in recent months as a result of higher energy prices. Medium-term inflationary pressure, however, is virtually unchanged compared with the last monetary policy assessment. The SNB's monetary policy is appropriate to keep inflation within the range consistent with price stability and it supports economic development. The SNB will continue to monitor the situation and adjust its monetary policy if necessary, in order to ensure price stability.
As expected, inflation has risen since the last monetary policy assessment, from 0.1% in February to 0.6% in May. This increase was mainly attributable to higher prices for oil products. The other goods and services made little contribution to the rise in inflation.
According to the conditional inflation forecast, inflation will initially continue to increase slightly in the coming quarters, before declining again somewhat in the first half of 2027. This decrease is due to the impact of higher energy prices being likely to ease over time. Energy prices will be largely influenced by the further development of the situation in the Middle East.
The forecast in the shorter term is slightly higher compared with the last monetary policy assessment. This is due to the rise in raw material prices and higher inflation abroad. In the medium term, the inflation forecast is practically unchanged. The forecast is within the range of price stability over the entire forecast horizon (cf. chart). It puts average annual inflation at 0.6% for 2026, 0.6% for 2027 and 0.7% for 2028 (cf. table). The forecast is based on the assumption that the SNB policy rate is 0% over the entire forecast horizon.
Global economic growth was solid overall in the first quarter. However, due to the escalation in the Middle East and the increase in energy prices, economic momentum slowed somewhat. Inflation has risen significantly in many countries as a result of higher energy prices. Key interest rates have been raised in the euro area, while they have remained unchanged in the US.
In its baseline scenario, the SNB anticipates that inflation worldwide will remain elevated over the coming quarters due to the higher raw material prices. In addition, global economic growth is likely to be more moderate in the short term than in the previous quarters. However, growth is likely to pick up again in the medium term.
The baseline scenario remains subject to high uncertainty, above all because the situation in the Middle East is still fragile. For example, raw material prices could turn out to be significantly higher than expected. This would increase inflation further and significantly curb economic growth. In addition to the situation in the Middle East, the trade policy environment also remains uncertain.
Economic activity in Switzerland has proved to be resilient given the conflict in the Middle East. GDP growth was solid in the first quarter. Unemployment has risen somewhat since the last monetary policy assessment.
In the coming quarters, the more moderate development of the global economy is likely to dampen growth in Switzerland, while the SNB's monetary policy will have a supportive effect. In the medium term, the expected improvement in the global economy will provide growth impetus. For 2026 as a whole, the SNB currently expects growth of around 1%. For 2027, the SNB anticipates around 1.5%.
The main risk to the economic outlook for Switzerland is developments in the global economy. In particular, the situation in the Middle East could worsen again and curb global economic activity more strongly. The upward pressure on the Swiss franc could also increase again. Furthermore, US trade policy continues to be a source of uncertainty.
More detailed information on the monetary policy decision can be found in the introductory remarks by the Governing Board (available on the SNB website from 10 am on 18 June 2026).
Sunrise Market comentary
Markets
Fed Chair Warsh made it clear that he is here to make changes. At his first meeting as Chair, the Fed left the federal funds target range unchanged at 3.50%-3.75% in the first unanimous decision since July last year. Anything resembling forward guidance was stripped from the notably brief statement, including the easing bias that remained in April.
The statement consisted of just two short paragraphs: one addressing economic activity and employment, and another focused on inflation. The Fed noted that economic activity is expanding at a solid pace despite elevated uncertainty, while job gains have kept pace with workforce growth. Inflation remains elevated relative to the 2% target, partly reflecting supply shocks. To underline its current priority, the statement concluded with a clear message: "The Committee will deliver price stability."
The updated Summary of Economic Projections reinforced the hawkish shift. Median PCE inflation projections for 2026-2028 were revised higher to 3.6%, 2.3% and 2.0%, from 2.7%, 2.2% and 2.0% previously. Core PCE forecasts were also raised to 3.3%, 2.5% and 2.1%, from 2.7%, 2.2% and 2.0%. All but one Fed official judged inflation risks to be skewed to the upside and uncertainty to be greater than in March.
At the same time, GDP growth is expected to remain slightly above trend, while unemployment is projected to stay close to its estimated long-run equilibrium rate of around 4.2%. The updated dot plot showed that nine of eighteen policymakers now favor at least one rate hike before year-end, while only one still projects a rate cut. Looking further ahead, eight officials expect policy rates to remain above current levels by the end of 2027.
Warsh declined to submit his own dot-plot projections, reiterating his opposition to this form of forward guidance. During the press conference, he outlined what may become a defining theme of his tenure:
"I think financial markets perform best when they react to incoming data. I think financial markets work less efficiently when they ask the question, 'How will the Federal Reserve react to that incoming information?'"
The message was clear: trade the data, not the Fed. Warsh revealed that "Fed communications" is one of five task forces he has established to review central bank practices. Areas under consideration include reducing public appearances, revising the SEP framework and reassessing the role of forward guidance. Additional task forces will examine balance-sheet policy, the inflation framework, productivity and employment dynamics, and the use of real-time data. Warsh argued that real-time information often provides more value than traditional survey-based indicators, which suffer from long lags and declining response rates.
Markets took note of the changing tone at the Fed. The US yield curve bear steepened, with front-end yields rising as much as 13.2 bps. The 2-year Treasury yield climbed to 4.20% for the first time since February 2025, while money markets now fully price a Fed rate hike by October.
Inflation releases will be scrutinized closely over coming months. Risks remain skewed to the upside, raising the possibility of further hawkish repricing toward September or even July tightening expectations.
The dollar benefited from renewed rate support, with EUR/USD falling from above 1.1600 to briefly below 1.1500. The US economic outperformance narrative relative to Europe is now reinforced by the prospect of Fed tightening from a position of strength, potentially opening the way for a retest of the August 2025 low at 1.1392.
The combination of higher US real yields and a more hawkish Fed also poses a challenge for risk assets. Major US equity indices fell between 1.0% and 1.35% during the session as investors adjusted to the prospect of tighter financial conditions.
News & Views
The Brazilian central bank (BCB) cut its policy rate by 25 bps to 14.25% despite rising inflation expectations, which currently stand at 5.3% for this year and 4.1% for next year.
The BCB simultaneously revised higher its inflation forecasts. Headline inflation is now projected at 5.2% this year, up from 4.6%, and 3.7% at end-2027, compared with 3.5% previously. The central bank's inflation target remains 3.0%, with a tolerance band of ±1.5 percentage points.
Policymakers acknowledged that risks to inflation remain elevated on both sides. Nevertheless, the central bank justified the rate cut by arguing that monetary policy must also support economic stability and employment conditions.
In its statement, the BCB said:
"Without compromising its fundamental objective of ensuring price stability, this decision also implies smoothing economic fluctuations and fostering full employment."
The central bank further indicated that projected inflation at the next relevant policy horizon, which will be formally published at the next meeting, is expected to fall below target, providing room for a gradual easing cycle despite the current inflation backdrop.
UK Jobs Growth Stalls as Claimant Count Jumps, Wage Pressures Ease Slightly
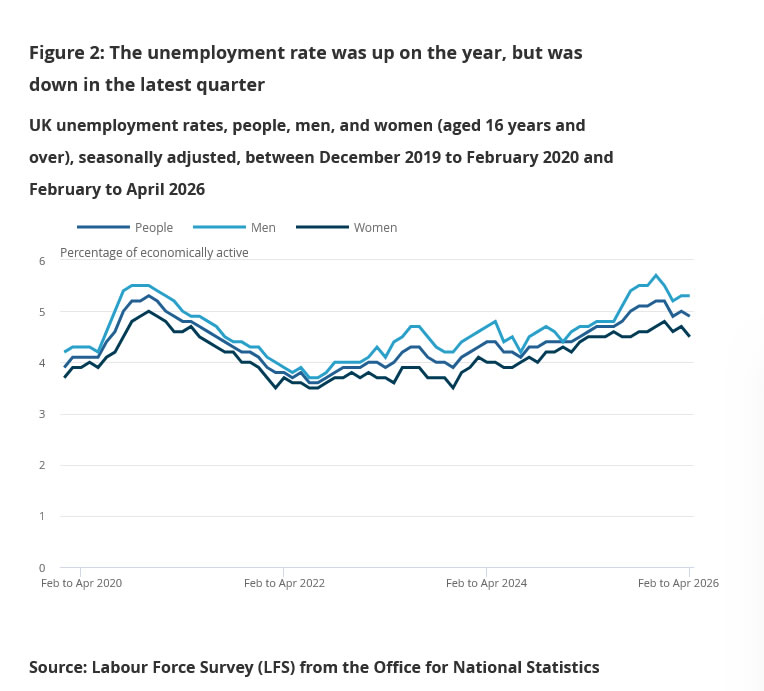
The UK's labor market sent mixed signals in May, with employment growth stalling and unemployment edging lower even as the number of people claiming unemployment-related benefits rose sharply. Payrolled employment increased by just 2k during the month, while the annual number of payrolled employees fell by -119k, or -0.4% yoy, leaving total payroll employment at 30.3m. Meanwhile, the claimant count rose by 31.2k, accelerating from April's 8.3k increase and pointing to some deterioration in labor market conditions.
Despite those signs of softening, broader labor market measures remained relatively resilient. The unemployment rate dipped from 5.0% to 4.9% in the three months to April, while wage growth remained elevated. Average earnings excluding bonuses rose 4.4% yoy, unchanged from the previous three-month period. Total earnings growth including bonuses held steady at 3.4% yoy. Median monthly pay growth slowed modestly from 4.8% yoy to 4.6% yoy in May but remained well above inflation.
For the Bank of England, the report is unlikely to materially alter the policy outlook. The rise in claimant count and weak payroll growth suggest that higher interest rates are continuing to weigh on labor demand. However, wage growth remains strong enough to keep concerns about domestic inflation pressures alive, particularly alongside elevated services inflation. The data reinforce the view that the labor market is gradually cooling rather than weakening abruptly, supporting expectations that the BoE will keep rates unchanged while retaining a tightening bias for later in the year.
UK Labor Market (May 2026)
| Indicator | Latest |
|---|---|
| Payrolled Employment M/M | +2,000 |
| Payrolled Employment Y/Y | -119,000 (-0.4%) |
| Total Payrolled Employees | 30.3 million |
| Claimant Count Change | +31.2k |
| Median Monthly Pay Growth Y/Y | 4.6% |
Three Months to April 2026
| Indicator | Prior | Latest |
|---|---|---|
| Unemployment Rate | 5.0% | 4.9% |
| Average Earnings Ex Bonus Y/Y | 4.4% | 4.4% |
| Average Earnings Inc Bonus Y/Y | 3.4% | 3.4% |
Norges Bank, BoE and SNB Expected to Keep Rates Unchanged
In Focus Today
- In Norway, we expect Norges Bank to keep the policy rate unchanged at 4.25% but signal around a 50% probability of another rate hike in Q3, maintaining a near-term tightening bias. Further ahead, we expect the rate path to point to a first full rate cut late next summer. Today's decision will be accompanied by a full Monetary Policy Report, updated projections, a revised rate path and meeting minutes at 10:00 CET.
- In the UK, we expect the Bank of England to keep Bank Rate unchanged at 3.75%. Recent data have generally been dovish, with weak PMIs, limited energy spillovers into core inflation, rising unemployment and accelerating job losses. There are also no clear signs of renewed wage pressure. The latest labour market report reinforces the case for patience rather than further tightening.
- In Switzerland, we expect the Swiss National Bank to leave its policy rate unchanged at 0.00%, in line with consensus and market pricing. Although inflation has surprised slightly to the upside, domestic price pressures remain subdued and the strong Swiss franc continues to exert disinflationary pressure. We therefore do not expect a rate hike and look for the SNB to reiterate its willingness to intervene in FX markets if necessary.
Economic and Market News
What Happened Overnight
US-Iran Deal: President Donald Trump and Iranian President Masoud Pezeshkian digitally signed a memorandum of understanding aimed at working toward a permanent peace agreement between the two countries. Following the announcement, Brent crude fell below USD 78/bbl, while prediction markets became somewhat more cautious regarding the speed of normalization in Strait of Hormuz shipping traffic.
Earlier drafts of the agreement suggested an interim framework allowing the immediate resumption of Iranian oil exports and potential access to a USD 300 billion development program, supported by sanctions waivers and the release of frozen overseas assets. Iran would commit to never producing nuclear weapons, while broader nuclear negotiations would continue during a 60-day period. G7 leaders welcomed the development, which followed Trump's remarks that military action could have continued for years and his warning that strikes could resume if negotiations fail.
What Happened Yesterday
The Fed left rates unchanged at 3.50%-3.75%, as expected. Warsh's first meeting as Chair delivered no surprises regarding balance-sheet policy and featured a significantly shorter statement with no forward guidance. Although Warsh did not submit his own projections, the Summary of Economic Projections revealed a distinctly hawkish bias, with nine members expecting rate hikes this year and six of those anticipating more than one increase, alongside higher inflation forecasts.
Markets responded with higher Treasury yields and a weaker EUR/USD, reflecting increased pricing of a more front-loaded hiking path.
In Sweden, the Riksbank left its policy rate unchanged at 1.75%, in line with expectations. The rate path was revised higher, though less than anticipated, reflecting softer inflation and growth projections. Core inflation is expected to remain only slightly above 2% next year. Despite language indicating that the probability of a rate hike has increased, the modest adjustment was interpreted as slightly dovish for the krona and suggests some upside potential in EUR/SEK.
In the Eurozone, final May inflation data confirmed a surprisingly strong services inflation reading of 3.6% y/y. The increase appears only partly attributable to temporary or seasonal factors. While summer-holiday housing costs are expected to reverse in June, other contributors such as airfares and package holidays largely reflect base effects and have returned to more normal levels. Overall, the composition of services inflation remains mildly hawkish from the ECB's perspective.
In the US, retail sales rose by 0.9% m/m in May, exceeding expectations and marking a fourth consecutive strong monthly reading. Households increased vehicle purchases despite higher fuel prices. Combined with stronger employment growth and rising inflation, the data underline the resilience of the US economy following the energy shock.
In the UK, May CPI surprised slightly on the downside. Headline inflation remained at 2.8% y/y while core inflation stood at 2.6%. Services inflation increased to 3.7%, broadly matching expectations. The broader disinflation trend remains intact despite survey evidence of higher price pressures, while food inflation continued to moderate to 2.1%. The data nudged EUR/GBP slightly higher and keep attention focused on upcoming labour market releases and the Bank of England meeting.
Equities: Equity markets moved lower on Wednesday, leaving major indices modestly negative for the week despite the sharp decline in energy prices. The hawkish tone of the FOMC meeting and the implied tightening outlook were the primary drivers, with the S&P 500 falling 1.2% on the day. Rate-sensitive sectors such as communication services and real estate underperformed sharply, declining around 2.5%, while value-oriented cyclical sectors continued to hold up relatively well.
The market appears to be interpreting the Fed's hawkishness as a response to stronger growth and higher inflation rather than as a threat to economic expansion. Technology stocks also handled higher yields relatively well, contrasting with the sharp reaction following the stronger-than-expected employment report several weeks ago. Asian markets were largely unaffected by the Fed's stance, with both the Kospi and Nikkei advancing 1-2% overnight.
FI and FX: The hawkish Fed meeting provided the main catalyst in an otherwise quiet session. Despite not publishing his own dot-plot projections, Kevin Warsh emphasized the Fed's commitment to restoring price stability, helping to dispel concerns that his appointment by President Trump would lead to a softer policy stance.
US rates sold off sharply, with the 2-year Treasury yield rising as much as 17 bps intraday, while the US dollar strengthened significantly. EUR/USD briefly broke below 1.1500 before recovering part of the move. Scandinavian currencies also weakened following the Fed decision, with USD/SEK posting its largest one-day gain since the tariff-related volatility seen more than a year ago.
The Riksbank maintained rates unchanged yesterday while acknowledging a somewhat greater probability of a hike later this year. Attention now shifts to Norges Bank, the SNB and the Bank of England, all of which are expected to leave policy settings unchanged. Markets are starting the day with a constructive risk tone following confirmation that Donald Trump signed an interim agreement aimed at ending the conflict with Iran and reopening the Strait of Hormuz.
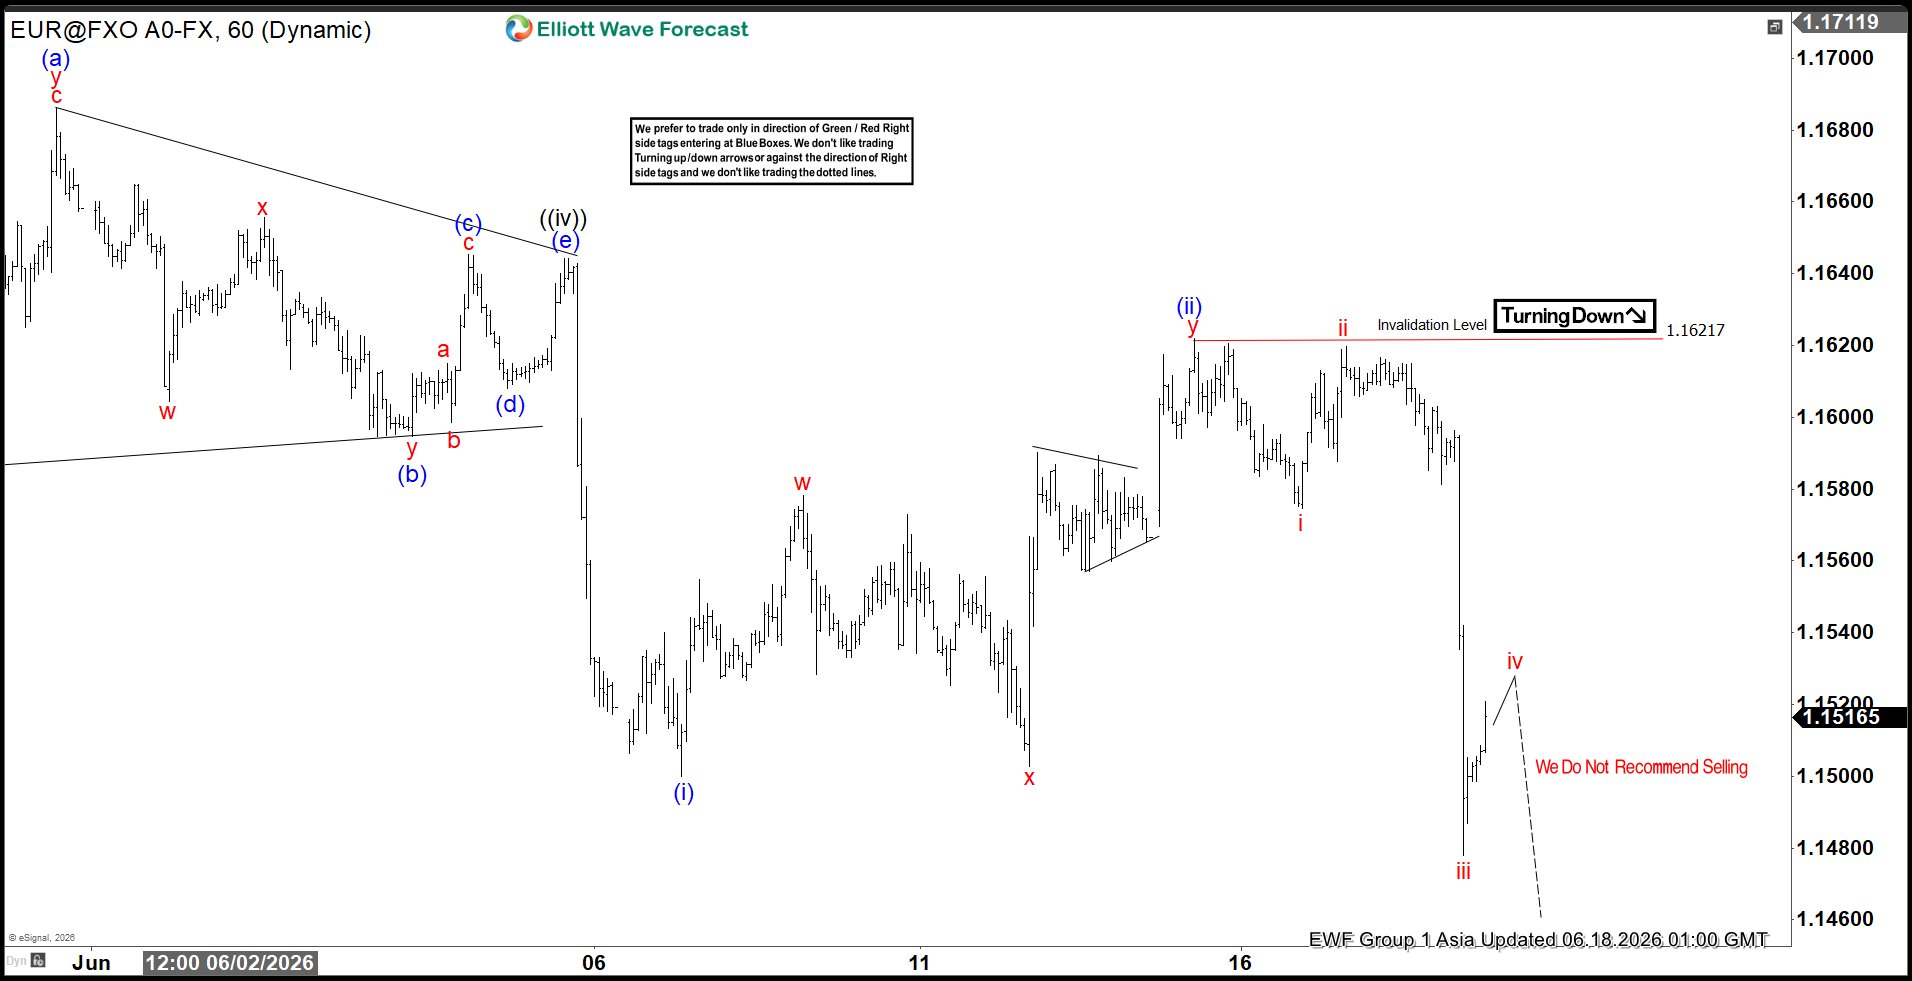
Elliott Wave View: EURUSD Looking for Larger Degree Zigzag Correction
The short-term Elliott Wave analysis of EURUSD shows that the decline from the April 17, 2026 peak is unfolding as a five-wave impulse. From the April 17 high, wave ((i)) ended at 1.1655. A corrective rally in wave ((ii)) then followed which terminated at 1.1796. The pair then moved lower in wave ((iii)), reaching 1.1576. Afterward, wave ((iv)) completed at 1.164 in the form of a triangle, confirming the continuation of bearish momentum.
The market has since resumed lower in wave ((v)), which subdivides into a smaller degree impulse. From wave ((iv)), wave (i) concluded at 1.15, while wave (ii) retraced to 1.1622. The expectation is that EURUSD will continue declining through further subdivisions before completing wave (v) of ((v)). This completion would mark the end of wave 1 in the larger degree, thereby concluding the cycle that began from the April 17 high. Once wave 1 is finalized, the pair should enter a corrective rally of larger degree before resuming its downward path. Pair can potentially extend lower to the extreme area from January 27 peak towards 1.075 – 1.117. In the near term, as long as the pivot at 1.1845 remains intact, rallies are expected to fail within corrective structures of three or seven swings.
EURUSD 60-Minute Elliott Wave Chart
 EURUSD Elliott Wave Video:
https://www.youtube.com/watch?v=LSrYqg9oRiE
Wall Street Slumps as Kevin Warsh Delivers Hawkish Hold, GBP/USD’s Plunge Hits Support Ahead of BoE
Key takeaways
- The Federal Reserve delivered a hawkish hold and signalled a major policy regime shift. While rates remained unchanged at 3.50%-3.75%, Chair Kevin Warsh abolished traditional forward guidance, reinforcing a data-dependent approach and increasing the likelihood of higher market volatility.
- Higher-for-longer interest rate expectations pressured risk assets. The S&P 500 fell 1.2%, the Nasdaq 100 dropped 1%, Treasury yields rose, and the US dollar strengthened as investors repriced the probability of another Fed rate hike before the end of 2026.
- Markets remain caught between easing geopolitical risks and restrictive monetary policy. While the official US-Iran interim peace agreement supported equity futures and pushed oil prices lower, the Fed’s hawkish stance continues to weigh on equity valuations, gold, and other rate-sensitive assets.
- Chart of the day: GBP/USD’s intraday plunge overextended, watch 1.3280/3262 key short-term pivotal support for a potential relief corrective rebound.
Chart of the day - Relief bounce for GBP/USD as BoE looms
Fig. 1: GBP/USD minor trend as of 18 Jun 2026 (Source: TradingView). The information presented is historical information, and past performance is not indicative of future performance.
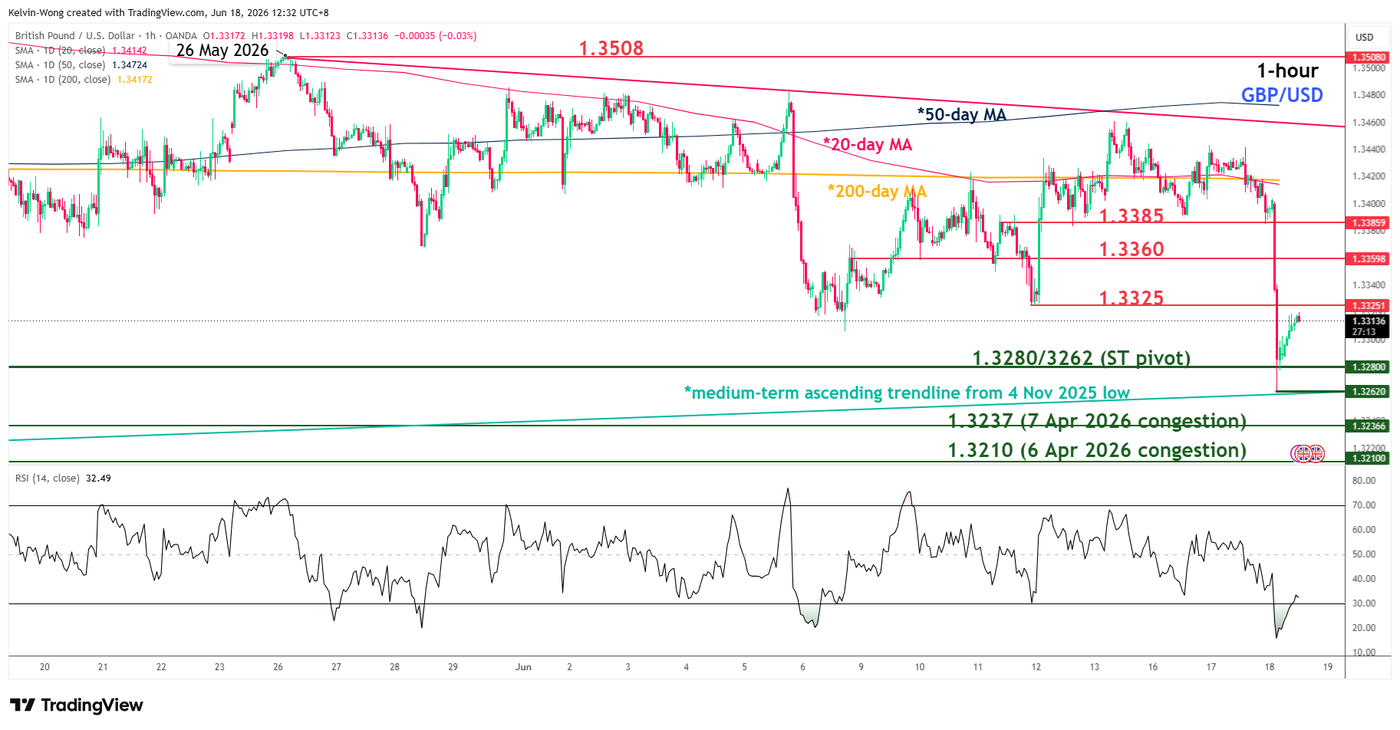
Wednesday’s 1% plunge in GBP/USD was the worst single-day performance in nine months, reinforced by the Fed’s hawkish hold on monetary policy.
Interestingly, yesterday’s drop has now stalled right after a retest of the medium-term ascending trendline for GBP/USD, in place since the 4 November 2025 low, ahead of the BoE’s monetary policy decision out later today at 7.00 p.m SGT (see Fig. 1).
The hourly RSI momentum indicator has just exited its oversold region after hitting an extreme level of 15.8 ex-post the FOMC, suggesting a potential minor relief-bounce for GBP/USD at this juncture.
Watch the 1.3280/3262 key short-term pivotal support, and a clearance above the 1.3325 near-term resistance reinforces the minor corrective rebound scenario towards the next intermediate resistances at 1.3360 and 1.3385.
However, a break with an hourly close below 1.3262 invalidates the relief bounce to continue the bearish impulsive down move sequence to expose the next intermediate supports at 1.3237 and 1.3210 on an intraday basis.
Top macro headlines
- Fed holds rates steady, but policy shocks markets with hawkish shift: The Federal Open Market Committee (FOMC) voted unanimously to keep the federal funds rate at its target range of 3.50% to 3.75%. However, the central bank’s updated economic projections delivered a hawkish surprise: 9 out of 19 officials now anticipate at least one interest rate increase before the end of 2026, forcing markets to aggressively price out near-term easing cycles.
- Chair Kevin Warsh triggers Fed "regime change” by killing forward guidance: In his highly anticipated debut press conference, newly appointed Fed Chair Kevin Warsh structurally overhauled the central bank’s communications playbook. Warsh delivered a drastically shortened committee statement and explicitly abolished traditional forward guidance, stating that financial markets operate best when reacting directly to real economic data rather than central bank hints. He also launched five new internal task forces to review the Fed’s balance sheet, communication framework, and inflation models.
- Wall Street slumps 1% as higher-for-longer projections rattle tech: U.S. stock benchmarks plunged in the closing minutes of the regular session as investors digested the shifting interest-rate dot plot. The S&P 500 slid 1.2%, alongside a 1% fall in the Nasdaq 100, completely wiping out early-session cyclical gains as rate-sensitive megacaps faced intense liquidation pressure.
- IEA warns of historic oil inventory depletion despite reopening framework: In its monthly global energy report, the International Energy Agency (IEA) warned that global oil inventories could hit historic lows over the coming months. Although Bloomberg published a 14-point memorandum detailing a U.S.-Iran agreement to restore toll-free commercial shipping through the Strait of Hormuz within 30 days, the IEA emphasised that physical export normalisation will remain highly gradual due to steep operational bottlenecks.
- Trump expresses full confidence in Warsh’s rate stance: President Donald Trump reacted mildly to the Fed’s hawkish hold, telling reporters, "It’s all right, whatever”. When questioned on the growing likelihood of an additional rate hike later this year, Trump acknowledged it “could happen” but reiterated his complete confidence in the new Chair, stating he is guided by what Warsh wants to do.
Key macro themes
- The eradication of forward guidance and return to data dependency: Chair Kevin Warsh has officially initiated a monumental regime change in the Federal Reserve’s relationship with public capital markets. By removing forward-looking linguistic roadmaps from the policy statement, the central bank has effectively blindfolded traders who rely on pre-commitment signals. Warsh’s philosophy shifts the burden of price discovery entirely back to incoming economic data. While this may minimise the Fed’s vulnerability to blind feedback loops, it introduces a structurally higher baseline of volatility across global bond and equity horizons.
- The friction between paper accords and physical energy reality: The crude complex is navigating a stark disconnect between geopolitical diplomatic announcements and structural supply limits. Front-month futures contracts have been aggressively extracting the war premium on the back of the newly published 14-point U.S.-Iran memorandum. However, as the IEA explicitly highlighted, a political agreement cannot instantly clear physical distribution channels. Demining delays, insurance recalibrations, and logistical constraints mean that global structural inventory depletion will worsen before an anticipated supply surplus materialises next year.
- Valuation compression hits richly priced public equities: The upward shift in the Fed’s median dot plot—with half of the committee now signalling that a rate hike may be required before the year concludes, has forced an abrupt recalculation of equity risk premiums. Growth and technology names, which had brushed off sticky inflation metrics under the assumption of an impending autumn easing cycle, are highly vulnerable to this "higher-for-longer" baseline adjustment. With the cost of capital remaining structurally locked at multi-decade highs, equity multiples are under organic pressure.
Global markets impact (last 24 hours)
Equities: The S&P 500 slumped 1.2% to settle at 7,420, while the tech-heavy Nasdaq 100 dropped 1%. The Dow Jones Industrial Average suffered a 507-point drop (1.0%) to finish at 51,498, reversing an intraday gain of 0.5% recorded earlier in the morning session. Small caps shared the pain, with the Russell 2000 closing down 0.7%.
In today’s Asia opening session, the E-mini futures of the S&P 500 and Nasdaq 100 recovered by 0.8% and 1.4% reinforced by the official signing of the US-Iran interim peace deal by US President Trump.
Fixed Income: Sovereign bonds faced steep selling pressure as rate-cut bets were unwound. US Treasury yields climbed across the curve, pushing long-duration yields higher. Driven by the hawkish shifts, the benchmark U.S. 30-year fixed mortgage rate jumped to an estimated 6.62%, up from 6.54% the prior day.
FX: The U.S. Dollar Index caught an aggressive safe-haven bid in late New York trading following Warsh’s remarks. The euro and British pound gave up intraday gains and traded under pressure, dropping by 0.9% and 1% by the close of Wednesday’s session. The Japanese yen edged lower, remaining highly sensitive to widening yield spreads and trading near the recent intervention threshold of 160.65.
Commodities: Front-month international energy contracts inched lower in line with the broader risk-off equity slide, with Brent crude futures sliding 0.9% to near $78.66/bbl despite the IEA’s warning about inventory depletion. Spot gold fell 1.7% to settle near $4,258/oz after a bearish reaction below the 20-day moving average as surging nominal yields diminished the appeal of non-yielding safe havens.
Asia Pacific impact
- Mixed performances: The current bounce seen in the E-mini futures of the S&P 500 and Nasdaq 100 have managed to negate the overnight weakness inflicted on US stock indices. Japan’s Nikkei 225 surged by 2% to another intraday record high of 71, 330. Also, another fresh high was seen on South Korea’s KOSPI (+1.7%). In contrast, Hong Kong’s Hang Seng Index and Australia’s ASX 200 underperformed, posting intraday losses of 1.7% and 0.6%.
- Yen remains locked near key intervention floor: The Japanese yen continues to hug the critical 160.65 level per US dollar. With the Federal Reserve signalling a sustained restrictive policy stance, wide interest-rate differentials continue to favour the greenback, keeping the Bank of Japan on high alert for spot-market smoothing operations.
- Regional importers absorb elevated near-term energy costs: Despite long-term optimism about the upcoming reopening of the Strait of Hormuz, Asian refiners are continuing to draw down costly near-term stockpiles. The IEA’s confirmation of multi-month transit bottlenecks ensures input energy constraints will linger for non-OPEC APAC economies through the summer.
Top 3 events to watch today
- BoE Interest Rate Decision - 7.00 PM SGT (consensus: on hold at 3.75%) Impact: GBP/USD, GBP crosses, FTSE 100, UK Gilts
- US Weekly Initial Jobless Claims - 8.30 PM SGT Impact: USD, US stock indices, short-end US Treasuries
- US Conference Board Leading Index (May) - 10:00 PM SGT (consensus: 0.1% m/m, Apr: 0.1% m/m) Impact: US stock indices, USD
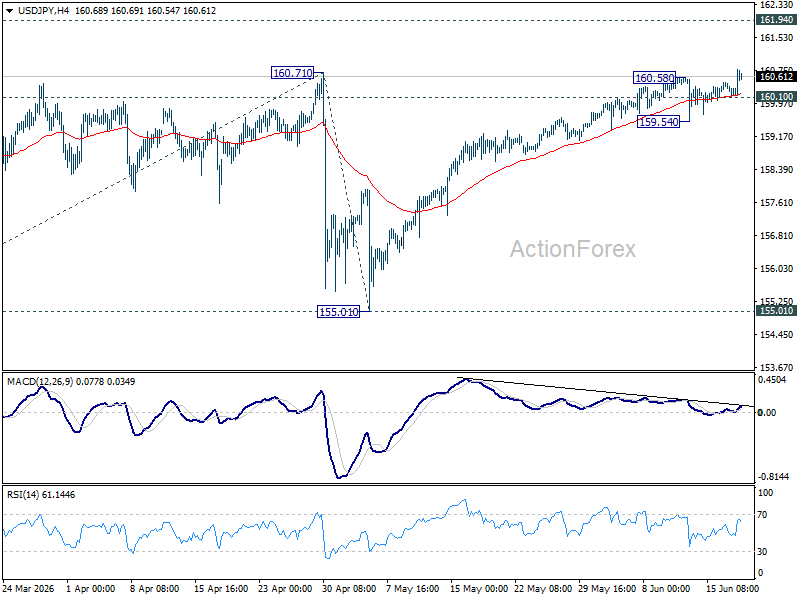
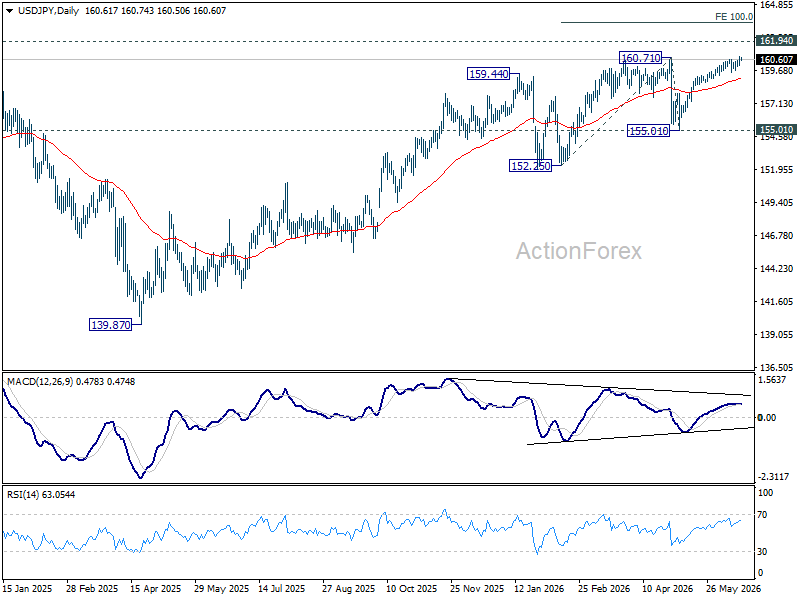
USD/JPY Hits Two-Year High as Hawkish Fed Revives Rate Hike Bets
USD/JPY surged to a fresh two-year high after the Federal Reserve delivered a significantly more hawkish message than markets had anticipated, reviving expectations that US interest rates could rise again before year-end. While the Fed left the federal funds rate unchanged at 3.50%-3.75% as widely expected, the updated projections painted a much more inflation-focused picture. The median federal funds rate projection now stands at 3.8% at the end of 2026, implying one additional rate hike from current levels.
The biggest surprise came from the new dot plot. Nine policymakers now expect at least one rate increase this year, compared with eight who see rates remaining unchanged and only one who anticipates a cut. That distribution marks a notable shift from the market narrative that had largely centered on how long rates would remain elevated rather than whether they might move higher. Supporting the hawkish message, the Fed also raised its inflation forecasts, signaling growing concern that recent price pressures may prove more persistent than previously expected.
Fed Chair Kevin Warsh reinforced that interpretation in his first post-meeting press conference. He adopted an uncompromising tone on inflation, declaring that "persistently high prices are a burden for the American people" and emphasizing that the Committee was "unambiguous and unanimous" in its commitment to restoring price stability. Importantly, Warsh declined to rule out a rate hike as soon as the July meeting. However, he simultaneously announced the end of traditional forward guidance, arguing that the current economic environment makes such signaling less useful. The result was a Fed that sounded hawkish without committing to a specific policy path.
Markets nevertheless interpreted the message as opening the door to further tightening. Fed funds futures now imply around a 30% probability of a July hike, rising to 62% for September, 72% for October and 85% by year-end. In effect, investors are treating September, when policymakers will release a new set of economic projections, as the most likely window for another move should inflation remain elevated.
The reaction in Japan has been relatively restrained. Chief Cabinet Secretary Minoru Kihara reiterated that authorities stand ready to respond appropriately to excessive currency movements at any time. Yet verbal intervention may prove less effective when the primary driver is a broad repricing of US interest rates rather than speculative activity alone. The contrast between markets was telling: while Wall Street weakened on higher-rate concerns, the Nikkei climbed above the 71,000 mark as investors welcomed the earnings benefits of a weaker Yen.
Technically, USD/JPY's rally remains firm. As long as minor support at 160.10 holds, further gains are favored toward the 2024 high at 161.94. Decisive break there would open the way to 100% projection of 152.25 to 160.71 from 155.01 at 163.47. On the downside, a break below 160.10 could trigger a deeper pullback toward 159.54 and below. For now, however, the combination of renewed Fed tightening expectations and gradual BoJ normalization continues to argue for further upside pressure on the pair.
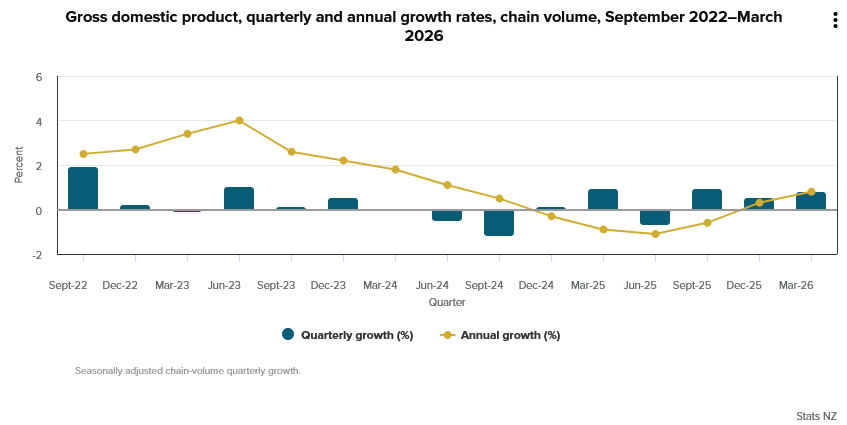
New Zealand Q1 GDP Meets Forecasts at 0.8% as Manufacturing Drives Growth
New Zealand's economy expanded by 0.8% qoq in the first quarter of 2026, matching market expectations and accelerating from the 0.5% qoq growth recorded in the final quarter of 2025. GDP per capita rose 0.5% qoq, adding to signs that the recovery is becoming more broad-based. On an annual basis, economic activity increased 0.8% in the year to March 2026.
Growth was supported by gains across much of the economy, with nine of sixteen industries reporting higher activity during the quarter. Manufacturing was the largest contributor to growth, rising 1.9% qoq. Within the sector, transportation equipment, machinery and equipment manufacturing jumped 4.0%, while food, beverage and tobacco manufacturing increased 1.7%. Business services rose 1.1%, driven by professional, scientific and technical services, while wholesale trade gained 2.4% on stronger machinery and equipment wholesaling activity.
The details suggest the economy is gradually regaining momentum, although pockets of weakness remain. Mining fell sharply by -11.6%, largely due to lower oil and gas extraction, while construction contracted by -1.0% as both residential and non-residential building activity declined.
By industry grouping, services contributed 0.33 percentage points to overall GDP growth, while goods-producing industries added 0.08 percentage points. The figures reinforce the view that New Zealand's recovery is becoming more established, though uneven sector performance is likely to keep the Reserve Bank of New Zealand attentive to signs of slowing demand in interest-rate-sensitive sectors.
New Zealand GDP – Q1 2026
| Indicator | Q1 2026 | Expected |
|---|---|---|
| GDP Q/Q | 0.8% | 0.8% |
| GDP Per Capita Q/Q | 0.5% | |
| GDP Y/Y | 0.8% |
GDP Growth by Industry Group
| Industry Group | Growth Q/Q | Contribution to GDP Growth |
|---|---|---|
| Primary Industries | -0.5% | -0.02pp |
| Goods-Producing Industries | 0.4% | 0.08pp |
| Services Industries | 0.5% | 0.33pp |