

Sample Category Title
Major Cryptos Are Gradually Gaining Momentum
Market Overview
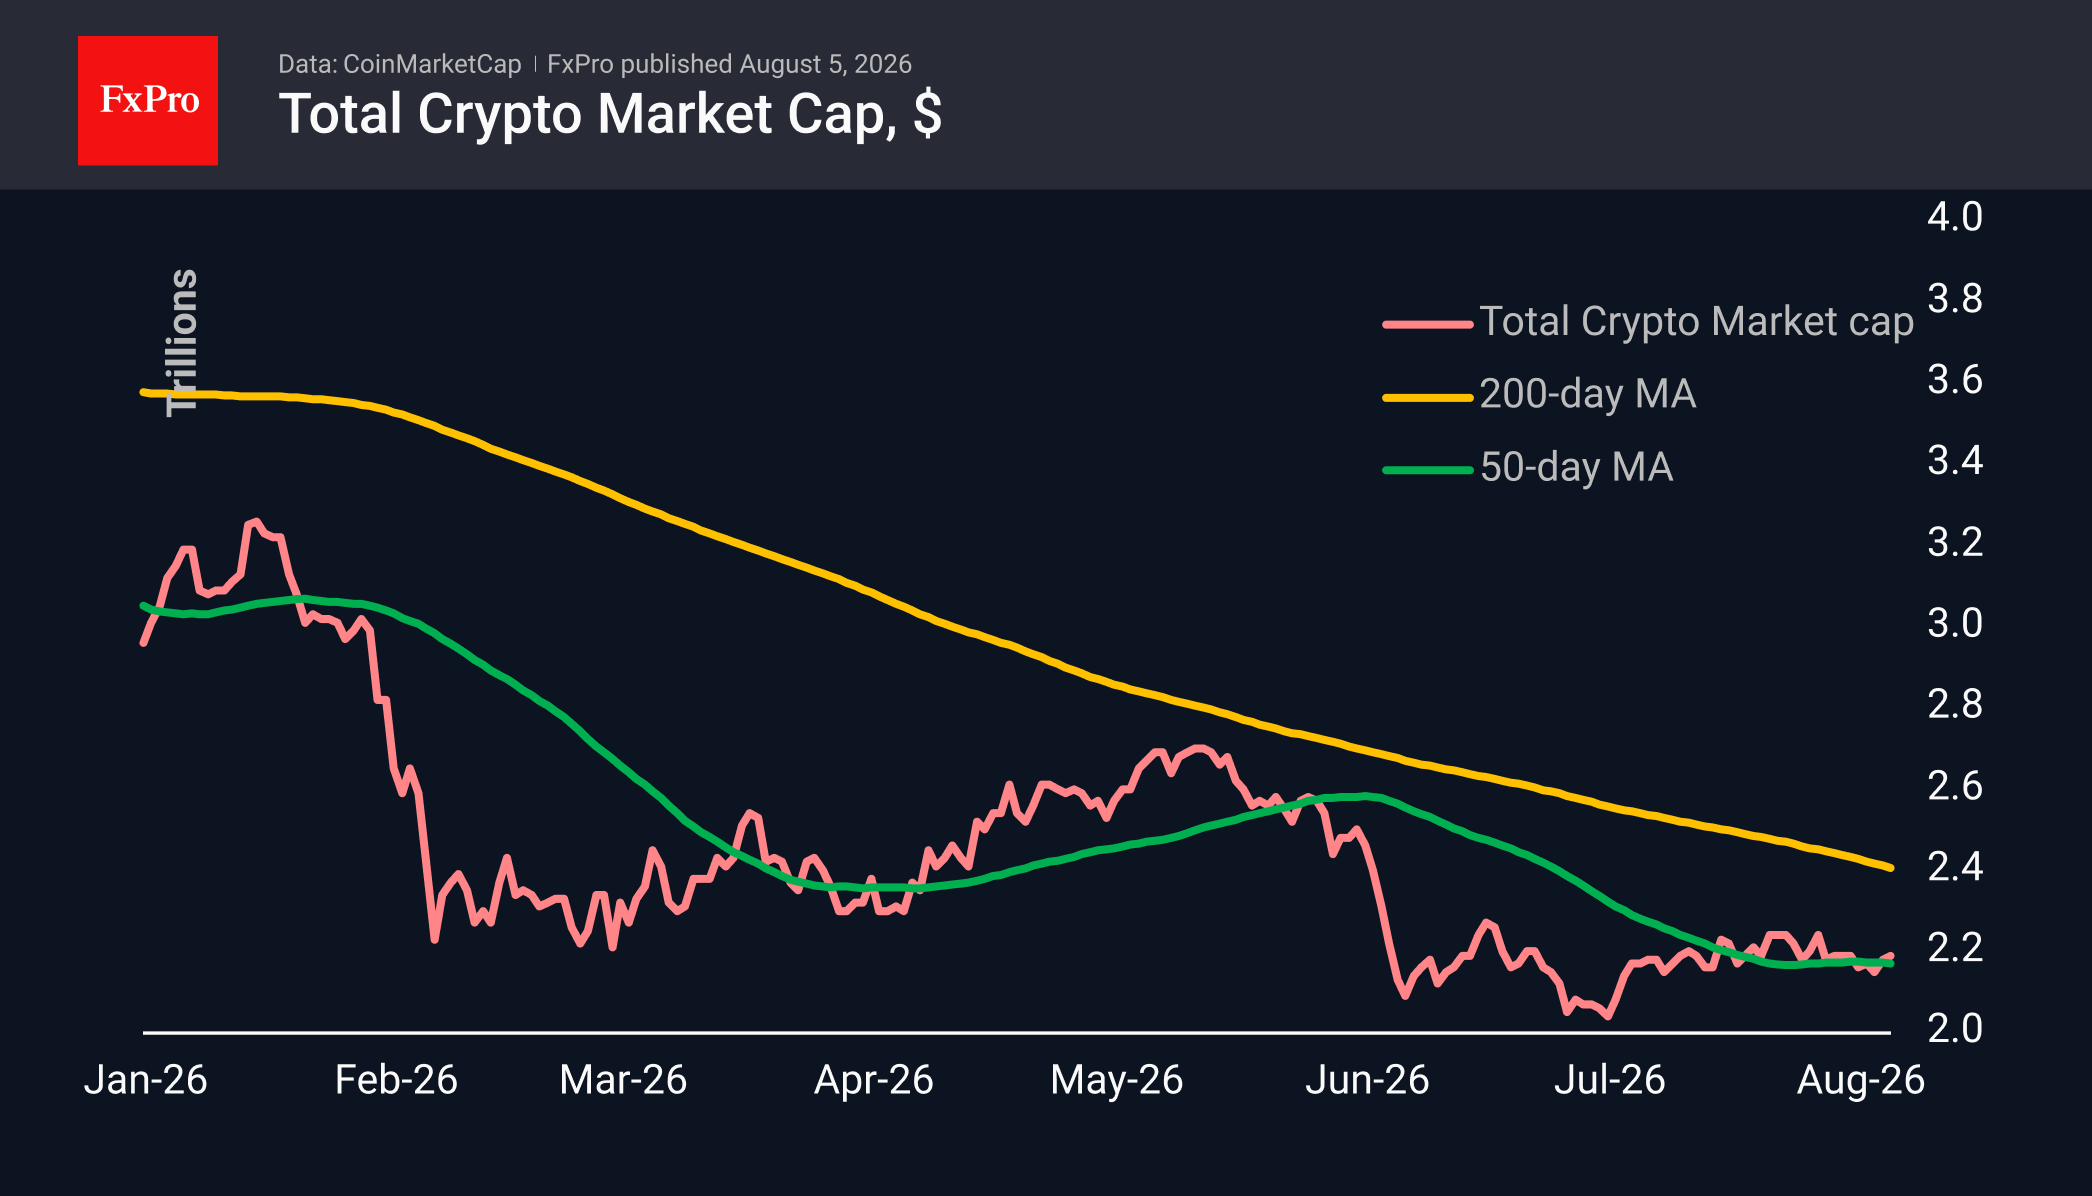
Having risen steadily for the second day running, the crypto market capitalisation has returned to $2.19T, matching levels seen at the end of last week. Despite the weakened correlation between cryptocurrencies and US equities – and in many cases even a negative correlation – cryptocurrencies have nevertheless attracted buyer interest against a backdrop of a weakening dollar and falling oil prices. Looking at the broader picture, the battle for the 50-day moving average continues, meaning the market has yet to settle on a medium-term trend. Over the past day, popular coins ranged from -2.6% (Cardano) and -2.5% (NEAR Protocol, Stellar) to +2.4% (Basic Attention Token) and +6% (Zcash).
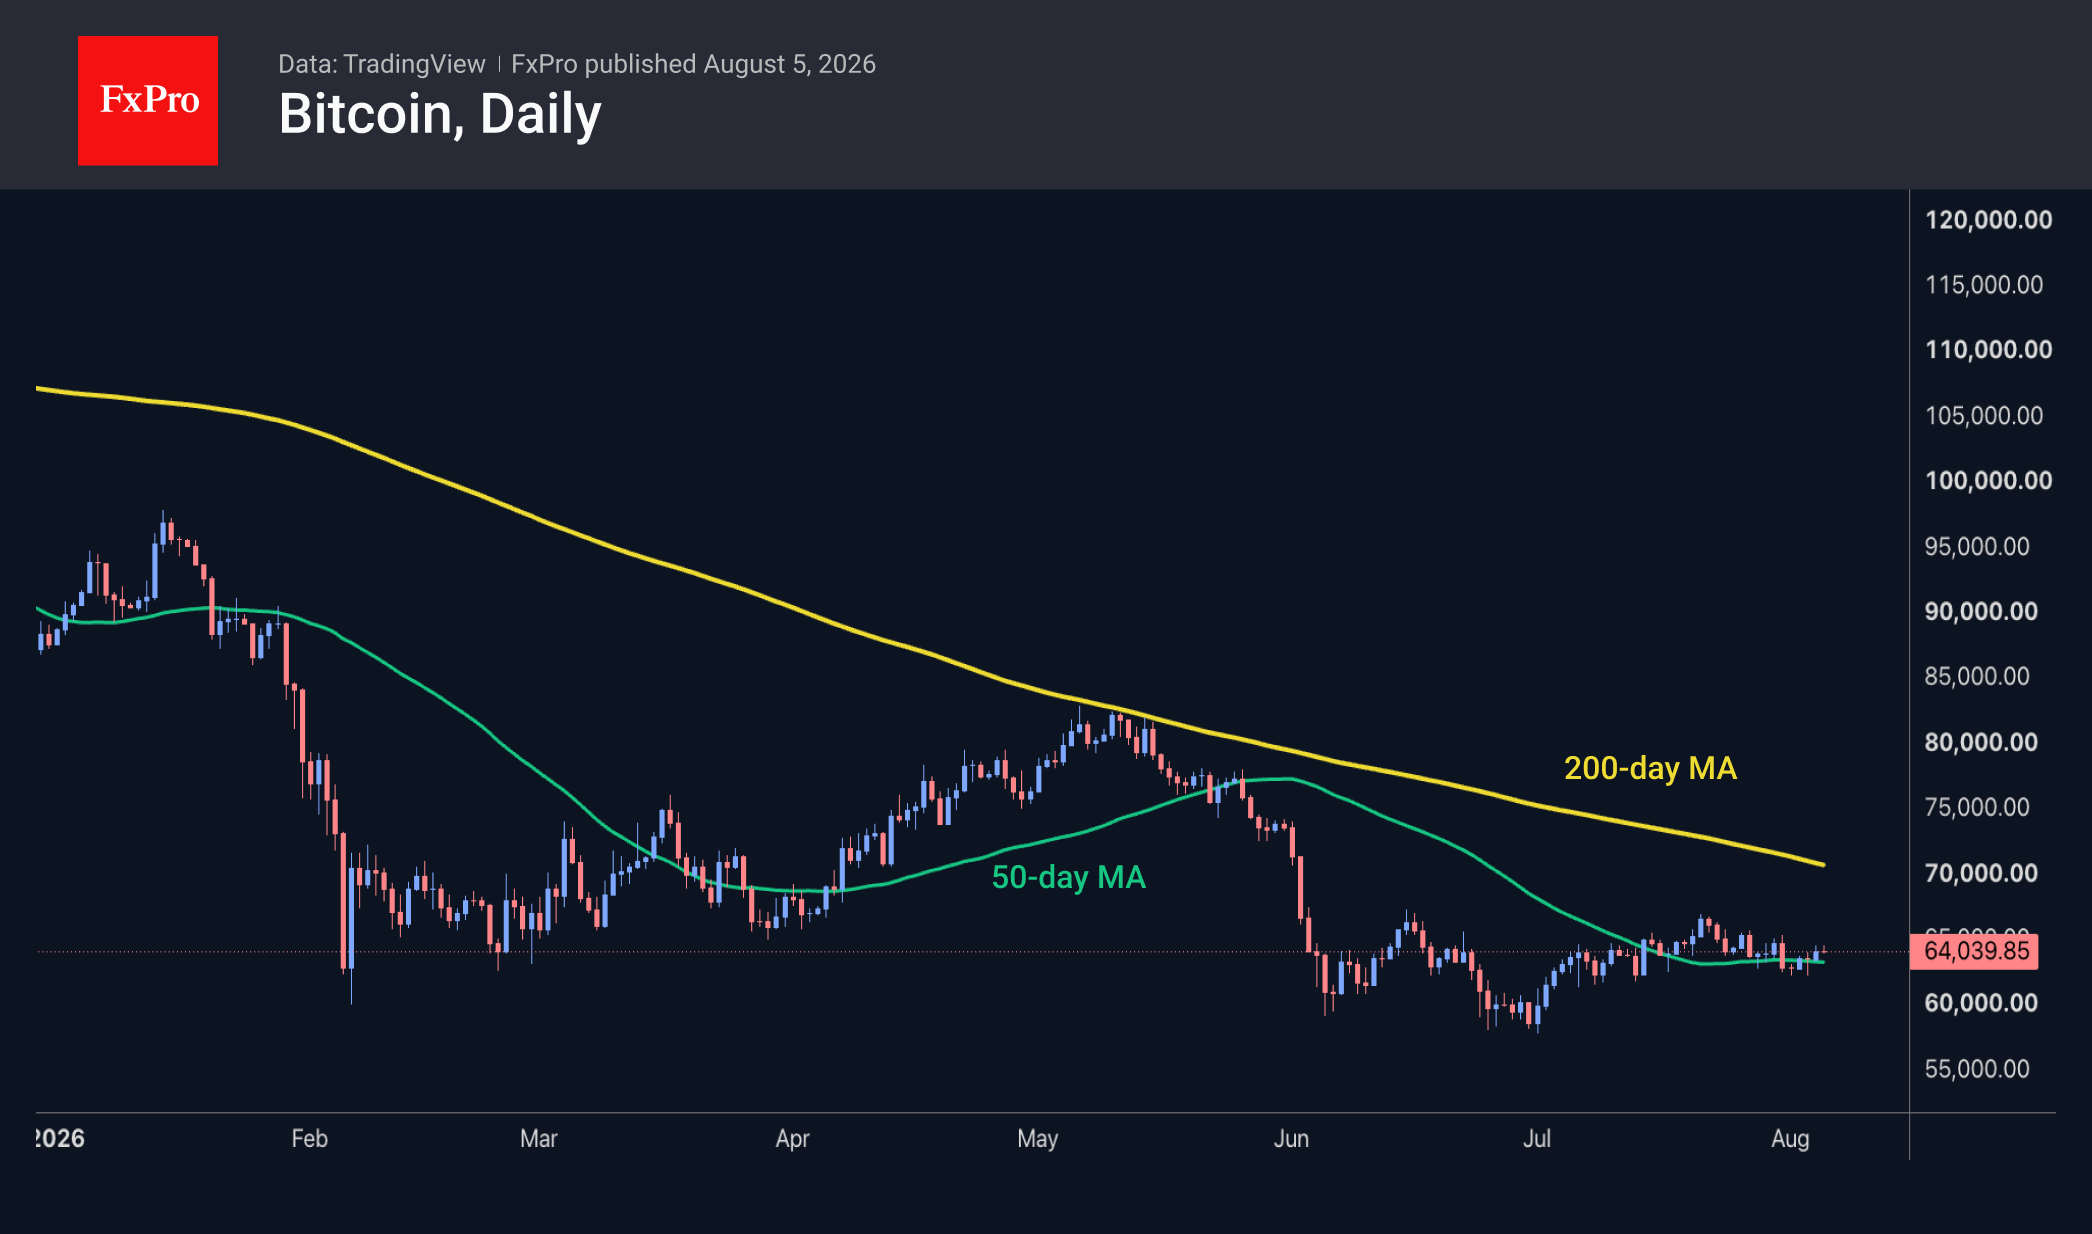
Bitcoin has risen to $64.3K, gaining momentum since Monday, when the bulls provided fairly strong support during the dip to local lows around $62.5K and pushed the price back above the 50-day moving average. For now, optimism is centred more on BTC than on the crypto market as a whole, which is typical of the early stages of a long-term market shift.
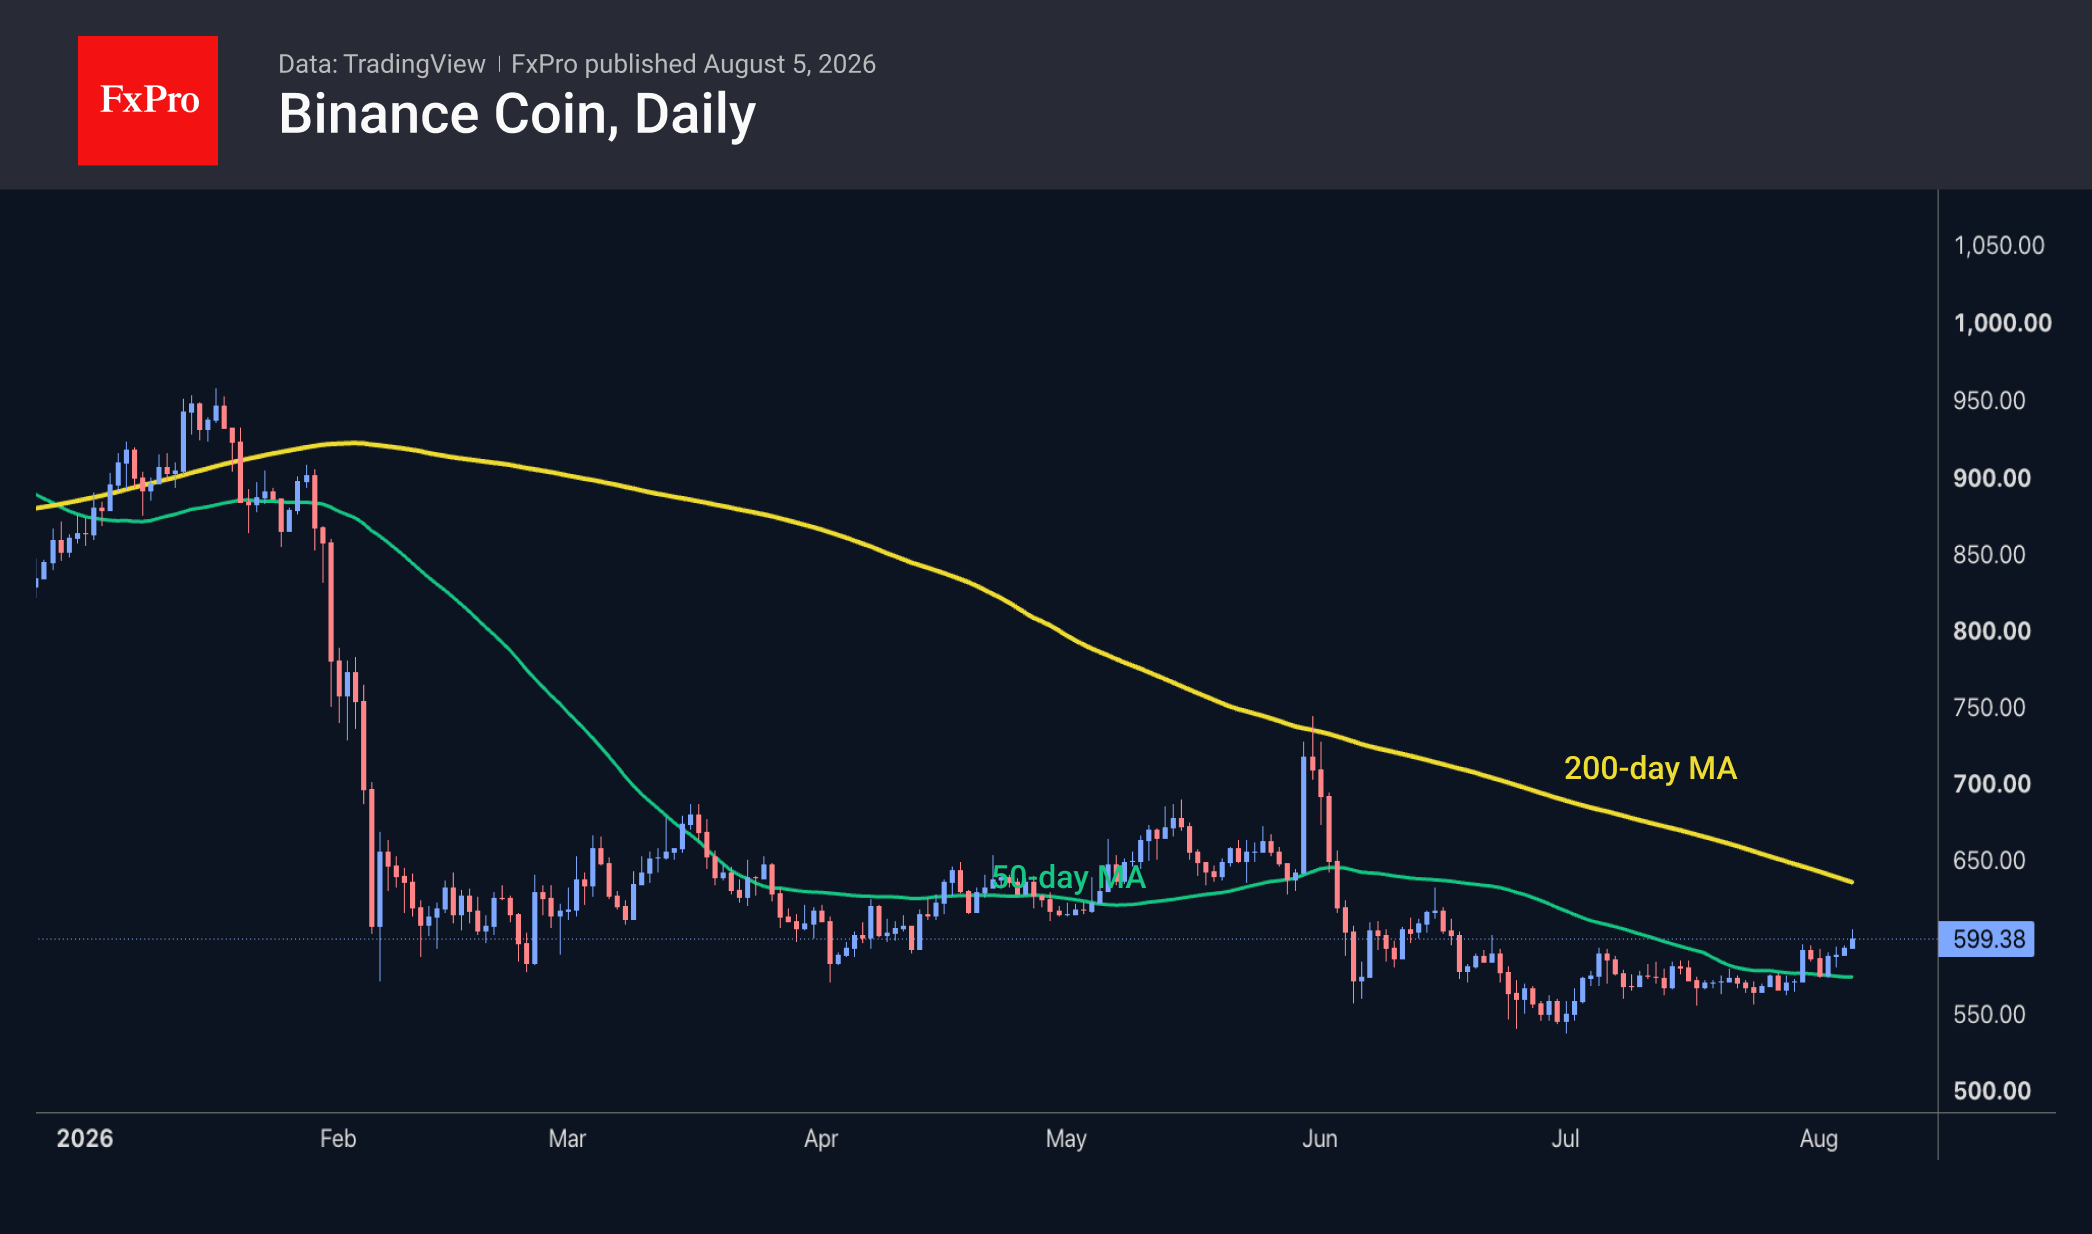
Binance Coin has risen to $600, testing its highest levels in the last two months. The coin has gained around 10% from its lows at the start of July, breaking well above the 50-day MA at the end of last month. Earlier in August, this level had already acted as support; after a test of it, the coin rose for the fourth consecutive day. It may not be difficult for the bulls to push the coin up to $630, but beyond that, it may encounter a cluster of local resistance levels from this year, including the 200-day moving average, from which BNB was sold off at the end of May.
News Background
Hardware crypto wallet manufacturers Trezor and Foundation have warned users about phishing attacks following the Coldcard incident. Fraudsters are sending emails on behalf of the companies and attempting to trick users into visiting fake websites or downloading malware.
Investment firm Hashdex, which manages $1 billion in crypto assets, has announced the liquidation of its spot Bitcoin ETF, launched on 27 March 2024. The company attributed its decision to the fund’s low assets under management and poor trading liquidity.
Mining company American Bitcoin, co-founded by the US President’s son Eric Trump, reported mining 932 BTC in the second quarter, a record high.
BlackRock has introduced 12 tokenised share classes for six European money market funds from its Irish Institutional Cash Series. The tokens are issued on the Ethereum network using JPMorgan’s Kinexys infrastructure.
The FxPro Analyst Team
Eurozone PPI Falls -0.3% M/M on Cheaper Energy, Core Producer Prices Still Rise
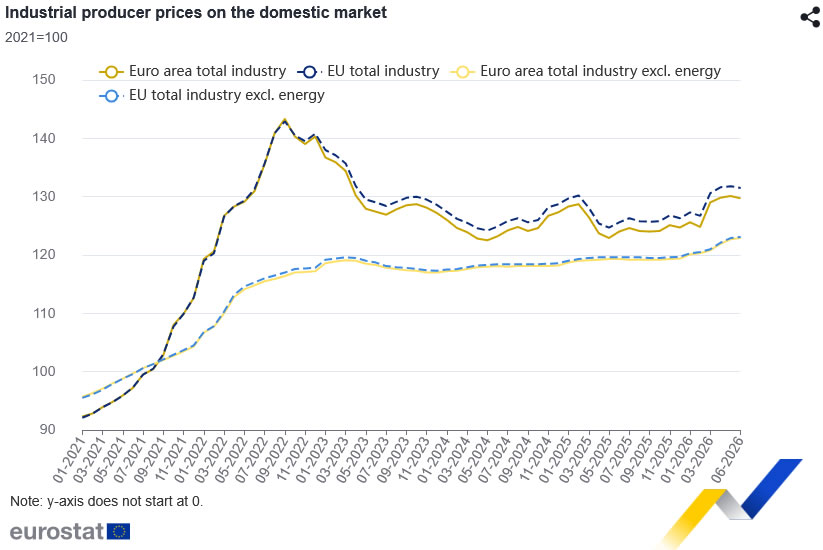
Eurozone producer prices fell in June as lower energy costs outweighed continued increases across most other industrial sectors, suggesting pipeline inflation eased but remained far from disappearing. Industrial producer prices declined -0.3% m/m, matching expectations and reversing May's 0.2% increase, while the annual rate slowed from 5.9% to 4.6%. The figures largely reflected the period of lower oil prices during June before renewed volatility in energy markets emerged in July.
The decline was driven almost entirely by the energy sector, where producer prices dropped -1.5% m/m. By contrast, underlying price pressures remained positive across much of the industrial economy. Intermediate goods prices rose 0.3%, while capital goods and durable consumer goods each increased 0.2%. Excluding energy, producer prices actually rose 0.2%, indicating that manufacturing cost pressures continued to build despite the headline decline.
The data broadly reinforce the message from this week's PMI surveys that inflation pressures are moderating. Slower producer price growth should offer some reassurance for the ECB, but the persistence of positive ex-energy inflation suggests underlying pricing power remains intact. With oil prices having rebounded after June before easing again this week on renewed hopes of a Strait of Hormuz agreement, policymakers are likely to view the report as evidence of gradual disinflation rather than a decisive turning point.
Data Summary
| Indicator | June 2026 | May 2026 | Trend |
|---|---|---|---|
| PPI M/M | -0.3% | +0.2% | ▼ First monthly decline since February |
| PPI Y/Y | 4.6% | 5.9% | ▼ Annual inflation eased |
| PPI Ex-Energy M/M | +0.2% | +0.7% | ▲ Underlying prices still rising |
| Intermediate Goods M/M | +0.3% | +1.4% | ▲ Positive but slower |
| Energy M/M | -1.5% | -1.0% | ▼ Main drag on headline |
| Capital Goods M/M | +0.2% | +0.3% | ▲ Continued increase |
| Durable Consumer Goods M/M | +0.2% | +0.3% | ▲ Continued increase |
| Non-Durable Consumer Goods M/M | 0.0% | -0.1% | ► Stable |
Key Takeaways
- Eurozone producer prices fell 0.3% m/m in June, exactly in line with expectations, while annual producer inflation slowed to 4.6% from 5.9%.
- The decline was almost entirely driven by a 1.5% fall in energy prices, reflecting the period of lower oil prices during June.
- Underlying pipeline inflation remained intact. Producer prices excluding energy rose 0.2%, while intermediate goods, capital goods and durable consumer goods all recorded monthly increases.
- The report reinforces this week's PMI surveys, which also showed easing—but not disappearing—cost pressures across the Eurozone.
- As the data predate July's renewed volatility in oil markets, policymakers are likely to treat the report as backward-looking while continuing to monitor the impact of recent geopolitical developments on energy prices.
- Overall, the release supports the view of gradual disinflation rather than a collapse in producer price pressures, leaving the ECB room to remain patient.
Full Eurozone PPI release here.
UK Services PMI Returns to Growth, but Record Job Losses Cast Shadow
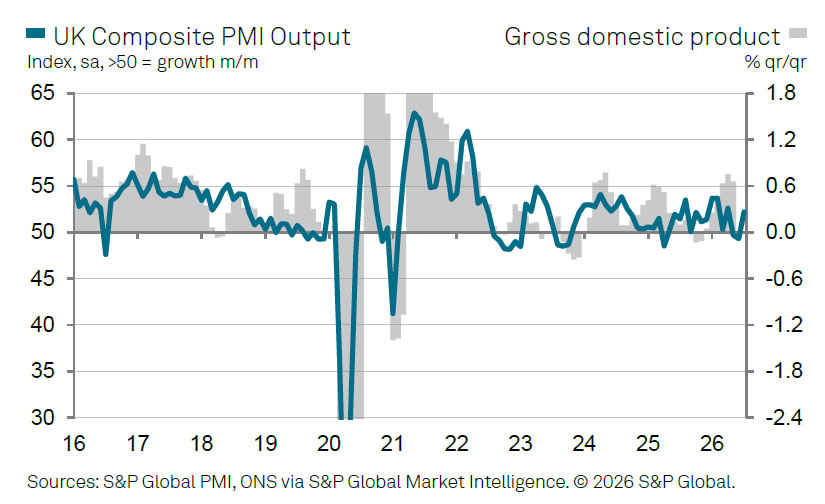
The UK's private sector returned to growth in July as the services sector rebounded after two months of contraction. The S&P Global UK Services PMI rose to 52.1 from 48.8 in June, while the Composite PMI climbed to 52.2 from 49.3, marking the first expansion in overall business activity since April. Higher consumer spending and robust demand for technology services helped lift activity, while manufacturing output also recorded its strongest increase since September 2024.
The recovery extended beyond output. New business increased for the first time in five months, reflecting gradually improving market conditions, although the pace of growth remained modest by historical standards. Survey respondents continued to cite geopolitical uncertainty and the conflict in the Middle East as constraints on demand, despite signs that clients had become less risk-averse. Encouragingly, business confidence improved for a second consecutive month, reaching its highest level since February as firms looked for further easing in inflation pressures and geopolitical tensions.
One area that continues to lag is the labour market. Employment declined for a 22nd consecutive month, matching the longest stretch of job losses in the survey's three-decade history, previously seen during the global financial crisis and after the dotcom bust. At the same time, input cost inflation slowed to a five-month low, providing some relief for businesses. The latest survey therefore suggests the UK economy is regaining momentum, but the recovery remains uneven, with stronger demand yet to translate into sustained hiring.
Data Summary
| Component | July 2026 | June 2026 | Trend |
|---|---|---|---|
| Services PMI | 52.1 | 48.8 | ▲ Back in expansion; highest since April |
| Composite PMI | 52.2 | 49.3 | ▲ Returned to expansion |
| Business activity | Expanded | Contracted | Recovery resumed |
| New business | Expanded | Contracted | First rise in five months |
| Business expectations | Highest since February | Improved | ▲ Confidence strengthened |
| Employment | Declined | Declined | ▼ 22nd consecutive monthly fall |
| Input cost inflation | Increased | Increased | ▼ Slowest pace in five months |
| Manufacturing output | Strongest since Sep 2024 | Expanded | ▲ Accelerated |
Key Takeaways
- The UK Services PMI rose to 52.1 and the Composite PMI to 52.2, returning both sectors to expansion for the first time since April.
- Higher consumer spending and solid demand for technology services helped drive the rebound, while manufacturing production recorded its strongest growth since September 2024.
- New orders increased for the first time in five months, suggesting domestic demand is beginning to recover despite ongoing geopolitical uncertainty.
- Business confidence improved for a second consecutive month, reaching its highest level since February on hopes of easing inflation and reduced Middle East tensions.
- The labour market remained the weakest part of the survey, with employment falling for a 22nd straight month, matching the longest period of job losses in the survey's 30-year history.
- Input cost inflation slowed to a five-month low, providing further evidence that price pressures are gradually easing even as logistics challenges persist.
Eurozone Composite PMI Climbs to Eight-Month High, Indicates 0.3% Quarterly GDP Growth
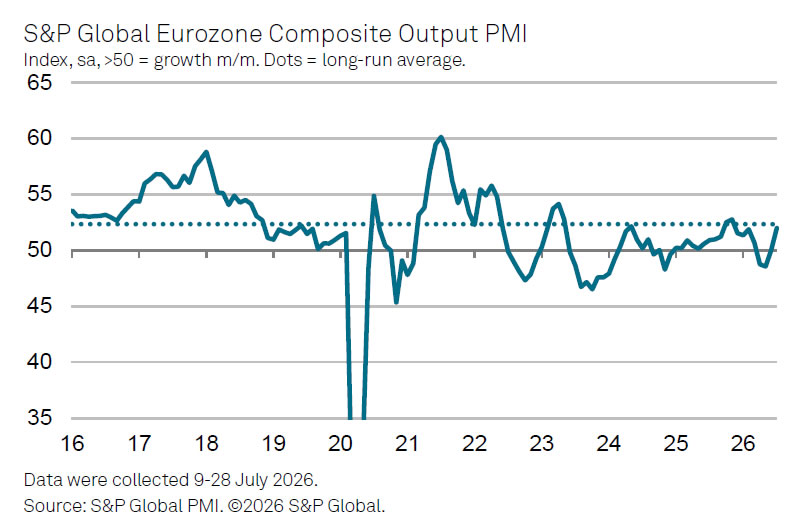
The Eurozone economy gathered momentum at the start of the third quarter, with business activity expanding at its fastest pace in eight months as the services sector returned to growth. The final S&P Global Composite PMI rose to 52.0 in July from 50.0 in June, while the Services PMI climbed to 51.7 from 49.4, its highest level in five months. The survey pointed to the strongest increases in output and new orders since November, suggesting demand is recovering despite continued geopolitical uncertainty.
The improvement was broad-based across the region. Germany led the recovery, with its Composite PMI returning to expansion territory at 51.3 after three months of contraction, supported by a near-stabilization in services activity. France remained a laggard, but conditions improved noticeably as both services and overall private-sector activity moved closer to the 50 threshold, indicating the downturn is steadily easing. The divergence between the Eurozone's two largest economies therefore narrowed further during July.
The survey also offered encouraging news on inflation. Business optimism rose to its highest level since January as demand strengthened and input cost inflation slowed to its weakest pace since February. That combination points to a healthier growth environment without a renewed surge in price pressures. According to S&P Global, the PMI is consistent with around 0.3% quarterly GDP growth, reflecting a recovery that is becoming increasingly broad-based.
However, the outlook remains closely tied to developments in the Middle East. Much of July's improvement followed the temporary easing in oil prices and geopolitical tensions during June. With the conflict having intensified again since then, risks to both growth and inflation have resurfaced. While the moderation in PMI price gauges could give the ECB room to delay further policy tightening until the inflation outlook becomes clearer, policymakers are unlikely to become complacent given the renewed uncertainty surrounding energy markets.
Data Summary
| Component | July 2026 | June 2026 | Trend |
|---|---|---|---|
| Eurozone Composite PMI | 52.0 | 50.0 | ▲ 8-month high |
| Eurozone Services PMI | 51.7 | 49.4 | ▲ 5-month high |
| Output | Expanded | Expanded | Strongest since November |
| New Orders | Expanded | Expanded | Strongest since November |
| Business Optimism | Highest since January | Improved | ▲ Stronger confidence |
| Input Cost Inflation | Slowed | Faster | ▼ Slowest since February |
Major Economies
| Economy | Services PMI | June | Composite PMI | June | Assessment |
|---|---|---|---|---|---|
| Germany | 49.8 | 48.6 | 51.3 | 49.5 | Composite returned to expansion |
| France | 49.6 | 46.8 | 49.4 | 47.2 | Contraction eased markedly |
Key Takeaways
- The Eurozone Composite PMI climbed to 52.0, its highest level in eight months, while the Services PMI returned to expansion at 51.7, the strongest reading in five months.
- Output and new orders recorded their fastest growth since November, pointing to improving demand at the start of the third quarter.
- Germany led the recovery, with its Composite PMI returning above 50 for the first time since March, while France remained in contraction but showed a notable improvement.
- Business confidence strengthened to its highest level since January, supported by improving demand and easing cost pressures.
- Input cost inflation slowed to its weakest pace since February, providing some relief after months of elevated price pressures.
- S&P Global estimates the survey is consistent with around 0.3% q/q GDP growth, although renewed Middle East tensions and higher oil prices have reintroduced downside risks to growth and upside risks to inflation.
ADP in Focus Ahead of Friday’s Jobs Report
In focus today
In the US, focus will be on ADP's July private sector employment report, as this will provide markets with an early sense of what to expect from the upcoming Jobs Report on Friday. ADP's weekly estimates have pointed towards cooling employment growth from June. The ISM Services index for July will also be released, with the earlier flash PMI pointing to an uptick in business activity. The Fed's Cook (voter, neutral) will be on the wires in the evening, while Daly (non-voter) is scheduled to deliver keynote remarks overnight into Thursday.
In the euro area, we receive the final services and composite PMIs for July. Both surprised to the upside in the flash release, with the services PMI at 51.6 (prior: 49.4) and the composite PMI at 51.9 (prior: 50.0). June PPI figures will also be released, following a 0.2% m/m increase in May and a rise in the annual rate to 5.9%, the strongest reading since March 2023.
Economic and market news
What happened overnight
In the US-Iran war, oil prices extended declines after Axios reported that the US was closing in on a 60-day interim deal to reopen the Strait of Hormuz without tolls. Trump said more clarity was expected within 48 hours.
In the US, Kansas City Fed's Schmid (non-voter, hawk) argued that monetary policy is not yet restrictive given strong demand and investment, signalling that further tightening may be needed. Meanwhile, Philly Fed's Paulson (voter, dove) pushed back against rapid rate hikes, saying policy is likely already mildly restrictive and that it 'was not a close call to keep rates steady (in July)'.
In Japan, minutes from the June meeting showed that the Bank of Japan (BoJ) was increasingly focused on broadening inflation risks, as firms planned price hikes across a wide range of goods. BoJ board members noted that higher fuel costs, a weak yen and a tight labour market could add further pressure on consumer prices.
What happened yesterday
In commodities, Brent crude fell below USD80/bbl from USD86/bbl. The sharp drop was triggered by news that US and Iran may be nearing a deal to reopen the Strait of Hormuz again. In addition, Bloomberg survey data showed that Gulf countries managed to increase oil production in July.
In the US, June JOLTS job openings declined a bit more than expected to 7.36m (cons: 7.40m) from 7.54m in May. On the other hand, both hiring and voluntary quits rose, while involuntary layoffs remained unchanged. The ratio of job openings to unemployed job seekers was little changed at 1.04 from 1.03 in May.
In Denmark, FX reserves showed that Danmarks Nationalbank (DN) refrained from intervening in July, despite EUR/DKK remaining elevated. DN intervened for DKK0.7bn in June, which was the first FX intervention in more than three years, but upward pressure on EUR/DKK eased enough for DN to stay sidelined in July.
Equities: Equity markets delivered what can best be described as an atypical, but classic 2026 risk on session yesterday rather than a traditional risk on day. The key driver was not an upgrade to growth expectations but a further removal of downside fears. The two dominant swing factors were reduced concerns over the Iran conflict and fading fears around the AI bubble. As risk premia continued to compress against a backdrop where the underlying macro and earnings picture remains exceptionally strong, equities extended their rally. Importantly, 2026 style risk on does not imply indiscriminate buying across sectors. Three sectors finished lower yesterday, led by Energy, while global Technology gained more than 3%. Another wave of all-time highs pushed global equities close to a 15% year to date return. The S&P 500 posted its strongest session since April and its first record close since June 2. Positive momentum continues this morning with gains across Asian markets alongside firmer US and European futures.
FI and FX: The US is nearing a 60-day interim deal to reopen the Strait of Hormuz and an announcement could come today, Axios reported overnight. US Treasury Secretary Scott Bessent said yesterday that an agreement between the US and Iran could come "today or tomorrow", which sent Brent crude below USD80/bbl and caused yields to extend Monday's decline, while EUR/USD was little changed above 1.15. Despite a still elevated EUR/DKK during July, Danmarks Nationalbank refrained from intervening in the FX market in July. NOK was hit by the drop in oil prices and EUR/SEK continues to trade close to the 11.00 threshold, remaining in the hands of the overall risk-sentiment. Today, focus will be on possible SOH deal announcement, July private sector employment data from the US ADP and the US ISM Services index also for July.
Silver Breakout Attempt Builds as Hormuz Hopes Reshape Fed Expectations
TL;DR: Silver has returned above $60 as growing optimism over a Strait of Hormuz reopening pulls oil lower, reshapes Fed rate expectations, and drags Treasury yields down — with silver carrying an extra industrial-demand tailwind gold doesn't have.
A Broad Precious Metals Rally, With a Deeper Driver
Silver has returned above $60, joining gold in a broad precious metals rally as investors increasingly bet the inflation shock from the Middle East may prove less severe than feared just a week ago. The immediate catalyst has been growing optimism that the Strait of Hormuz could reopen in the near future, easing concerns over global energy supplies. But the real driver behind silver's renewed strength lies one step further down the chain: falling oil prices are rapidly reshaping Federal Reserve expectations, pulling Treasury yields lower and giving precious metals fresh room to advance.
This move is unfolding alongside record highs in US equities and improving risk sentiment — a combination that's particularly constructive for silver, which benefits not only from monetary easing expectations but also from the prospect of stronger industrial demand if global trade disruptions begin to ease.
Markets Are Pricing Probability, Not Confirmation
Investor optimism has steadily grown following comments from US Treasury Secretary Scott Bessent that an agreement to reopen the Strait of Hormuz could be reached as early as this week. Since then, reports have suggested negotiations are progressing. A senior Middle East diplomat indicated the United States and European countries are pressing Oman to help finalize a temporary arrangement with Iran, while a senior Pakistani official said a reopening document is close to completion. Separately, US Central Command emphasized that commercial traffic through the southern shipping lane has remained operational despite Iranian harassment.
None of these developments confirms the Strait is about to reopen permanently. Iran has yet to publicly endorse such an agreement, and previous episodes have shown how quickly optimistic headlines can unravel. Nevertheless, financial markets rarely wait for certainty — they price changing probabilities, and those probabilities have shifted enough to trigger a broad reassessment across asset classes.
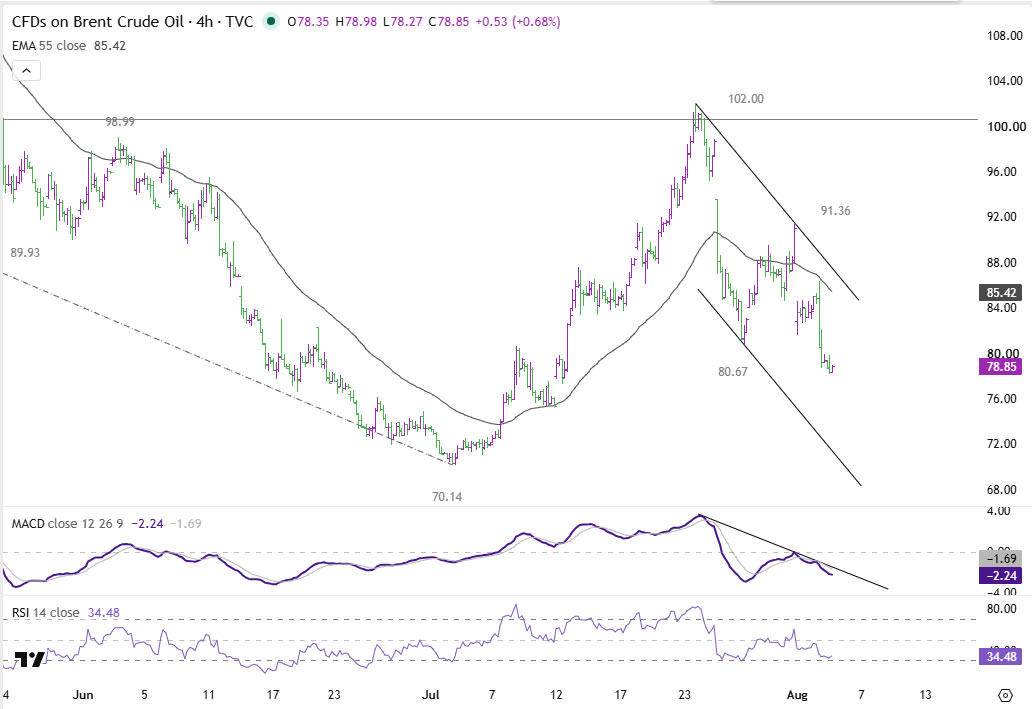
That reassessment is evident in oil markets. Brent has broken below $80 after trading above $100 in late July, although the decline has slowed around the $78 area, suggesting traders still see meaningful geopolitical risk. Equity markets have been quicker to embrace the improving outlook, with the Dow Jones Industrial Average climbing to fresh record highs as investors look beyond the immediate conflict toward a normalization of global trade flows.
From Oil to the Fed: The Transmission Mechanism
For silver, the decline in oil prices matters less because of cheaper energy itself and more because of what it implies for inflation and monetary policy.
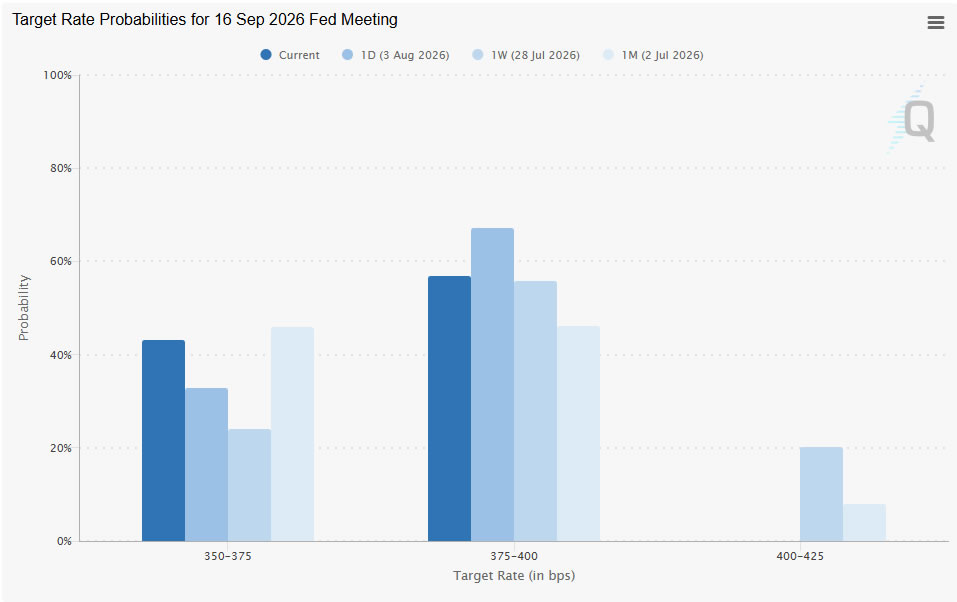
Only a week ago, markets were still assigning around a 20% probability that the Fed could deliver two additional rate hikes this year as surging oil prices threatened to reignite inflation. That tail risk has now disappeared completely. Even over the past 24 hours, expectations have shifted noticeably, with the probability of the Fed holding rates unchanged in September rising from roughly 33% to 43%, while expectations for one hike have moved lower.
Comparing four snapshots for the September 16 meeting shows the shift clearly:
- 1 month ago (Jul 2): ~46% hold, ~46% one hike, ~8% two hikes.
- 1 week ago (Jul 28): ~24% hold, ~56% one hike, ~20% two hikes.
- 1 day ago (Aug 3): ~33% hold, ~67% one hike, 0% two hikes.
- Right now: ~43% hold, ~57% one hike, 0% two hikes.
Treasury markets have responded in kind. The US 10-year yield has retreated from around 4.75% to 4.63% this week, easing one of the most important headwinds for precious metals. If the Hormuz situation continues to improve and energy prices remain contained, markets are likely to see less need for additional Fed tightening, providing further support for gold and silver through lower real yields.
Why Silver Has an Extra Tailwind Gold Doesn't
Gold and silver share the same monetary drivers — both tend to benefit when yields fall and the Dollar softens. But silver enjoys an additional advantage that could become increasingly important if the current geopolitical narrative continues to improve.
A credible reopening of the Strait of Hormuz would not only reduce inflation fears but could also improve expectations for global manufacturing, trade, and industrial production. That matters far more for silver than for gold, because roughly half of silver demand comes from industrial applications. In other words, the same development that encourages investors to buy precious metals through lower yields could simultaneously strengthen silver's underlying physical demand outlook.
That helps explain why silver has recovered so quickly from its recent consolidation, and why its technical picture now appears increasingly constructive.
ActionForex's Technical View on Silver
Technically, price action suggests the consolidation from 60.92 likely ended at 56.54, keeping the rebound from 54.77 intact. The immediate hurdle is a decisive break above 60.92. Such a move would target the 100% projection of 54.77 to 60.92 from 56.54, at 62.69, and strengthen the case that buyers have regained control.
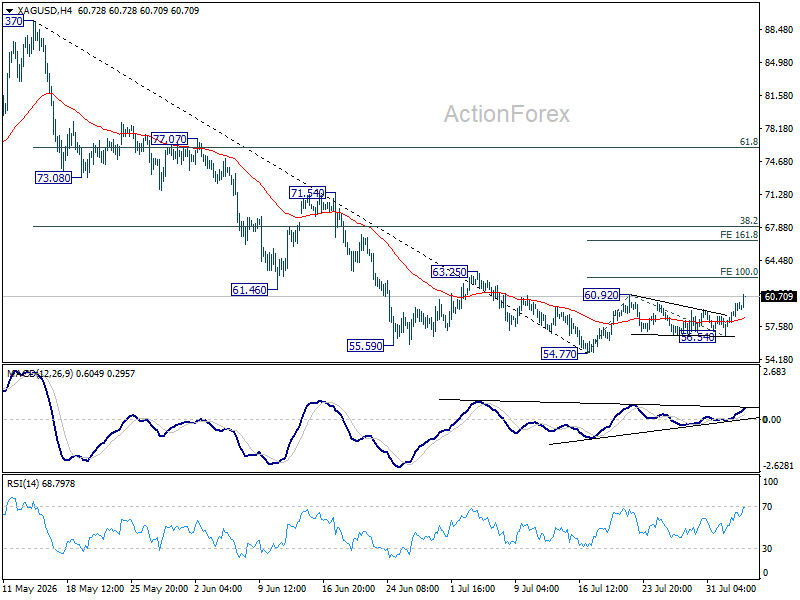
Momentum indicators also deserve close attention — a clean break in the four-hour MACD above its trend line would reinforce the near-term bullish outlook. If 62.69 gives way, the rally could extend toward the 161.8% projection at 66.49, signaling the advance from 54.77 is evolving into an impulsive move.
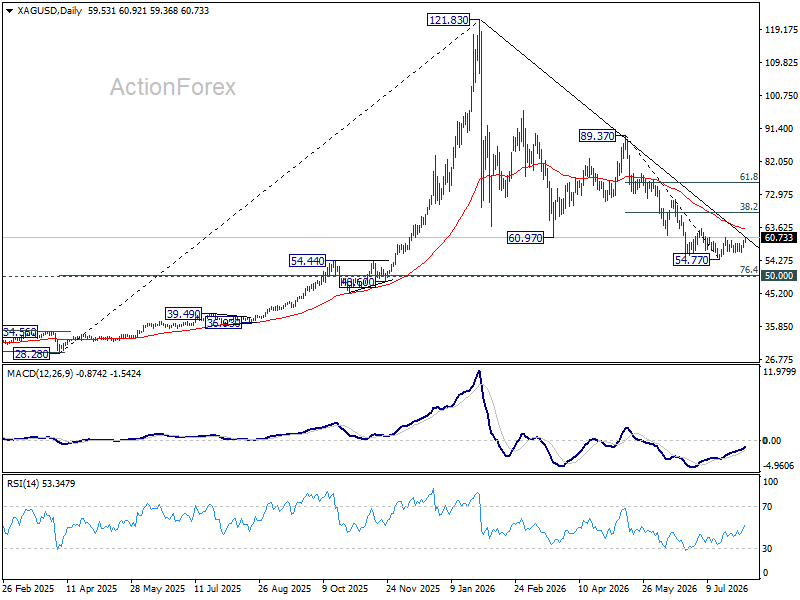
Even then, the bigger picture argues for patience. As long as 67.98 — the 38.2% retracement of the decline from 89.37 to 54.77 — remains intact, the current rally is still best viewed as part of a medium-term corrective structure rather than confirmation of a new secular uptrend. The macro backdrop has turned more supportive, but silver bulls still need both geopolitical progress and technical confirmation before declaring a decisive reversal.
Key Takeaways
- Silver's rally above $60 is driven less by Hormuz optimism itself and more by what falling oil implies for Fed policy and Treasury yields.
- The probability of two Fed hikes this year has dropped from 20% a week ago to 0% currently, with hold probability for September rising from 33% to 43% in just 24 hours.
- The 10-year Treasury yield has fallen from 4.75% to 4.63% this week, removing one of the key headwinds for precious metals.
- Silver carries an added tailwind over gold: roughly half its demand is industrial, so easing trade disruption fears supports both investment and physical demand.
- A decisive break above 60.92 targets 62.69 and then 66.49, but the rally remains a corrective structure, not a confirmed secular uptrend, as long as 67.98 resistance holds.
DAX Chart of the Day: Wave 5 Signals More Upside
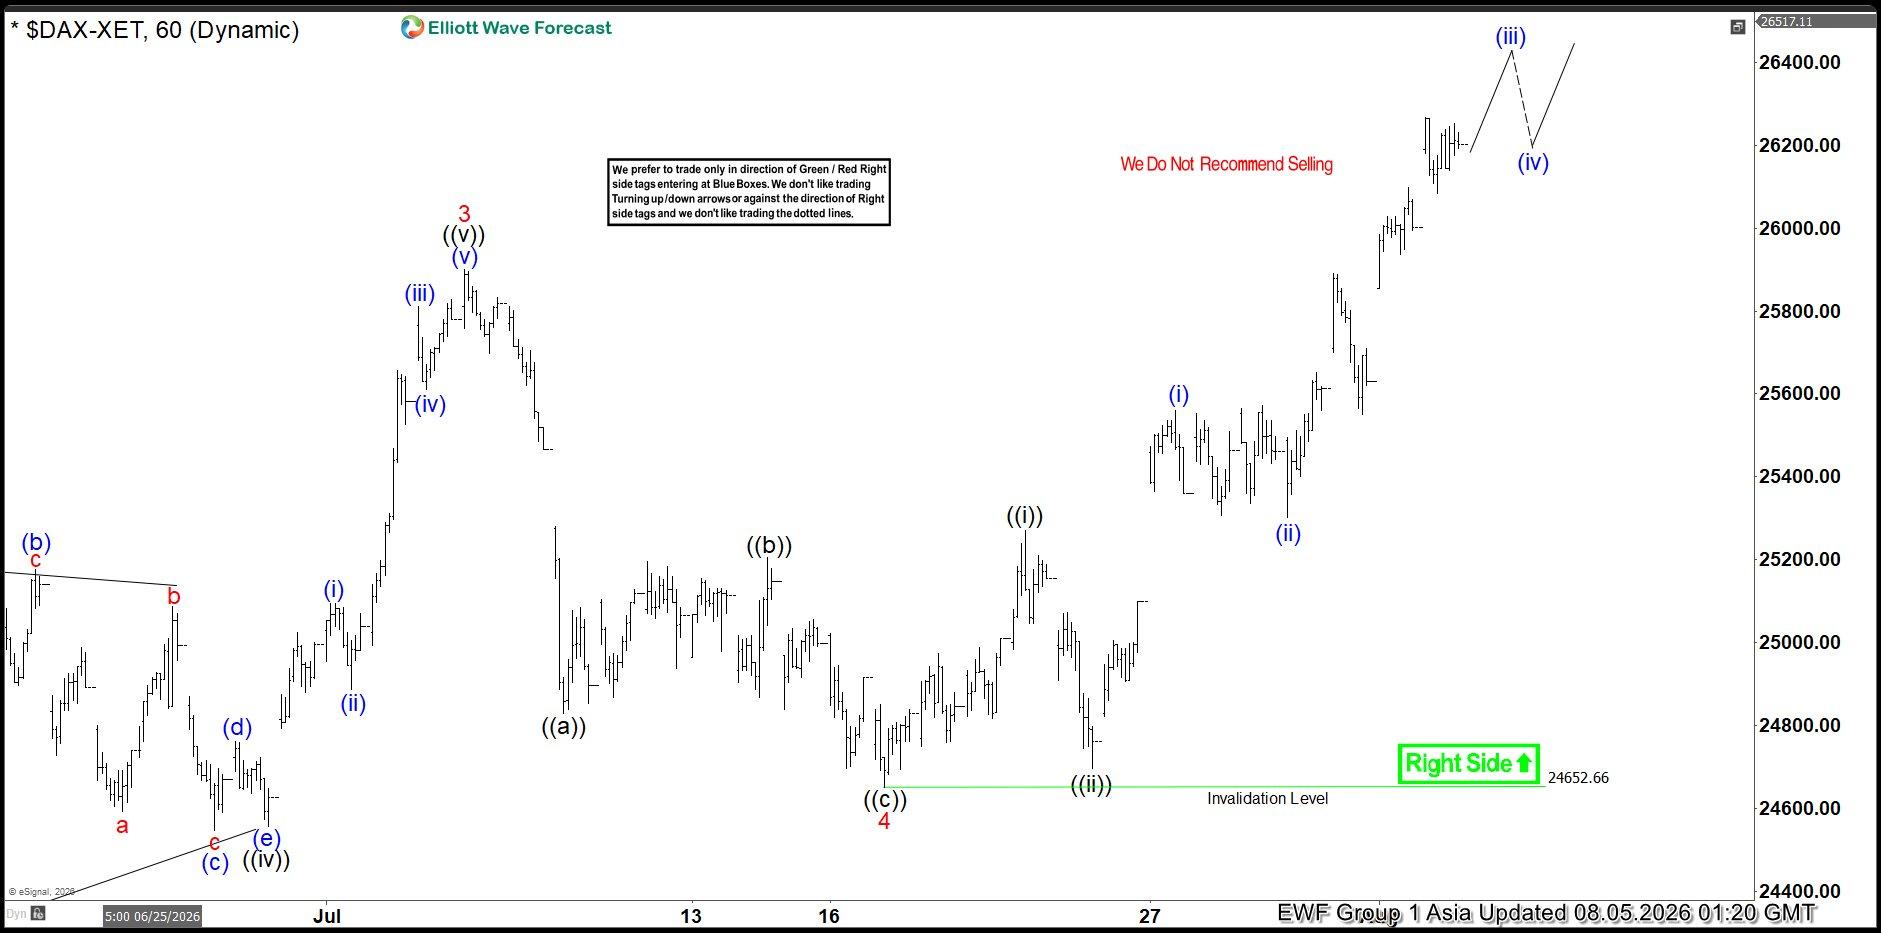
The DAX (XETRA: DAX) continues to follow a bullish Elliott Wave structure after completing red wave 4 at 24,651. The index confirmed the resumption of the uptrend by breaking above the red wave 3 peak at 25,900, signaling that red wave 5 is now in progress. More importantly, the rally from the 21,863 low continues to unfold as a five-wave impulsive structure, keeping the broader trend firmly bullish while price remains above the 24,651 invalidation level.
The 60-minute Elliott Wave chart shows that wave 5 is developing through a bullish nest structure in ((i))-((ii)) and (i)-(ii) sequence, while price is now advancing in wave (iii) of the next degree. Once wave (iii) reaches completion, we expect a corrective pullback in wave (iv) before buyers return to drive the next advance. This sequence should then unfold into ((iii)) and ((iv)), maintaining the impulsive structure and supporting additional gains in the coming sessions.
Based on the current Elliott Wave count, we expect the rally to extend toward 26,702, which remains our initial upside target for red wave 5. However, strong momentum within the impulsive sequence suggests the DAX could extend beyond this level before the larger trend completes.
Overall, our DAX Elliott Wave forecast remains bullish. As long as the index holds above 24,651, traders should continue to favor buying pullbacks. The ongoing impulsive structure points to continued upside, with 26,702 serving as the next key target while leaving room for further gains if bullish momentum accelerates.
08.05.2026 DAX 60 Min. Elliott Wave Chart
DAX Video Analysis:
https://www.youtube.com/watch?v=WcBD89z06xA
Japan’s Wage Cycle Keeps Improving as Real Pay Rises for Sixth Month
Japan's wage growth remained robust in June, reinforcing the Bank of Japan's case for continued policy normalization. Real wages rose 1.6% y/y, matching May's upwardly revised gain and marking a sixth consecutive monthly increase, the longest positive streak since 2021. More notably, nominal cash earnings climbed 3.4%, extending a run of monthly increases above 3% to five months, the longest such streak in more than 34 years.
The strength in pay was supported by another solid round of summer bonuses and this year's strong "shunto" wage negotiations. Special earnings, which include bonuses, rose 3.5%. Summer bonuses also topped JPY 1 million on average for the first time since comparable records began in 1981, reflecting healthy corporate profitability.
Separately, Japan's largest business lobby, Keidanren, said major companies agreed to average wage increases of 5.37%, exceeding 5% for a third consecutive year.
The latest figures reinforce the view that Japan's long-awaited wage-price cycle continues to gain traction. Combined with recent PMI surveys showing firms raising selling prices at one of the fastest rates in nearly two decades, the wage data support the BOJ's assessment that upside inflation risks remain, keeping the door open to further interest rate hikes in the months ahead.
Data Summary
| Indicator | June | May | Trend |
|---|---|---|---|
| Real wages (y/y) | +1.6% | +1.6% | Sixth straight increase |
| Nominal cash earnings (y/y) | +3.4% | +3.2% | Fifth straight month above 3% |
| Inflation used for wage calculation (y/y) | 1.9% | 1.7% | Higher |
| Special earnings / Bonuses (y/y) | +3.5% | — | Stronger |
Key Takeaways
- Real wages rose 1.6% y/y in June, extending gains to a sixth consecutive month, the longest positive streak since 2021.
- Nominal wages increased 3.4% y/y, marking a fifth straight month above 3%, the longest such run in more than three decades.
- Wage growth was supported by strong summer bonuses and another robust round of shunto wage negotiations, with average pay settlements of 5.37%.
- Government energy subsidies helped keep inflation below 2%, allowing real wage growth to remain positive despite higher import costs.
- Economists expect stronger wage growth to feed into consumer prices later this year as firms pass on higher labor and raw material costs.
- The report reinforces the BOJ's normalization narrative, strengthening the case that inflation is becoming increasingly supported by domestic wage growth rather than imported price shocks alone.
China Private Services PMI Slows Sharply to 50.4 as Domestic Demand Loses Momentum
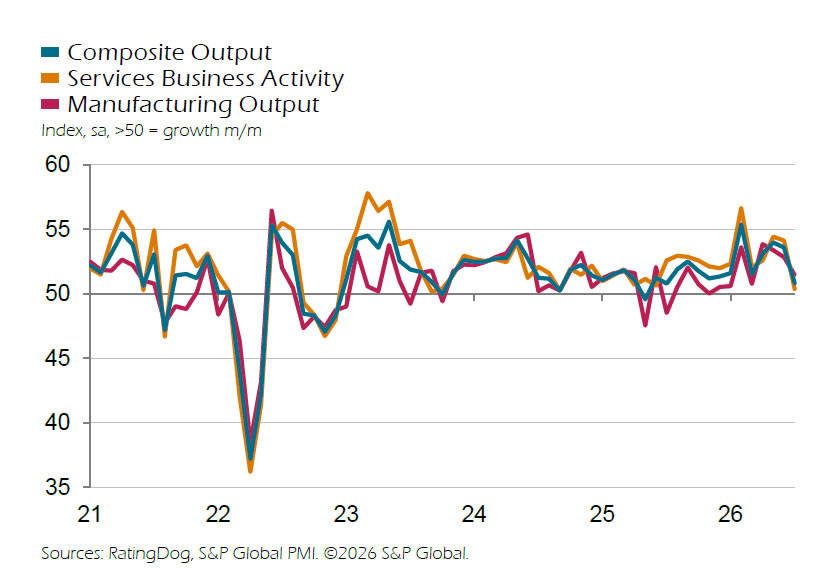
China's services sector remained in expansion in July, but growth slowed sharply as domestic demand weakened. The RatingDog China General Services PMI fell from 54.1 in June to 50.4, its lowest reading since September 2024, while the Composite PMI declined from 53.6 to 50.8, marking the slowest pace of overall private sector growth in a year. The latest survey suggests economic activity continued to expand, but momentum softened noticeably after a stronger first half.
The moderation was driven primarily by weaker domestic demand. Total new business increased for a 43rd consecutive month, but growth slowed to its weakest pace since March. In contrast, external demand remained comparatively resilient, with new export business staying in expansionary territory for a second straight month despite easing from June's year-to-date high. Cost pressures also continued to ease, with input price inflation slowing to its weakest since January, while firms raised selling prices only modestly.
Despite softer demand, the survey contained several encouraging signs. Employment increased for a third consecutive month, the longest period of job creation since the second half of 2024, while backlogs of work rose for a ninth straight month, suggesting firms continue to see enough activity to support hiring. However, business confidence weakened to its lowest level since February 2020, highlighting growing caution over the economic outlook. The report points to an economy that is still expanding, but one that is becoming increasingly dependent on resilient exports as domestic demand loses momentum.
Data Summary
| Component | July 2026 | June 2026 | Trend |
|---|---|---|---|
| Services PMI | 50.4 | 54.1 | ▼ Lowest since Sep 2024 |
| Composite PMI | 50.8 | 53.6 | ▼ Slowest growth in one year |
| Business activity | Expanded | Expanded | Growth slowed sharply |
| New business | Expanded | Expanded | Weakest growth since Mar 2026 |
| New export business | 52.0 | Higher | Still in expansion |
| Input costs | Increased | Increased | Inflation eased to lowest since Jan 2026 |
| Selling prices | Increased | Increased | Inflation moderated |
| Employment | Expanded | Expanded | Third consecutive monthly increase |
| Outstanding business | Increased | Increased | Ninth straight monthly rise |
| Business confidence | Positive | Positive | Lowest since Feb 2020 |
Key Takeaways
- China's Services PMI dropped sharply to 50.4 from 54.1, marking the weakest expansion since September 2024.
- The Composite PMI slowed to 50.8, signalling the weakest pace of private-sector growth in a year as both manufacturing and services lost momentum.
- Domestic demand softened noticeably, with new business expanding at the slowest pace since March, while export demand remained comparatively resilient.
- Cost pressures continued to ease, with input cost inflation slowing to its weakest since January, providing some relief to businesses.
- Employment expanded for a third consecutive month and backlogs of work increased for a ninth straight month, suggesting firms are still seeing sufficient workloads.
- Business confidence weakened to its lowest level since February 2020, highlighting growing caution over China's economic outlook despite continued expansion.
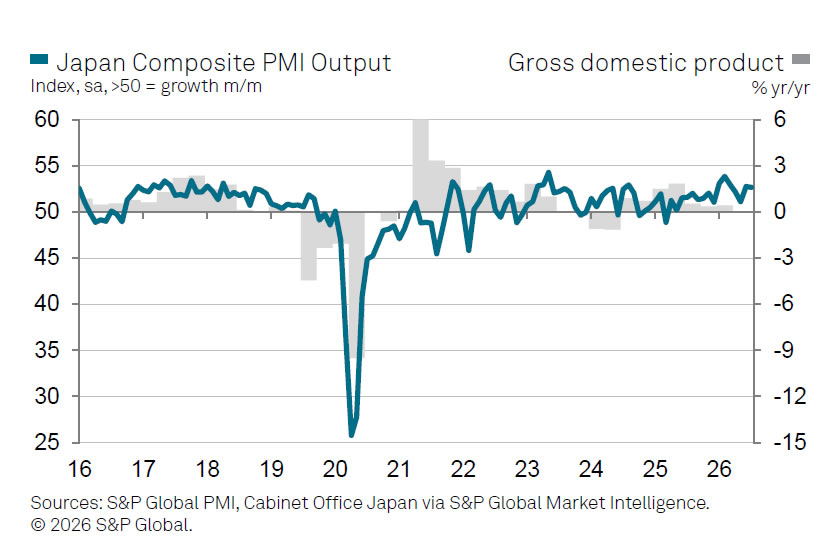
Japan Services PMI Eases to 51.2 in July, Composite Holds at 52.7
Japan's services sector continued to expand in July, but the pace of growth slowed as demand softened from earlier in the year. The S&P Global Japan Services PMI fell to 51.2 from 52.2 in June, signaling a second consecutive monthly expansion but at a more modest pace. Businesses cited events, promotional campaigns and new contract wins as supporting activity, although some firms reported that underlying demand remained relatively subdued.
The moderation in services was largely offset by the manufacturing sector, where output recorded its strongest increase since early 2014. As a result, the Composite PMI edged only slightly lower to 52.7 from 52.8, pointing to another solid expansion in overall private sector activity. Even so, the broader growth trajectory has eased from the stronger pace seen in the first quarter, before the Middle East conflict disrupted global supply chains and raised business costs.
Inflation remained the dominant theme across the survey. Companies continued to report rapid increases in input costs and passed those pressures on through higher selling prices, with output price inflation reaching its second-fastest pace in nearly two decades of data collection. The findings suggest official inflation could strengthen further in the coming months, reinforcing expectations that the Bank of Japan will face continued pressure to normalize monetary policy despite signs that services sector growth has moderated.
Data Summary
| Component | July 2026 | June 2026 |
|---|---|---|
| Services PMI | 51.2 | 52.2 |
| Composite PMI | 52.7 | 52.8 |
| Business activity | Expanded | Expanded |
| New business | Expanded | Expanded |
| Input costs | Increased sharply | Increased sharply |
| Selling prices | Second-fastest rise in nearly 20 years | Elevated |
| Overall outlook | Positive | Positive |
Key Takeaways
- Japan's Services PMI eased to 51.2 from 52.2, indicating the services sector continued to expand but at a slower pace.
- The Composite PMI remained broadly stable at 52.7, as booming manufacturing activity offset softer services growth.
- Service providers continued to benefit from new contracts, events and promotional activities, although many firms reported more subdued underlying demand.
- Inflation pressures remained intense across both manufacturing and services, with firms continuing to face rapid increases in input costs.
- Selling prices rose at the second-fastest pace in nearly two decades, suggesting official inflation could strengthen further in the months ahead.
- The survey reinforces expectations that the Bank of Japan will remain under pressure to continue policy normalization, even as overall economic growth moderates from the stronger pace seen before the Middle East conflict.