Sample Category Title
Bank of England Review – On Hold as Hawkish Arguments Remain Scarce
- The Bank of England kept rates on hold in a 7-2 vote split, as widely expected.
- The economy is slowing, the labour market is cooling and, so far, inflation worries have not materialised.
- We expect an unchanged Bank Rate for the coming year, with risks tilted towards a hike this year and potential for lower rates opening up in 2027.
The Bank of England (BoE) kept Bank Rate unchanged at 3.75% as widely expected. The decision was taken with a 7-2 vote, with Pill and now also Greene voting for a hike to "insure against the possibility of larger second-round effects". Mann, although not voting for hike, was singled out with more inflation worries than the rest of the hold camp. Convinced, "a forceful Bank Rate decision can have a quick effect on inflation and inflation expectations", she stuck with a hold decision. The deciding vote is often Governor Bailey's and as he puts it, he is "content at the present time with holding".
Fresh inflation and labour market data were released just ahead of the meeting. The fear of energy prices spreading to core inflation still has not materialised as core inflation only edged slightly higher to 2.6% in May, below expectations. Food inflation has been mentioned as a key focus point for spillover effects and there were no signs of that with food inflation declining to 2.1% from 2.9% in April.
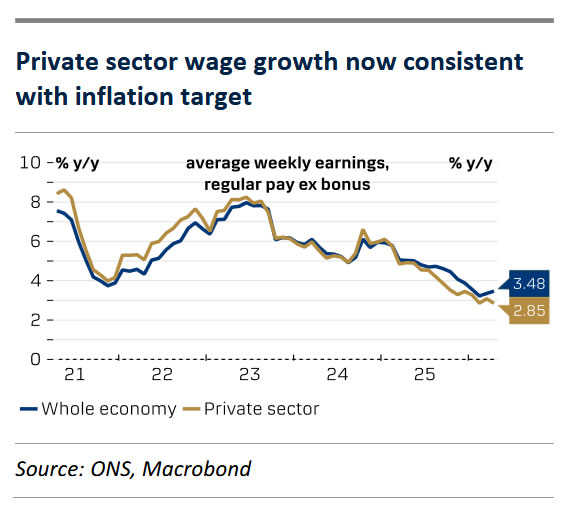
The labour market remains on a cooling trend, although the April/May report was a bit stronger than expected. On the one hand, employment growth was higher and the unemployment rate was lower than expected. Public sector wage growth also increased, which reflects previous uplifts for NHS Staff, as the BoE notes it. On the other hand, the number of vacancies has declined, and private sector wage growth continues to move lower, now at levels consistent with the inflation target. April GDP data suggests, growth was back in negative following a few solid months, and largely, the data released since the previous BoE meeting has been on the soft side. The BoE continues to see the loosening labour market and weakening economy containing inflationary pressures.
BoE call. The meeting today has not changed our view that the most likely outcome is an unchanged Bank Rate for the coming year. Although, core PPI inflation remains quite modest, risks to the inflation outlook remains to the upside given businesses' intention to increase prices quite steeply according to the PMI survey. An uncomfortable period with elevated inflation also lies ahead due to increased energy price caps. The slowing economy, cooling labour market and now also lower oil prices suggest that core price pressures will not increase more than what the BoE will accept, though.
Market reaction. The market reaction was muted and investors price in a full rate hike by the end of the year. A relatively weak UK growth outlook and our dovish stance on BoE compared to market pricing weighs on our GBP call. We forecast EUR/GBP to move higher towards 0.89 on a 6-12-month horizon.
The Pound: A More Challenging Task for the BoE
- The BoE-Fed policy divergence is dragging GBPUSD lower.
- A weaker pound is a pro-inflationary factor for the UK.
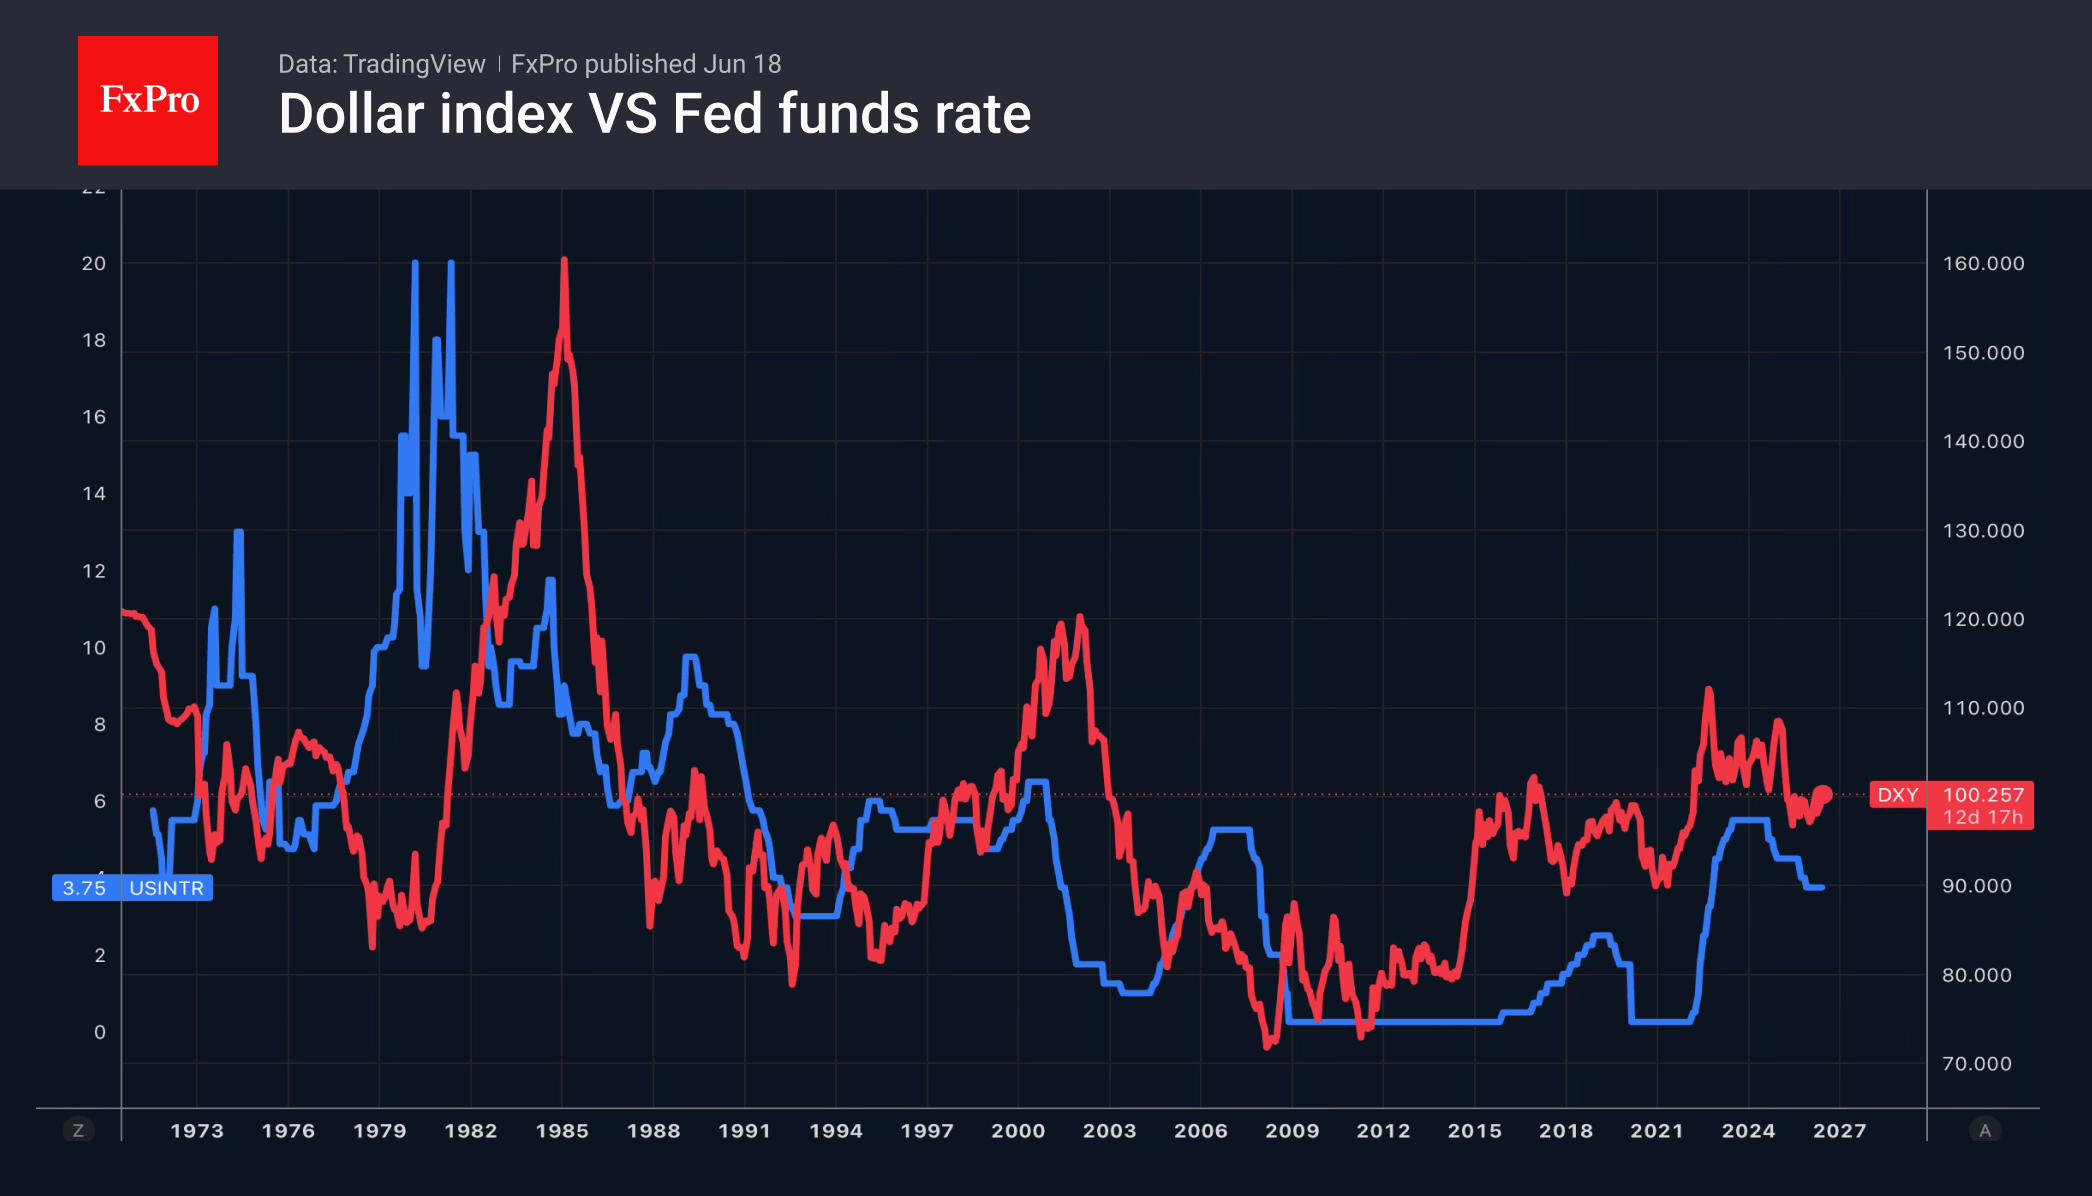
The US dollar recorded its best daily performance since early March, thanks to a hawkish surprise from the Fed. Nine FOMC members indicated in their forecasts that one or more federal funds rate hikes would occur in 2026. Only one official predicted a cut, compared with 12 in March. Combined with Kevin Warsh’s determination to bring inflation back to target at all costs and the removal of the statement of intent from the accompanying document, this pushed the dollar index to a 2.5-month high.
Kevin Warsh has managed to unite the FOMC. While there were four dissenting voices at the previous meeting, there were none at the June meeting. The accompanying statement was shortened from 345 to 132 words, and the new chair avoided statements of intent. In doing so, he is putting into practice his view that the Fed should look less to the past and focus more on the markets.
The Fed’s hawkish rhetoric has raised the odds of a September rate hike from 29% to 62%. The probability of one rate hike in 2026 is estimated at 85%, and of two rate hikes at 46%. Combined with a rally in Treasury yields, this has strengthened the US dollar against major global currencies. Among other things, this has pushed GBPUSD to its sharpest decline since February.
The Fed’s readiness to tighten monetary policy complicates matters for the Bank of England. The forward market has not ruled out a 25-basis-point rate rise in 2026. However, an increasing number of investors are coming round to the view that borrowing costs will remain unchanged. The UK economy is showing signs of weakness, and inflation, according to Bloomberg estimates, will peak at 3% in 2026. This is below the BoE’s most optimistic scenario of a 3.6% price rise. The pessimistic scenario assumed that inflation would rise to 6% in early 2027.
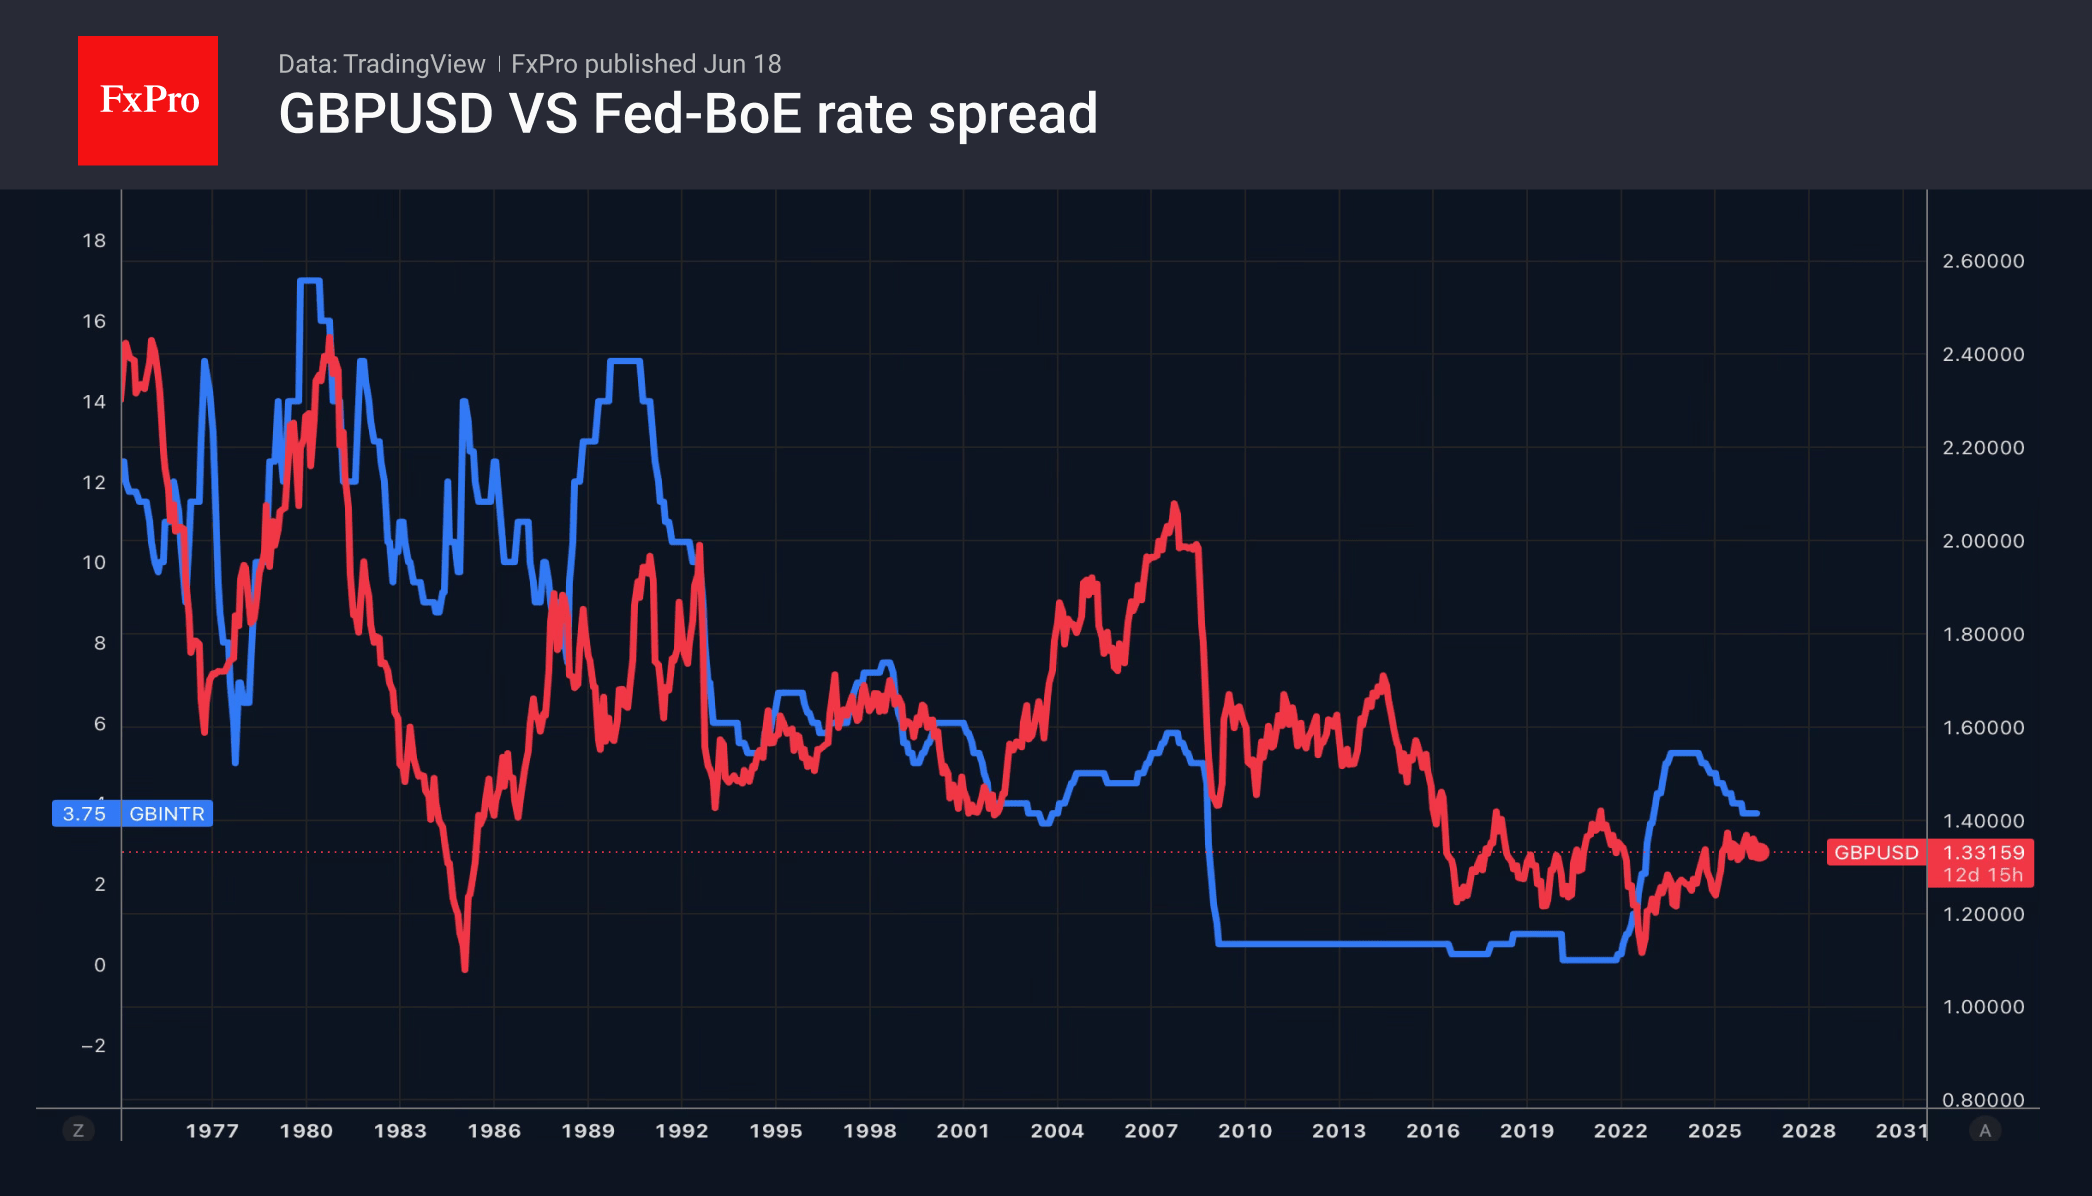
If the Fed raises rates this year while the Bank of England keeps them on hold, the divergence in monetary policy will push down the GBPUSD exchange rate and accelerate UK inflation. In such circumstances, the best course of action for Andrew Bailey and his colleagues would be to adopt a hawkish tone. The door to a key rate hike should remain open, even if acting on it is by no means necessary.
The FxPro Analyst Team
Dollar Extends Fed-Driven Rally as AI Optimism Fuels Equity Rebound
Dollar strength remains the dominant theme in global markets as investors continue to digest the Federal Reserve's hawkish shift. The greenback extended gains broadly after policymakers effectively endorsed another rate hike this year and left the door open to additional tightening if inflation remains stubborn. Markets are now confronting a realistic scenario in which the Fed raises rates once, or even twice, before year-end. That repricing has provided a powerful tailwind for the Dollar, helping it maintain leadership in the currency markets throughout the week.
Yet unlike previous episodes of aggressive Fed repricing, risk sentiment has proven remarkably resilient. The post-FOMC selloff in US equities already appears to be fading, with futures pointing to a rebound led by technology stocks. Intel surged after US President Donald Trump announced a partnership with Apple to design chips in the United States, helping lift the broader semiconductor sector. Nvidia and Micron Technology also advanced strongly. The recovery is consistent with developments in Asia, where South Korea's Kospi and Japan's Nikkei both climbed to fresh record highs earlier in the day. Investors continue to embrace the AI growth story even as interest rate expectations move higher.
That leaves markets balancing two powerful but competing forces. On one side is a Fed that has become more concerned about inflation persistence and appears willing to tighten policy further if necessary. On the other is an AI-driven investment boom that continues to support equity valuations and broader risk appetite. The result may not be enough to derail the Dollar's rally, but it could make the advance more uneven as capital continues flowing into growth-oriented sectors and equity markets.
Elsewhere, central bank developments offered mixed support for major currencies. Sterling weakened after the Bank of England delivered a hawkish hold that failed to satisfy bulls looking for clearer signals of another rate hike. While Huw Pill and Megan Greene voted for an increase, many economists noted little evidence that the Bank's centrist members are moving toward tighter policy. Some analysts also argue that falling energy prices following the U.S.-Iran agreement reduce the likelihood of a BoE hike later this year, making an extended pause the more likely outcome.
Meanwhile, the Swiss National Bank reinforced its dovish stance after holding rates at 0.00%. SNB Chair Martin Schlegel emphasized that "our readiness to intervene in the FX market is increased" if necessary, adding that a "strong and rapid appreciation of the Swiss franc could endanger price stability in Switzerland." The comments highlighted the contrast between a Fed increasingly focused on inflation persistence and an SNB still more concerned about excessive currency strength.
For the week so far, the Dollar remains the runaway leader among major currencies. Yen is holding second place despite falling to a two-year low against the greenback, reflecting broader strength against other currencies. Aussie ranks third, supported by resilient risk sentiment and AI-related optimism. At the other end of the table, Sterling is the weakest performer as markets question whether the BoE will ultimately follow through with another hike. Kiwi and Loonie round out the bottom three, while Euro and Swiss Franc remain stuck in the middle of the pack.
BoE Holds at 3.75%, But 7-2 Vote Keeps Rate Hike Risk Alive
A 7-2 vote is not a comfortable hold. The Bank of England left rates unchanged, but the split shows a meaningful hawkish faction remains active within the MPC. Read More.
SNB Holds at 0%, Sees Energy-Driven Inflation as Temporary
Higher inflation didn't change the SNB's view. Officials see the recent rise in prices as largely energy-driven and temporary, leaving policy firmly on hold. The SNB's biggest concern isn't inflation. It's the franc. Policymakers left rates at 0% and reiterated their readiness to intervene if Swiss currency strength threatens price stability. Read More.
Gold and Silver Rejected Key Resistance, 4,000 and 60 at Risk If Fed Hikes Twice
Markets are focused on one Fed hike. Precious metals should be watching for two. Six policymakers already project two or more increases, a scenario that could put Gold 4000 and Silver 60 under growing pressure. Read More.
USD/JPY Hits Two-Year High as Hawkish Fed Revives Rate Hike Bets
A hawkish Fed, rising US rate expectations drives USD/JPY higher. The pair is now challenging levels not seen in two years. Warsh's first meeting changed the conversation. A hawkish dot plot, higher inflation projections and an unwillingness to rule out future hikes have reignited expectations for tighter Fed policy. Read More.
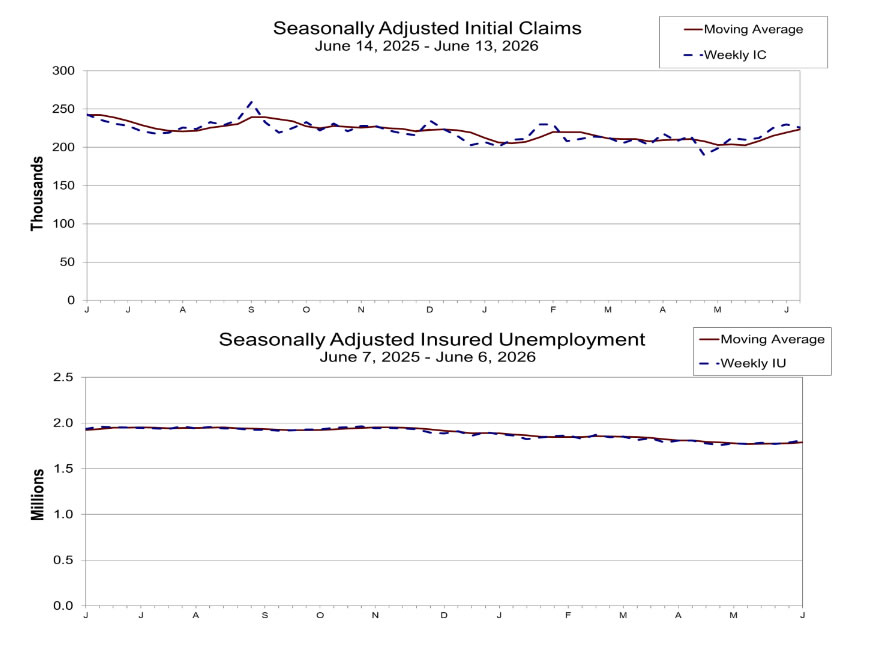
US Initial Jobless Claims Beat Expectations, Continuing Claims Edge Higher
Layoffs remain low, but finding a new job is getting harder. Initial claims fell below expectations, yet continuing claims continued to trend higher, pointing to a slower labor market beneath the surface. Read More.
UK Jobs Growth Stalls as Claimant Count Jumps, Wage Pressures Ease Slightly
The claimant count jumped. The unemployment rate fell. Britain's latest labor market report delivered conflicting signals, leaving policymakers with little reason to change course. Read More.
New Zealand Q1 GDP Meets Forecasts at 0.8% as Manufacturing Drives Growth
New Zealand's recovery is gaining traction. GDP growth accelerated to 0.8% in the first quarter, with manufacturing, business services and wholesale trade driving the expansion. Read More.
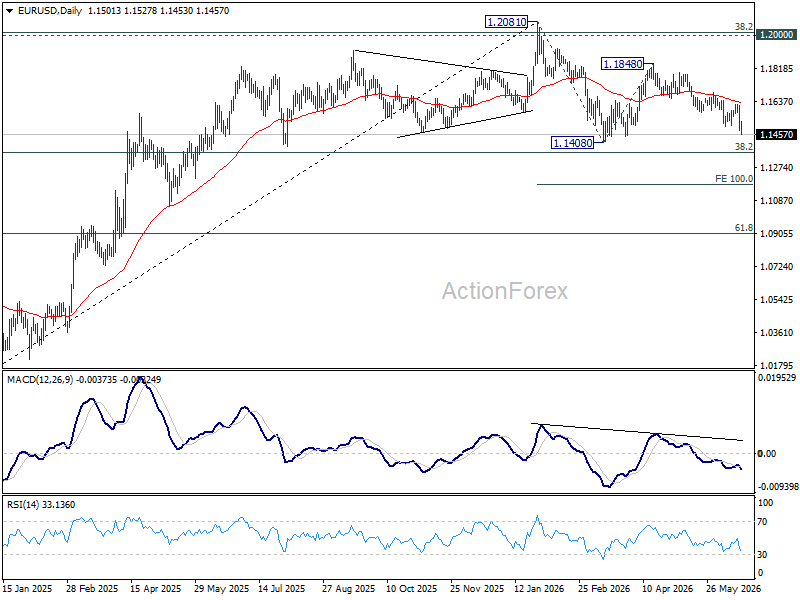
EUR/USD Daily Outlook
Intraday bias in EUR/USD is back on the downside with break of 1.1499 support. Further fall should be seen to retest 1.1408 low. Firm break there will resume whole decline form 1.1408 to 100% projection of 1.2081 to 1.1408 from 1.1848 at 1.1175. On the upside, above 1.15247 minor resistance will turn intraday bias neutral again first. However, outlook will remain mildly bearish as long as 1.1621 resistance holds, in case of recovery.
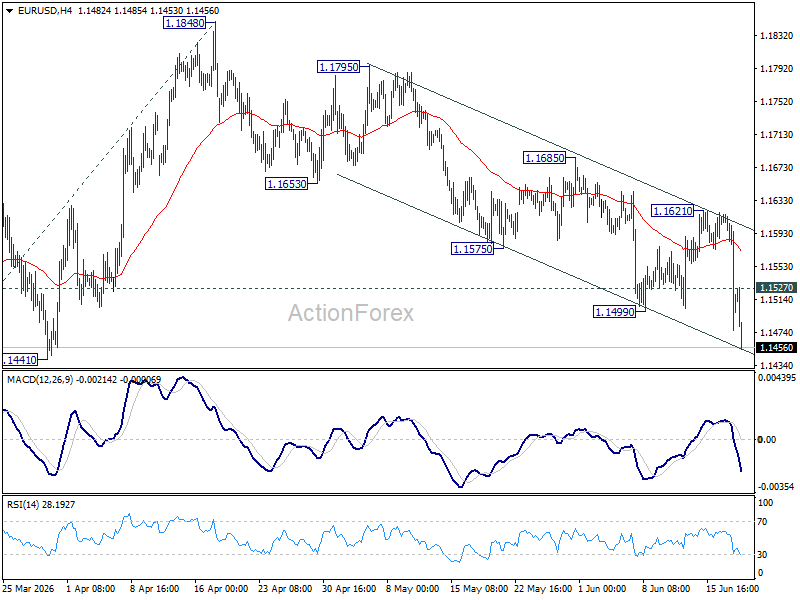
In the bigger picture, the strong support from 38.2% retracement of 1.0176 to 1.2081 at 1.1353 suggests that the pullback from 1.2081 is more likely a corrective move. Strong support was also found in 55 W EMA (now at 1.1547). Focus is back on 1.2 key cluster resistance level. Decisive break there will carry long term bullish implications. Nevertheless, break of 1.1408 support will revive the case of medium term bearish trend reversal.
US Initial Jobless Claims Beat Expectations, Continuing Claims Edge Higher
US initial jobless claims fell by -4k to 226k in the week ending June 13, coming in below expectations of 232k and suggesting layoffs remain relatively subdued. However, the underlying trend was somewhat less encouraging. The four-week moving average of initial claims, which smooths out weekly volatility, rose by 4k to 223.25k.
Meanwhile, continuing claims increased by 24k to 1.810 million in the week ending June 6, with the corresponding four-week average rising by 9.75k to 1.788 million. The increase in continuing claims suggests that while employers are generally reluctant to cut staff, unemployed workers may be taking longer to find new jobs.
EUR/USD Daily Outlook
Intraday bias in EUR/USD is back on the downside with break of 1.1499 support. Further fall should be seen to retest 1.1408 low. Firm break there will resume whole decline form 1.1408 to 100% projection of 1.2081 to 1.1408 from 1.1848 at 1.1175. On the upside, above 1.15247 minor resistance will turn intraday bias neutral again first. However, outlook will remain mildly bearish as long as 1.1621 resistance holds, in case of recovery.
In the bigger picture, the strong support from 38.2% retracement of 1.0176 to 1.2081 at 1.1353 suggests that the pullback from 1.2081 is more likely a corrective move. Strong support was also found in 55 W EMA (now at 1.1547). Focus is back on 1.2 key cluster resistance level. Decisive break there will carry long term bullish implications. Nevertheless, break of 1.1408 support will revive the case of medium term bearish trend reversal.
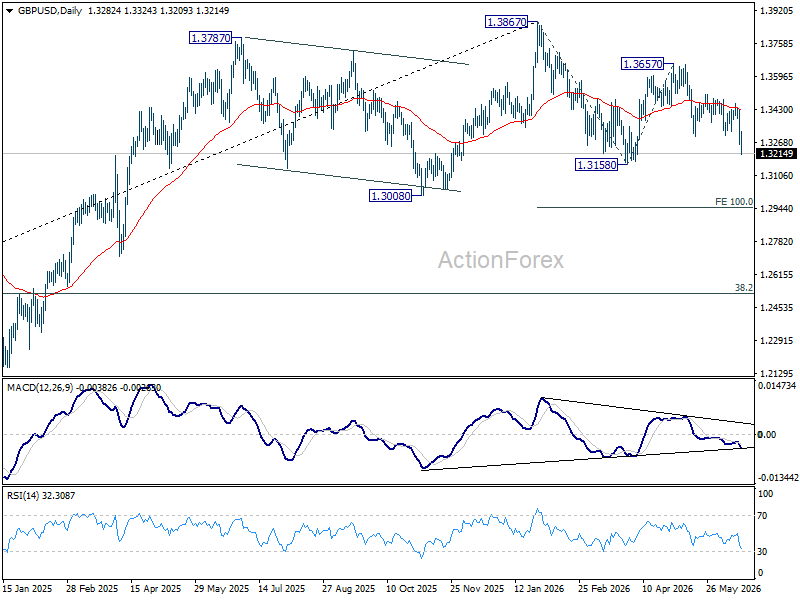
GBP/USD Daily Outlook
Intraday bias in GBP/USD is back on the downside with strong break of 1.3304 support. Further fall should be seen to 1.3158 support first. Decisive break there will extend the whole decline from 1.3867 to 100% projection of 1.3867 to 1.3158 from 1.3657 at 1.2948. On the upside, 1.3324 minor resistance will turn intraday bias neutral first. But outlook will remain mildly bearish as long as 1.3459 resistance holds, in case of recovery.
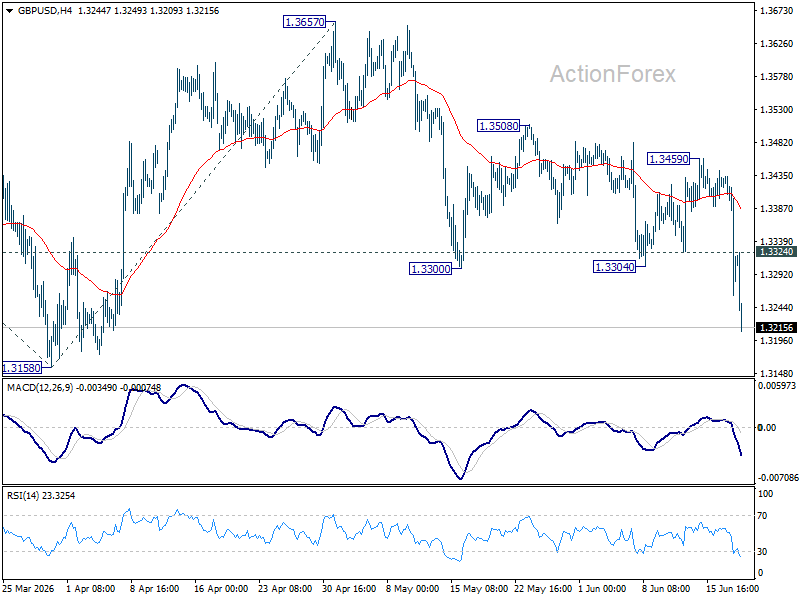
In the bigger picture, price actions from 1.3867 are a corrective pattern within the broader up trend from 1.0351 (2022 low). With 1.3008 support intact, medium term bullishness is maintained and break of 1.3867 is in favor for a later stage, towards 1.4248 key resistance (2021 high). However, firm break of 1.3008 will at least bring deeper fall to 38.2% retracement of 1.0351 to 1.3867 at 1.2524, with increased risk of bearish reversal.
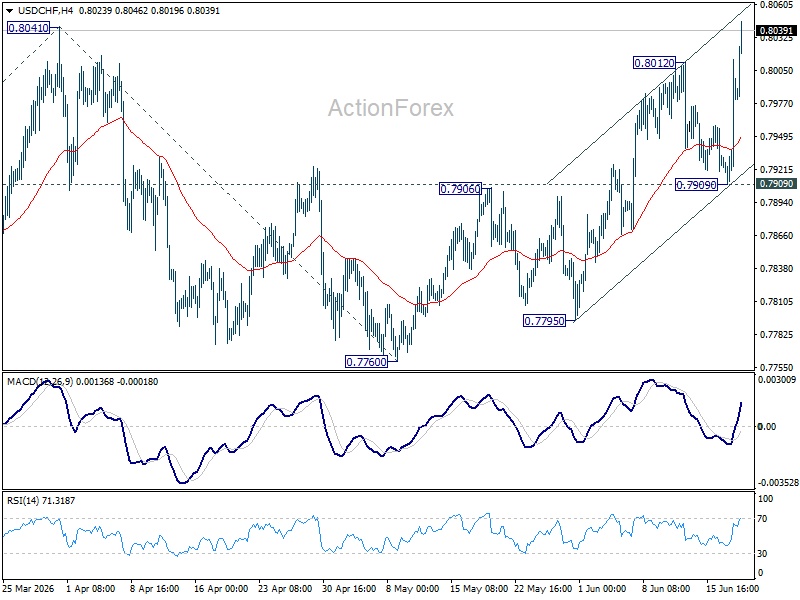
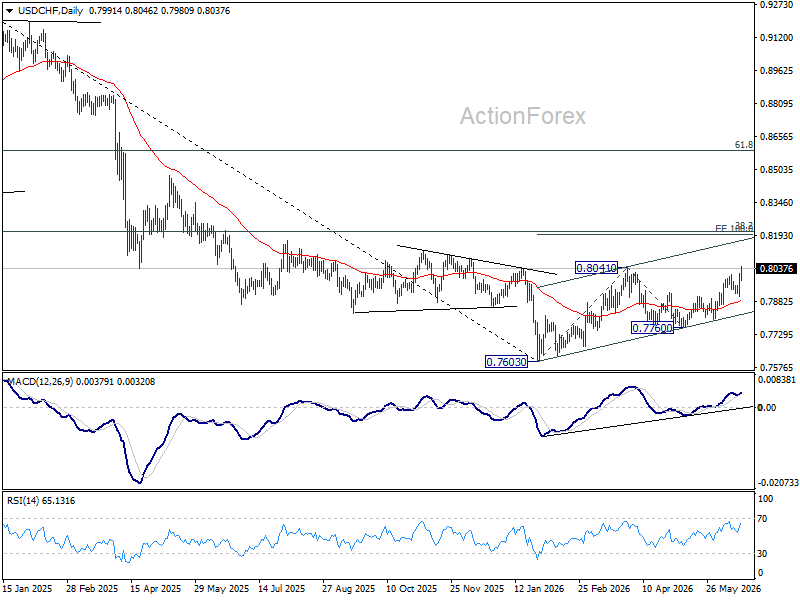
USD/CHF Daily Outlook
Intraday bias in USD/CHF is back on the upside with solid break of 0.8012. Firm break of 0.8041 will resume the rally from 0.7603 and target 100% projection 0.7603 to 0.841 from 0.7600 at 0.8198 next. For now, outlook will stay bullish as long as 0.7909 support holds, in case of retreat.
In the bigger picture, while a medium term bottom was formed at 0.7603, it's still early to call for bullish trend reversal. As long as 38.2% retracement of 0.9200 (2025 high) to 0.7603 at 0.8213 holds, the larger down trend could still continue through 0.7603 at a later stage. However, firm break of 0.7603 will argue that the trend has reversed and turn focus to 0.8332 support turned resistance (2023 low) for confirmation.
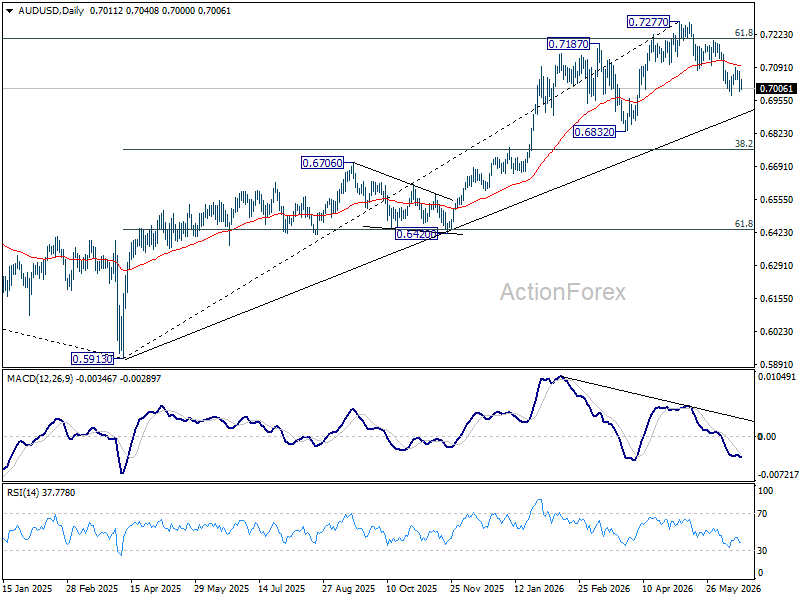
AUD/USD Daily Report
AUD/USD is staying in range of 0.6977/7087 and intraday bias remains neutral. On the downside, break of 0.6977 will resume the fall from 0.7277 towards 0.6832 support. On the upside, break of 0.7087 will bring stronger rebound to 0.7200 resistance.
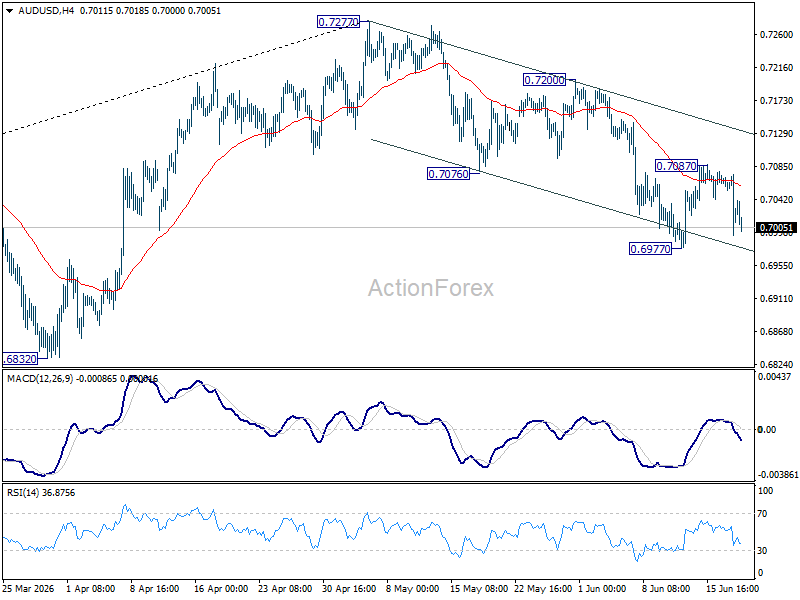
In the bigger picture, considering bearish divergence condition in D MACD, a medium term top could be formed at 0.7277 after failing to sustain above 61.8% retracement of 0.8006 (2021 high) to 0.5913 (2024 low) at 0.7206). Deeper fall could be seen to 38.2% retracement of 5913 to 0.7277 at 0.6756 as a correction. But strong support should be seen there to bring rebound. Consolidations would continue below 0.7277 for a while.
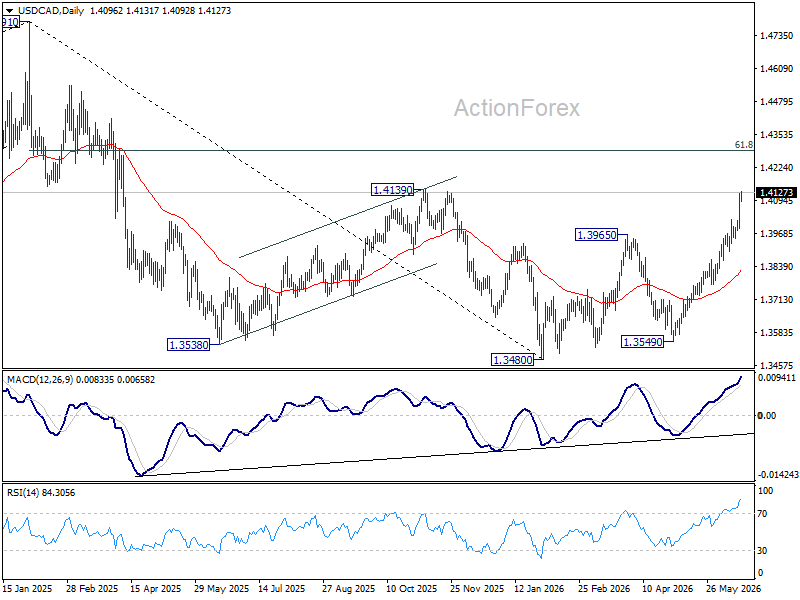
USD/CAD Daily Outlook
USD/CAD's rally resumed after brief consolidation and accelerates higher today. Intraday bias is back on the upside for 61.8% retracement of 1.4791 to 1.3480 at 1.4290 next. On the downside, below 1.4023 minor support will turn intraday bias neutral and bring consolidations first, before staging another rally.
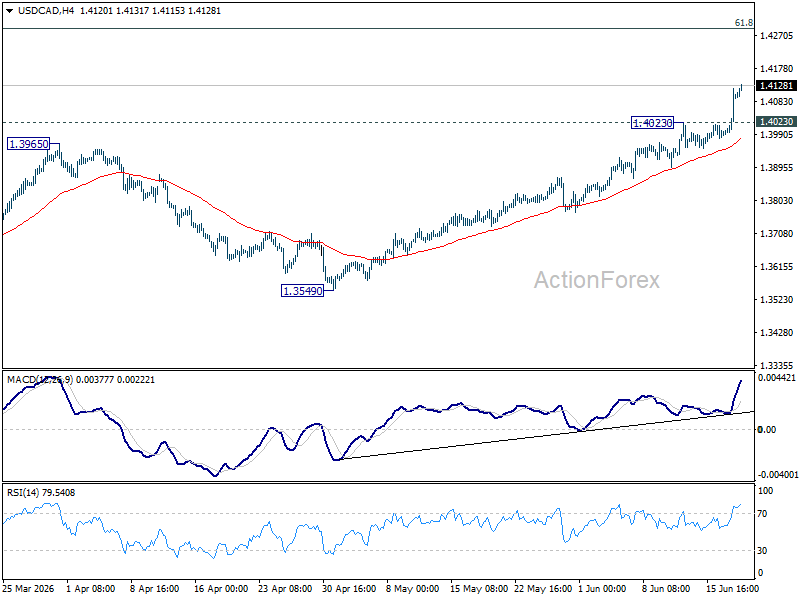
In the bigger picture, current development suggests that fall from 1.4791 has completed as a three wave correction to 1.3480. It's still early to judge if rise from there a corrective bounce, or resumption of the larger up trend from 1.2005 (2021 low). But in either case, retest of 1.4791 high should be seen next.
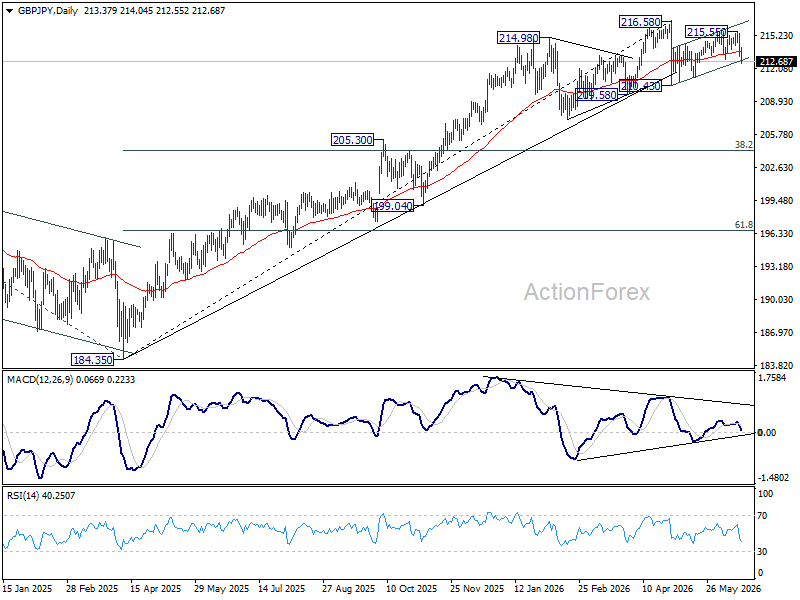
GBP/JPY Daily Outlook
GBP/JPY's steep decline and break of 212.90 support argues that rebound from 210.43 has already completed. Intraday bias is back on the downside for 211.23 support first. Firm break there will target 210.43. On the upside, above 214.04 minor resistance will turn intraday bias neutral again.
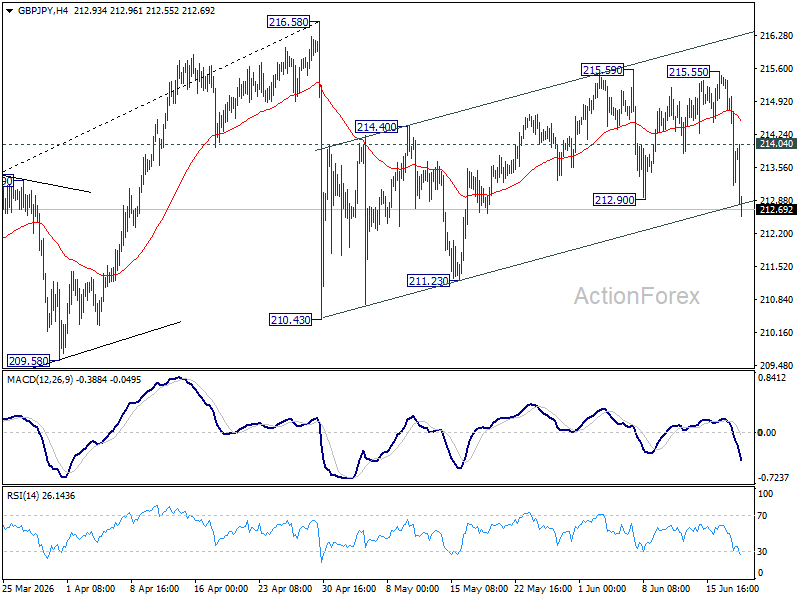
In the bigger picture, there is no clear sign of trend reversal yet. The long term up trend could still extend to 61.8% projection of 148.93 (2022 low) to 208.09 (2024 high) from 184.35 at 220.90 on resumption. However, sustained break of 55 W EMA (now at 207.11) will argue that it's already in medium term down trend for 184.35 support.