
Sample Category Title
First impressions: NZ GDP, March Quarter 2026
The New Zealand economy made a solid start to the year with GDP rising by 0.8% in the March quarter. Revisions to recent history made this a stronger overall result than we were expecting.
Key results
- Quarterly change: +0.8% (last: +0.5%, revised from +0.2%)
- Westpac f/c: +1.0%, market f/c: +0.8%, RBNZ: +1.0%
- Annual change: +1.5% (last: +1.5%, revised from +1.3%)
- Westpac f/c: +1.2%
New Zealand’s GDP rose by a solid 0.8% in the first quarter of 2026. While that was a little less than we had forecast, the net impact of revisions to the recent history make this a stronger overall result than we were expecting.
First, growth in the December quarter was revised up to 0.5% from an initially reported 0.2%. The main reasons were updated information on building work and agricultural output.
Second, there has been some recalculation of the seasonal patterns in the data (an issue that we discussed in our preview and in earlier reports). The result is that March quarters receive less of an uplift than they did previously; without that change, the result would have been closer to our forecast of 1%.
The effects of these revisions are most clearly shown in the annual growth rate, which printed at 1.5% compared to our forecast of 1.2%, despite growth in the March quarter itself coming in lower than our estimate.
The main drivers in the March quarter were much as we expected, with strong gains in manufacturing, wholesale trade, retailing and professional services. Construction activity fell by 1%, but this was less than we expected – residential and non-residential building work fell, but there was a strong lift in non-building construction.
These results were slightly ahead of the RBNZ’s forecasts in its May Monetary Policy Statement (which were in line with our own). While that will carry some kind of weight in the policy committee’s discussions, the focus is more likely to be on the developments since March – what impact the spike in fuel prices has had on activity, what the subsequent pullback in oil prices will mean for the persistence of inflation pressures, and of course whether the peace agreement can reasonably be expected to hold. We’ll be reviewing our forecasts of activity, inflation and interest rates in the next week or so.
Research US: Fed Review: As Committed as Ever
- The Fed maintained its monetary policy unchanged in Kevin Warsh's inaugural meeting as the new Chair. Warsh did not submit personal projections, but the distribution of other committee views signals a shift to hiking bias.
- The meeting marked a clear step away from traditional forward guidance, but Warsh emphasized a firm focus on bringing inflation back to target. Future of communications and balance sheet policy will be evaluated by separate 'task forces' by year-end.
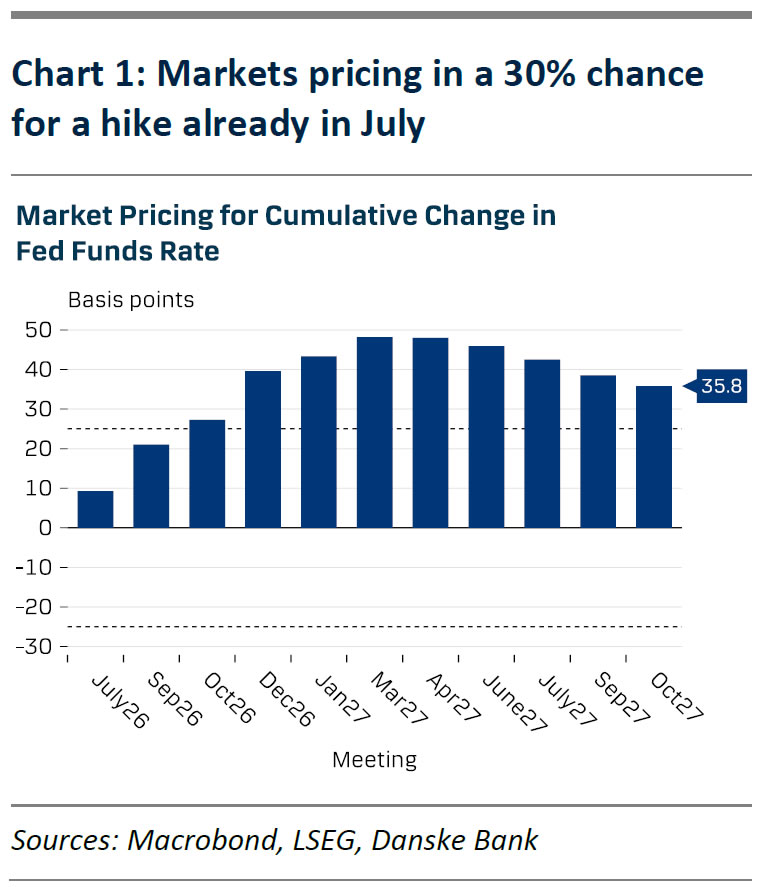
- EUR/USD broke below 1.15, UST yields rose and the curve flattened, as terminal rate pricing shifted 17bp higher. Markets also priced in a more front-loaded risk for a hike, with 8bp priced in by July and 20bp by Sep. We maintain our call for hikes in Dec and March, but see risks skewed towards an earlier start.
- Our recommendations to go long USD vs. SEK and NOK, as well as to pay 2y SOFR-ESTR spread performed well and we continue to like all three cases.
Kevin Warsh set the tone for a new era of forward guidance (or lack thereof) as the Fed published an aggressively shortened statement with focus on only three main messages: policy remained unchanged today, the Fed remains committed to maintaining ample reserves and the committee will deliver price stability.
The final point was in focus during the press conference, as Warsh firmly refrained from speculating about the future, and instead underscored that the Fed's commitment to bringing inflation down to 2%.
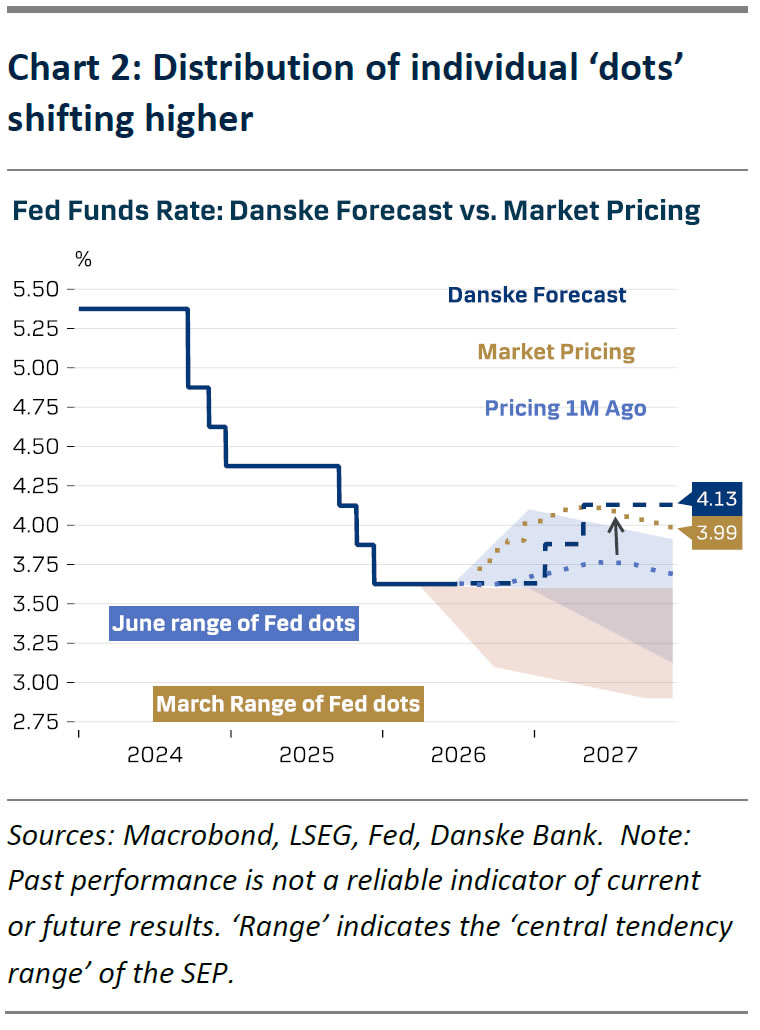
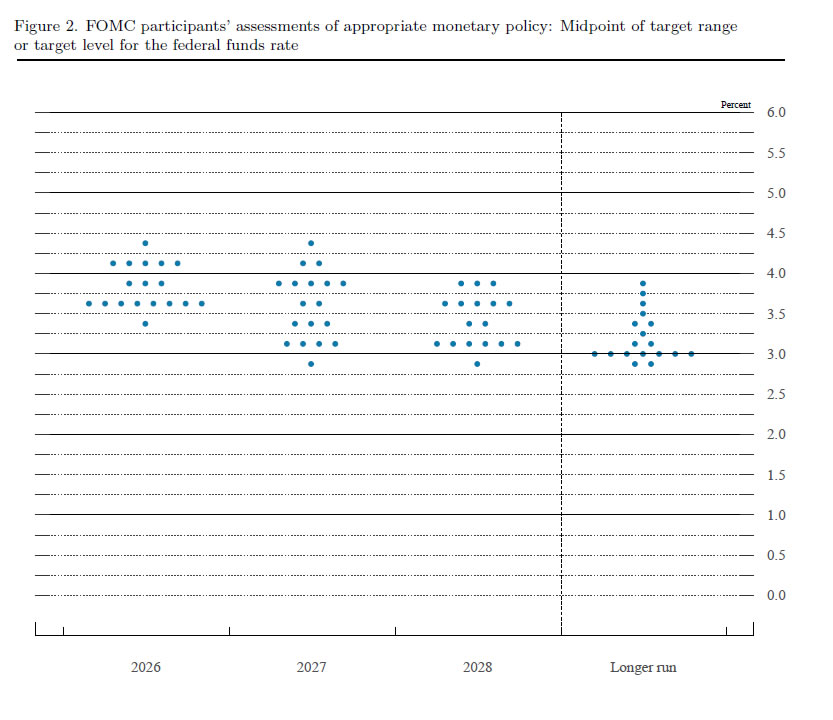
Warsh did not submit his personal 'dots' but encouraged the rest of the committee to continue doing so. The updated rate projections signalled an even clearer shift towards a hiking bias than we envisaged in our Fed preview, 16 June. Only one participant called for a rate cut this year, 8 called for unchanged rates and 9 called for 1-3 hikes. Median dots for 2027 and 2028 were lifted by 50bp and 25bp respectively. GDP and unemployment rate forecasts remained little changed, but inflation forecasts were revised higher (core PCE 3.3% in 2026, from 2.7%) - in line with our expectations. The committee saw risks surrounding the GDP and labour market outlooks as balanced (prev. skewed towards weaker conditions), 17/18 participants saw core inflation risks skewed to the topside, also in line with our expectations.
Warsh did not specify whether FOMC will continue submitting 'dot plots' going forward. Instead, he announced five 'task forces', which will evaluate the central banks' communications, balance sheet policies, data sources, productivity and the inflation framework going forward. Timeline for changes is by year-end.
We maintain our forecast for two Fed hikes over the next year, in December and March. We see risks skewed towards an earlier start to the hikes, potentially in September, if macro data continues to come out stronger than expected. We expect the Fed to continue expanding its balance sheet with reserve management purchases of T-bills at a monthly pace of roughly USD10bn in the foreseeable future.
Market Reaction
UST yields shifted higher and the curve flattened, as markets' terminal rate pricing rose by 17bp. Markets now price in nearly two full hikes for the coming year. The hike expectations were also front-loaded noticeably, as markets now price in 8bp already for July and cumulative 20bp by September. Our recommendation to pay 2y SOFR-ESTR spread is 18bp in the money. We continue to like the case structurally, but think the tactical potential is starting to look exhausted from risk-reward perspective.
In the long-end of the curve, expectation of tighter policy stance drove breakeven inflation expectations lower. Tighter financial conditions are set to weigh on growth, which helps explain the decline in equities and underperformance of cyclical FX. EUR/USD broke below 1.15, and we maintain our below-consensus 12M forecast at 1.12. Our trade recommendations to go long USD vs. both SEK and NOK performed well, and we still like both cases looking ahead. We have introduced a trailing stop-profit for the long USD/NOK trade to protect profit.
Warsh’s Debut as Fed Chair UShers in a Hawkish Hold
- The Federal Open Market Committee (FOMC) held the policy rate steady at the target range of 3.5%-3.75% for a fourth consecutive meeting. The move was fully expected by market participants.
- The post-meeting statement was significantly pared down relative to the April release. Economic growth is still characterized as expanding at a "solid" pace despite elevated uncertainty. Job gains were seen as largely keeping pace with labor force growth – helping to hold the unemployment rate steady – while inflation is still seen as "elevated".
- Forward guidance, which had previously included an easing bias, was removed from the statement.
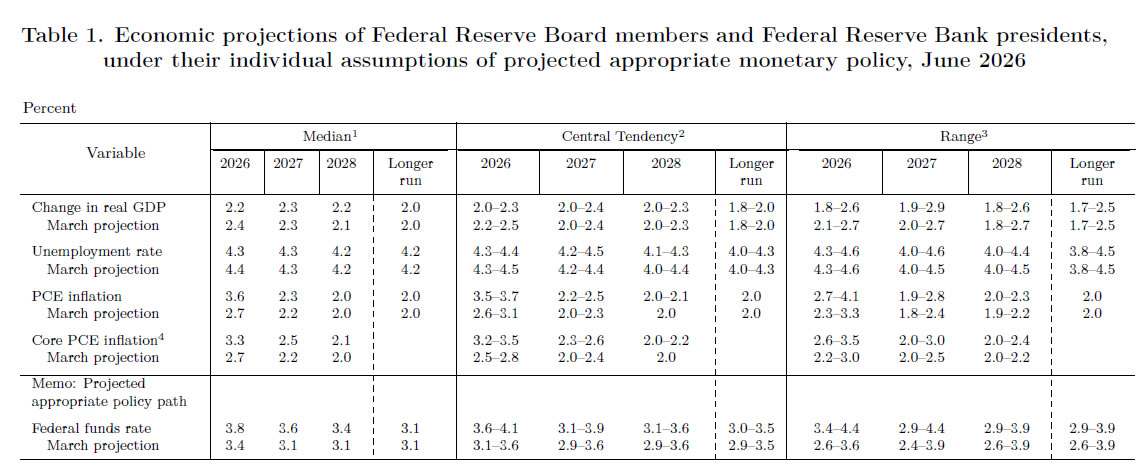
- The FOMC also released a revised set of economic forecasts, known as the "Summary of Economic Projections" (SEP). The SEP represents the median of the individual forecasts submitted by each of the FOMC participants. Relative to the March update:
- The median projection for real GDP growth – as measured on Q4/Q4 basis – was downgraded to 2.2% (previously 2.4%) in 2026 while 2027 was left unchanged at 2.3%. The long-term outlook was maintained at 2.0%.
- The median year-end unemployment forecast for 2026 was nudged lower to 4.3% (previously 4.4%), while 2027 was unchanged at 4.3%.
- Core PCE inflation – the Fed's preferred inflation gauge – was revised higher to 3.3% for 2026 (previously 2.7%) and 2.5% in 2027 (previously 2.2%).
- Lastly, the median projection for the federal funds rate was raised to 3.8% (previously 3.4%) for 2026 – suggesting the potential for a rate hike later this year. This is followed by 25 bps of easing in 2027 and 2028.
- All twelve FOMC members voted in favor of today's decision and the move to a shorter statement.
Key Implications
- The FOMC stuck a more hawkish tone under Kevin Warsh's debut appearance as the new Fed chair. The committee elected to drop its easing bias and raised its median forecast on the fed funds rate, with the median "dot" now suggesting the Fed's next move could be a hike. That said, there's quite a lot of dispersion within the dots. Nine participants still see the policy rate unchanged (or lower) by year-end, while six participants expect two or more hikes. It's also worth noting that Chair Warsh likely did not submit an interest rate forecast, which didn't come as a surprise given his past criticisms of the dot plot and questioning its efficacy as a communication tool.
- All eyes now turn to the press conference (scheduled for 2:30 EST), where Warsh will undoubtedly face a litany of questions regarding his vision for the Fed, whether he plans to hold a press conference after each meeting, and his plan to shrink the Fed's $6.8 trillion of bond holdings. But most importantly, market participants will be looking for any indications of whether Warsh pushes back on the more hawkish assessment. Treasury yields rose sharply following the release, while Fed futures are now pricing in 30bps of rate hikes by year-end (up from +20bps prior to the release).
WTI Crude Oil May Struggle to Recover as Sellers Stay Active
Key Highlights
- WTI Crude Oil declined heavily below $88 and $85.
- A major bearish trend line is forming with resistance at $89.50 on the 4-hour chart of XTI/USD.
- Gold could extend gains if it settles above $4,400.
- Bitcoin started a consolidation phase below the $67,500 resistance.
WTI Crude Oil Price Technical Analysis
WTI Crude Oil prices declined heavily below $85 and $82 against the US Dollar. The price even dipped below $80 before the bulls stepped in.
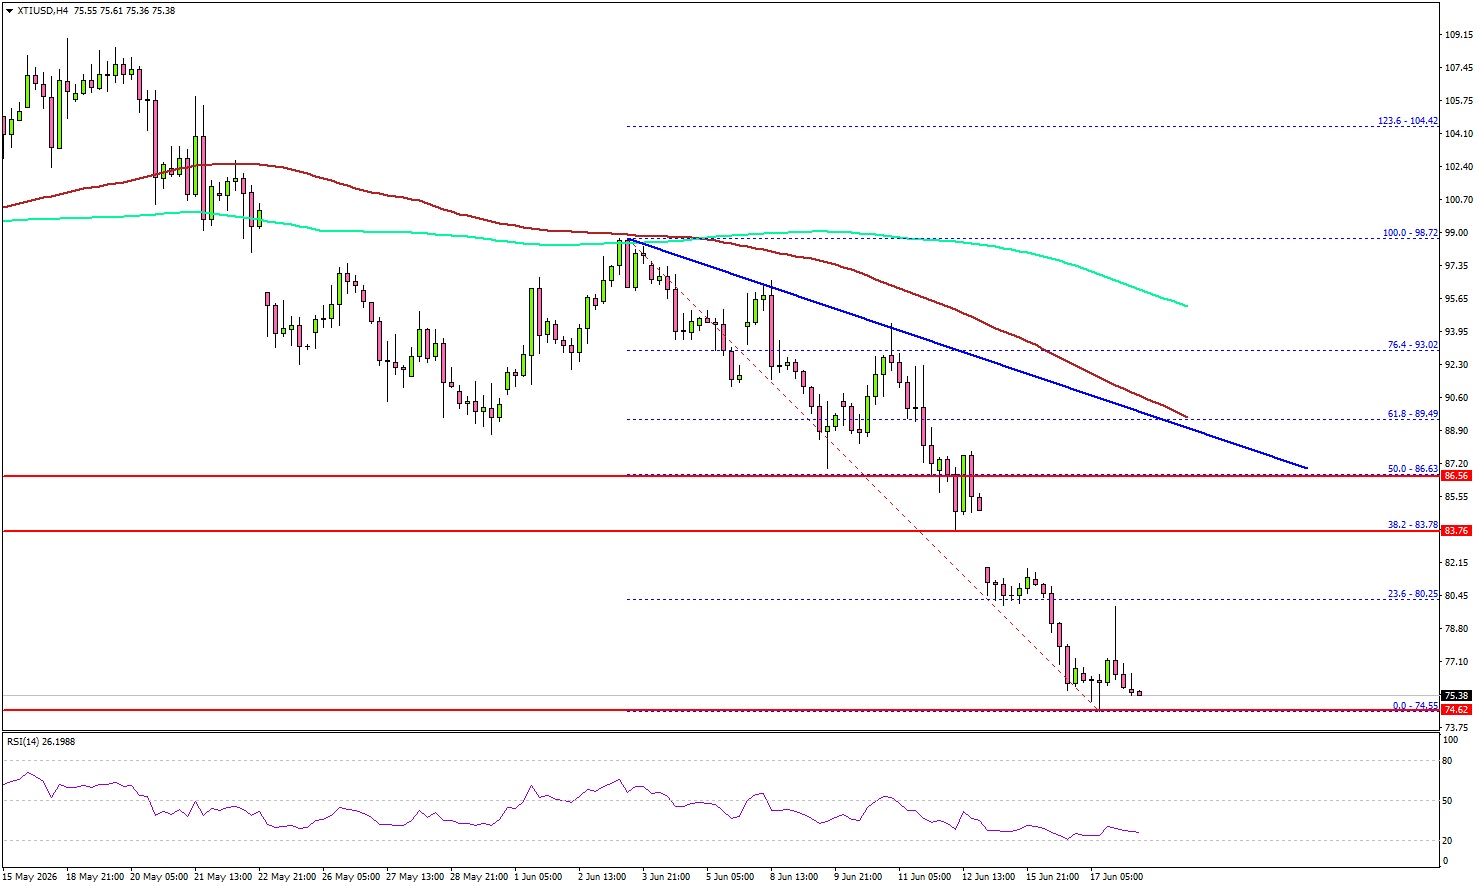
Looking at the 4-hour chart of XTI/USD, the price traded as low as $74.55. It settled below $80, the 100 simple moving average (red, 4-hour), and the 200 simple moving average (green, 4-hour). If there is a recovery wave, the price could face resistance near the 23.6% Fib retracement level of the downward move from the $98.72 swing high to the $74.55 low at $80.25.
The first key hurdle for the bulls could be $83.60. The next resistance might be near the 50% Fib retracement level at $86.60. The main resistance sits near $90.00 and the 100 simple moving average (red, 4-hour).
There is also a major bearish trend line forming with resistance at $89.50. A close above $90 might send Oil prices toward $95. Any more gains might call for a test of $100 in the near term.
On the downside, the first major support sits near the $74.50 zone. The next support could be $72.50, below which the price could dive and test $70.00. A daily close below $70.00 could open the doors for a larger decline. In the stated case, the bears might aim for a drop toward $65.00.
Looking at Gold, the bears are still active below the key resistance at $4,400. The main support sits at $4,250.
Economic Releases to Watch Today
- US Initial Jobless Claims - Forecast 225K, versus 229K previous.
- Philadelphia Fed Manufacturing Survey for June 2026 – Forecast 10.0, versus -0.4 previous.
Eco Data 6/18/26
| GMT | Ccy | Events | Act | Cons | Prev | Rev |
|---|---|---|---|---|---|---|
| 22:45 | NZD | GDP Q/Q Q1 | 0.80% | 0.80% | 0.20% | |
| 06:00 | GBP | Claimant Count Change May | 31.2K | 25.8K | 26.5K | 8.3K |
| 06:00 | GBP | Unemployment Rate Apr | 4.90% | 5.00% | 5.00% | |
| 06:00 | GBP | Average Earnings Including Bonus 3M/Y Apr | 4.40% | 4.00% | 4.10% | 4.40% |
| 06:00 | GBP | Average Earnings Excluding Bonus 3M/Y Apr | 3.40% | 3.30% | 3.40% | |
| 07:00 | CHF | SECO Economic Forecasts | ||||
| 07:30 | CHF | SNB Interest Rate Decision | 0.00% | 0.00% | 0.00% | |
| 08:00 | EUR | Eurozone Current Account (EUR) Apr | 15.7B | 18.5B | 14.9B | |
| 11:00 | GBP | BoE Interest Rate Decision | 3.75% | 3.75% | 3.75% | |
| 11:00 | GBP | MPC Official Bank Rate Votes | 2--0--7 | 1--0--8 | 1--0--8 | |
| 12:30 | CAD | Raw Material Price Index May | 0.70% | 1.80% | 2.60% | |
| 12:30 | CAD | Industrial Product Price M/M May | 1.20% | 1.40% | 2.00% | |
| 12:30 | USD | Initial Jobless Claims (Jun 12) | 226K | 232K | 229K | 230K |
| 12:30 | USD | Philadelphia Fed Manufacturing Jun | 10.3 | 10 | -0.4 | |
| 14:30 | USD | Natural Gas Storage (Jun 12) | 73B | 72.5B | 108B |
| 22:45 | NZD |
| GDP Q/Q Q1 | |
| Actual | 0.80% |
| Consensus | 0.80% |
| Previous | 0.20% |
| 06:00 | GBP |
| Claimant Count Change May | |
| Actual | 31.2K |
| Consensus | 25.8K |
| Previous | 26.5K |
| Revised | 8.3K |
| 06:00 | GBP |
| Unemployment Rate Apr | |
| Actual | 4.90% |
| Consensus | 5.00% |
| Previous | 5.00% |
| 06:00 | GBP |
| Average Earnings Including Bonus 3M/Y Apr | |
| Actual | 4.40% |
| Consensus | 4.00% |
| Previous | 4.10% |
| Revised | 4.40% |
| 06:00 | GBP |
| Average Earnings Excluding Bonus 3M/Y Apr | |
| Actual | 3.40% |
| Consensus | 3.30% |
| Previous | 3.40% |
| 07:00 | CHF |
| SECO Economic Forecasts | |
| Actual | |
| Consensus | |
| Previous | |
| 07:30 | CHF |
| SNB Interest Rate Decision | |
| Actual | 0.00% |
| Consensus | 0.00% |
| Previous | 0.00% |
| 08:00 | EUR |
| Eurozone Current Account (EUR) Apr | |
| Actual | 15.7B |
| Consensus | 18.5B |
| Previous | 14.9B |
| 11:00 | GBP |
| BoE Interest Rate Decision | |
| Actual | 3.75% |
| Consensus | 3.75% |
| Previous | 3.75% |
| 11:00 | GBP |
| MPC Official Bank Rate Votes | |
| Actual | 2--0--7 |
| Consensus | 1--0--8 |
| Previous | 1--0--8 |
| 12:30 | CAD |
| Raw Material Price Index May | |
| Actual | 0.70% |
| Consensus | 1.80% |
| Previous | 2.60% |
| 12:30 | CAD |
| Industrial Product Price M/M May | |
| Actual | 1.20% |
| Consensus | 1.40% |
| Previous | 2.00% |
| 12:30 | USD |
| Initial Jobless Claims (Jun 12) | |
| Actual | 226K |
| Consensus | 232K |
| Previous | 229K |
| Revised | 230K |
| 12:30 | USD |
| Philadelphia Fed Manufacturing Jun | |
| Actual | 10.3 |
| Consensus | 10 |
| Previous | -0.4 |
| 14:30 | USD |
| Natural Gas Storage (Jun 12) | |
| Actual | 73B |
| Consensus | 72.5B |
| Previous | 108B |
Fed Holds Steady but Dot Plot Turns Hawkish as Officials Signal Rate Hike Ahead
The Federal Reserve left its benchmark interest rate unchanged at 3.50-3.75% as widely expected, but the updated projections delivered a distinctly hawkish message. In a notably shorter post-meeting statement, policymakers acknowledged that economic activity continues to expand at a solid pace despite elevated uncertainty stemming partly from the Middle East conflict. The Fed highlighted strong productivity growth and capital investment, while noting that labor market conditions remain stable with job gains keeping pace with workforce growth.
The statement also underscored the Fed's ongoing concern over inflation. Officials acknowledged that supply shocks, particularly in energy-related sectors, have continued to fuel price pressures and reiterated their commitment to restoring price stability. The notably streamlined statement was also consistent with new Fed Chair Kevin Warsh's preference for more concise communication, signaling a shift toward saying less while allowing policy projections to carry more of the message.
That message was reinforced by the updated Summary of Economic Projections. The median federal funds rate forecast was revised higher, with policymakers now expecting rates to end 2026 at 3.8%, compared with 3.4% previously. The projected path for rates was also lifted for 2027 and 2028, indicating a slower pace of eventual policy normalization.
The accompanying dot plot revealed a committee leaning firmly toward additional tightening, with nine officials anticipating at least one rate hike this year, eight expecting rates to remain unchanged, and only one projecting a rate cut.
While the Fed modestly lowered its 2026 GDP growth forecast to 2.2% from 2.4%, officials simultaneously revised core inflation projections significantly higher. Core PCE inflation is now expected at 3.3% in 2026 and 2.5% in 2027, both notably above prior forecasts. Although headline PCE inflation projections edged slightly lower for 2026, the persistence of underlying price pressures appears to have outweighed growth concerns.
Taken together, the updated forecasts signal that the Fed is willing to tolerate somewhat slower growth in exchange for ensuring inflation pressures do not become entrenched, reinforcing expectations that rates could be raised.
(FED) Federal Reserve Issues FOMC Statement
The Federal Open Market Committee approved the following statement for release by a 12 – 0 vote:
The Committee decided to maintain the target range for the federal funds rate at 3-1/2 to 3-3/4 percent, in support of the Federal Reserve's dual mandate. The Committee reaffirmed its policy of maintaining ample reserves in the banking system.
Economic activity is expanding at a solid pace despite elevated uncertainty that owes, in part, to the conflict in the Middle East. Productivity growth and capital investment are strong. Job gains have kept pace with the workforce, and the unemployment rate has changed little.
Inflation remains elevated relative to the Committee's 2 percent goal, in part reflecting supply shocks that have driven price increases in certain sectors, including energy. The Committee will deliver price stability.
UK Inflation Remains Unchanged in May, Ahead of BoE’s Policy Meeting
Inflation in Great Britain remained unchanged at 2.8% in May, against expectations for 3% rise, while core inflation, which excludes volatile food, energy, alcohol and tobacco components, rose slightly less than expected to 2.6% from 2.5% in April.
Annualized inflation was unchanged at the lowest in over one year, hit in April, and slightly eased expectations for a rate hike later this year.
Lower prices for domestic heating oil, meat, vegetables and dairy products were behind better than expected May’s figures that helped to partially offset negative impact from jump in airfares and fuel prices.
Inflation in the UK has been above the 2% target for most of the past five years, with BoE’s projections to rise above 3.5% by the end of the year and potentially exceed 6% early next year, in the worst scenario.
Services price inflation, the BoE gauge for underlying price pressures – rose to 3.7% in May from 3.2% in April, which made a large contribution to 10.3% monthly jump in airfares.
May’s data, although slightly better than expected, add to BoE’s stance of continued cautious approach to the monetary policy, even though that the latest potential peace deal between US and Iran, which would result in in reopening the Strait of Hormuz, sparks fresh optimism.
The BoE’s MPC will meet on Thursday and is widely expected to keep interest rates unchanged at 3.75%, with main narrative that the BoE has time to wait to assess the impact of the conflict, before deciding to start raising interest rates.
On the other hand, some policymakers worry businesses will use that time to raise prices more broadly, that could add tailwinds to consumer prices and dent consumer confidence, as Britain has been the most affected from the Western countries by the war in the Middle East, due to its reliance on imported natural gas, which was reflected by 8.7% annual rise in raw material costs for May, the biggest since February 2023.
Brent Oil – Bears May Take a Breather Above 200Dma
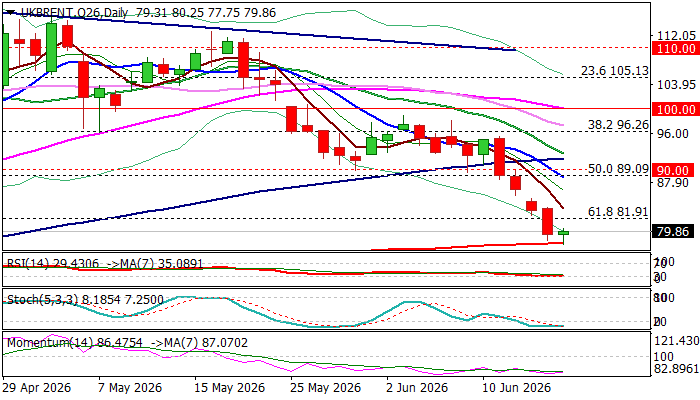
Brent fell over 15% in past four days, after the story about US-Iran peace agreement gained momentum, and neared levels it traded at the beginning of war.
Growing optimism that the conflict may end soon and prevent disastrous scenario for the global energy market on prolonged closure of Hormuz strait, increased pressure on oil prices (although without any detailed peace plan on the table but memorandum of understanding, signing which would open way for negotiations and standard swings in Trump’s narrative, ranging from the end of the war to fresh bombing campaigns).
Fresh drop on Tuesday (oil price was down 5% for the day) and today’s attempt to extend weakness further, were repeatedly contained by 200DMA ($77.86).
Bears are likely to take a breather here, due to significance of support and due to oversold daily studies, which generate signal for profit taking.
Bearish daily studies support scenario of limited correction – positioning for fresh push lower, additionally supported by the latest predictions of International Energy Agency about significant supply excess that oil markets are expected to face in 2027, accompanied by forecasts for disproportionally lower global demand (8 mln bpd supply vs 2 mln bpd demand).
Broken Fibo 61.8% ($81.91) marks initial resistance, followed by $85.29 (Monday’s high, posted after gap-lower weekly opening), guarding former strong supports, now acting as solid barriers at $89.00/$90.00 (broken 50% retracement of $58.70/$119.47, reinforced by falling 10DMA / psychological) where extended upticks should be capped to mark a healthy correction before larger bears regain control.
Sustained break of 200DMA to expose initial target at $73.04 (Fibo 76.4%) and unmask psychological $70 support.
Res: 81.91; 83.75; 85.29; 86.50
Sup: 77.86; 75.76; 73.04; 70.00
U.S. Retail Sales Post a Solid Gain in May, and Not Just Due to Higher Prices
- Retail and food services sales rose 0.9% month-over-month (m/m) in May, ahead of consensus expectations for a 0.5% gain. Higher prices were once again part of the story but not all of it, with inflation-adjusted retail and food services sales up 0.4% m/m.
- Nominal sales at gasoline stations rose 3.4% m/m due to higher prices at the pump. Sales of autos and parts also posted a sizeable gain (+1.2% m/m), reversing a decline the prior month, while sales at building materials and garden retailers were flat.
- Looking at the “control group”—which excludes volatile sales of gasoline, autos and parts, and building materials and garden equipment—sales posted a solid 0.7% m/m gain, also ahead of expectations. There were notable gains at miscellaneous store retailers (+2.3% m/m), furniture and home furnishings stores (+1.0% m/m), and health and personal care stores (+0.6% m/m). However, sales were flat at food and beverage stores and edged lower at electronics and appliance stores (-0.5%), although the decline followed seven consecutive months of gains. Gains were modest elsewhere. Sales at non-store retailers, mostly online sales, posted another solid monthly increase (+1.5% m/m), and were up 12.2% from a year-ago.
- Spending at bars and restaurants – the only service category included in the report – edged lower by 0.1% m/m in May after a solid gain in April. Zooming out on the longer-trend, spending on dining out is up only 2.7% y/y, down from 6.4% growth in May 2025.
Key Implications
- This was a strong report, with both headline and core sales coming in above expectations. Unlike in April, the gain was not only driven by higher prices, with sales volumes also posting a solid increase in real terms. To be fair, higher gasoline prices remained a factor, but spending also received a meaningful lift from stronger vehicle sales and sizeable gains across several other categories. Even with real disposable income falling — in April, it was 1% lower than a year earlier — and pump prices still elevated, consumers appeared undeterred in May, perhaps dipping further into savings or leaning more heavily on credit cards. That said, some signs of hesitancy remained, including flat sales at food stores and softer spending at bars and restaurants.
- Looking ahead, the worst of the gas price increases appear to be in the rear-view mirror. With gas prices down by roughly 50 cents in June on U.S.-Iran peace progress, households will get some modest reprieve from lower prices at the pump (commentary). The labor market also appears to be showing some signs of strengthening (commentary), while household wealth continues to be supported by rising equity valuations. This should help to sustain consumer spending at around a 2% pace through year-end.