Sample Category Title
Sunset Market Commentary
Markets
The market setup today was broadly similar to yesterday. Despite multiple execution risks surrounding the US-Iran agreement, markets have adjusted positioning to reflect at least some improvement in supply disruptions and a moderation of inflation pressures. Brent crude holding below USD 80/bbl remains a key barometer of that view.
Economic data are still somewhat outdated, reflecting conditions before the agreement was announced, but they help establish the starting point. Final Eurozone CPI data for May delivered a small surprise. Headline inflation was confirmed at 0.1% m/m and 3.2% y/y, while core inflation was revised higher to 2.6% from 2.5%. The revision is not a game changer, but it comes as several ECB policymakers have stressed that, even after the US-Iran agreement, they remain focused on how higher oil and commodity prices are filtering through the broader economy.
ECB member Simkus indicated today that he still leans toward the possibility that an additional rate hike may be needed. Meanwhile, the ECB wage tracker points to wage growth of 2.6% in 2026 compared with 3.0% in 2025. Even so, Eurozone yields appear to have reached a short-term equilibrium, with moves ranging from +1.5 bps at the 2-year tenor to -1.5 bps at the 30-year tenor.
Similar price action is visible in US rates, where yields are moving by less than 2 bps across the curve. US interest-rate markets are now entering the final countdown ahead of the Fed decision and the first press conference from Fed Chair Kevin Warsh. The Fed is widely expected to leave the target range unchanged at 3.50%-3.75%.
After already attracting dissent in April, the policy statement is likely to remove any remaining reference to additional downward adjustments, effectively dropping the easing bias. Strong payroll growth continues to point to economic resilience. May retail sales, with headline sales up 0.9% m/m and the control group up 0.7% m/m, reinforce that message.
At the same time, both headline and core inflation continue to move away from the Fed's 2% target. April PCE inflation stood at 3.8% y/y on the headline measure and 3.3% y/y on the core measure, while May CPI rose to 4.2% y/y headline and 2.9% y/y core. Markets will therefore closely monitor the updated Summary of Economic Projections and the dot plot. These projections may remove the expectation of an additional rate cut this year and in 2027 that was still present in the March forecasts.
It will also be important to gauge Chair Warsh's position. Warsh has expressed skepticism about forward guidance and the dot plot framework. He may also seek changes to Fed communications, including fewer press conferences. Regardless of any future organizational reforms, today's meeting is expected to help establish a floor under US yields. Relatively elevated yields, supported by resilient growth and persistent inflation, could remain supportive for the dollar in the near term.
The dollar has held up well despite the risk-on mood that followed the US-Iran agreement. The DXY Index at 99.65 keeps the 100.00-100.56 resistance zone within reach, while EUR/USD continues to struggle to regain a foothold above 1.1600.
UK inflation data for May delivered a mixed picture. Headline CPI rose 0.2% m/m and remained at 2.8% y/y, below expectations. Core inflation increased to 2.6% y/y from 2.5%, also slightly below consensus. However, services inflation accelerated unexpectedly to 3.7% y/y from 3.2%.
Despite the persistence of services-sector price pressures, today's figures suggest there is no urgency for the Bank of England to abandon its current wait-and-see approach. Gilts outperformed, with yields falling 4-5 bps across the curve. Sterling weakened modestly, with EUR/GBP trading near 0.8650.
News & Views
The Swedish Riksbank left its policy rate unchanged at 1.75%, but acknowledged that the probability of a rate hike later this year has increased compared with its March assessment.
Swedish inflation remains low, partly due to fiscal measures that are dampening price pressures. Economic activity is weaker than normal, with growth undershooting expectations in the first quarter, while the labor-market recovery remains tentative. Given the considerable uncertainty surrounding the outlook, policymakers emphasized the need for vigilance.
The Riksbank lowered its CPIF inflation forecast for 2026 to 1.1% from 1.5%, while raising projections for 2027 to 1.7% from 1.3% and for 2028 to 2.8% from 2.7%. Growth forecasts were revised lower for 2026 and 2027 to 2.2%-2.3% from 2.5%-2.6%, while the 2028 forecast was raised slightly to 1.4% from 1.3%.
Markets reacted calmly to the modest hawkish adjustment. A Riksbank rate hike is only fully priced by early next year. EUR/SEK remains confined within the narrow 10.75-11.00 range that has prevailed since mid-March.
The International Energy Agency (IEA) lowered its global oil demand forecast for 2026 after second-quarter deliveries fell by 5 million barrels per day year-on-year amid higher fuel prices and disruptions to product availability.
Global demand is now expected to decline by 1.1 million barrels per day in 2026 to 103.3 million barrels per day. Global supply is projected to fall by 3.9 million barrels per day to 102.4 million barrels per day. In May, production fell to 94.5 million barrels per day, down 600,000 barrels per day from April and 13.6 million barrels per day below pre-conflict levels.
According to preliminary estimates, global oil inventories have fallen by an average of 3.8 million barrels per day since the start of the conflict, including a substantial draw of 143 million barrels during May alone.
OECD government inventories have fallen by 163 million barrels year-to-date, reaching their lowest level since December 1990 as emergency stock releases accelerated.
The IEA's first assessment of 2027 points to a significant supply overhang. Global oil demand is projected to increase by a relatively modest 2 million barrels per day to 105.3 million barrels per day, while global supply could surge by around 8 million barrels per day to 110 million barrels per day.
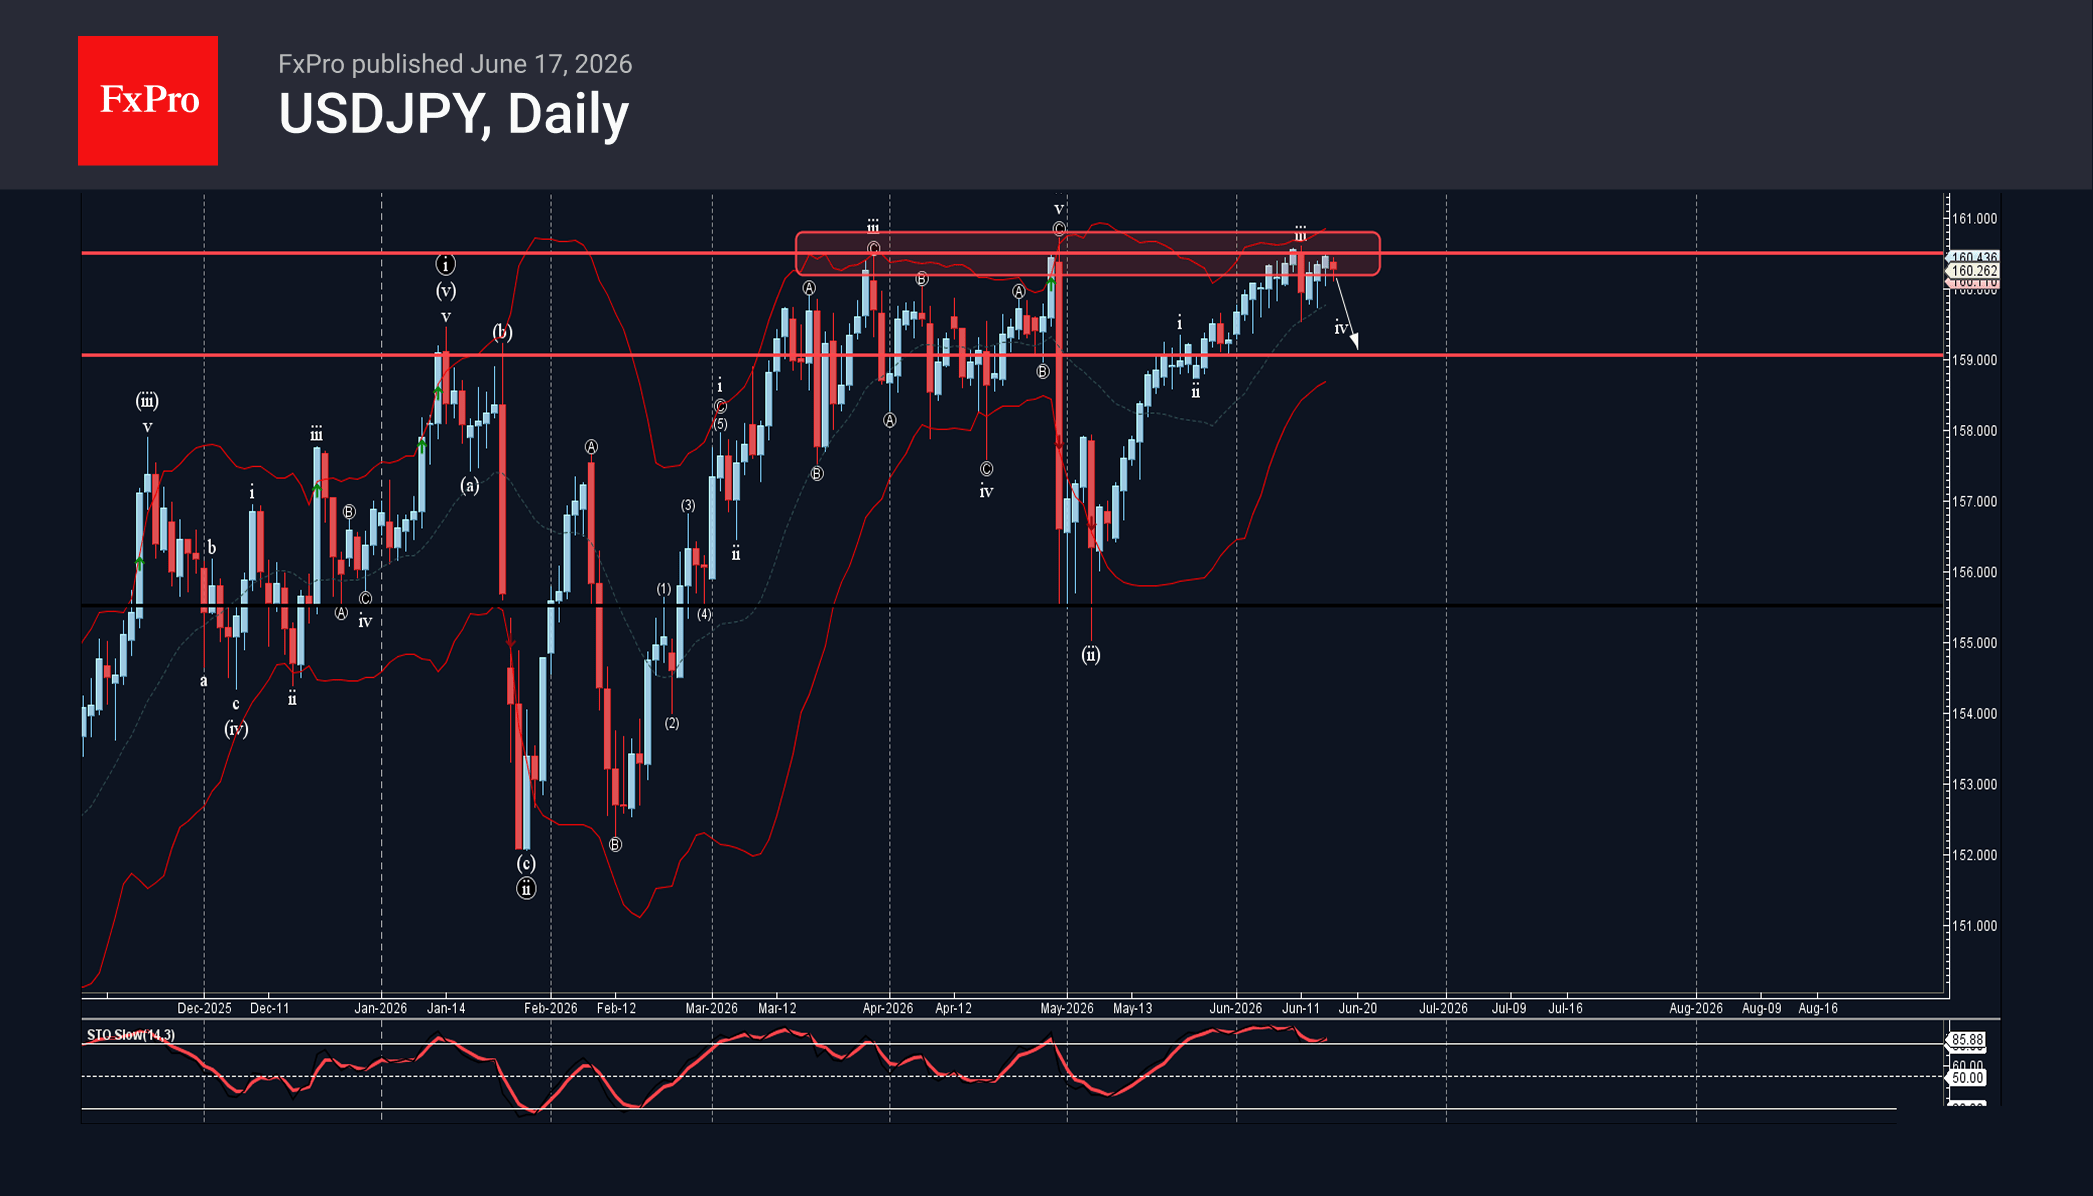
USDJPY Wave Analysis
USDJPY: ⬇️ Sell
– USDJPY reversed from resistance level 160.500
– Likely to fall to support level 159.00
USDJPY currency pair recently reversed down from the resistance zone between the multi-month resistance level 160.500 (can be seen from the daily USDJPY chart below) and the upper daily Bollinger Band.
The downward reversal from this resistance zone started the active short-term correction iv.
Given the strength of the resistance level 160.50 and the overbought daily Stochastic, USDJPY currency pair can be expected to fall to the next support level 159.00.
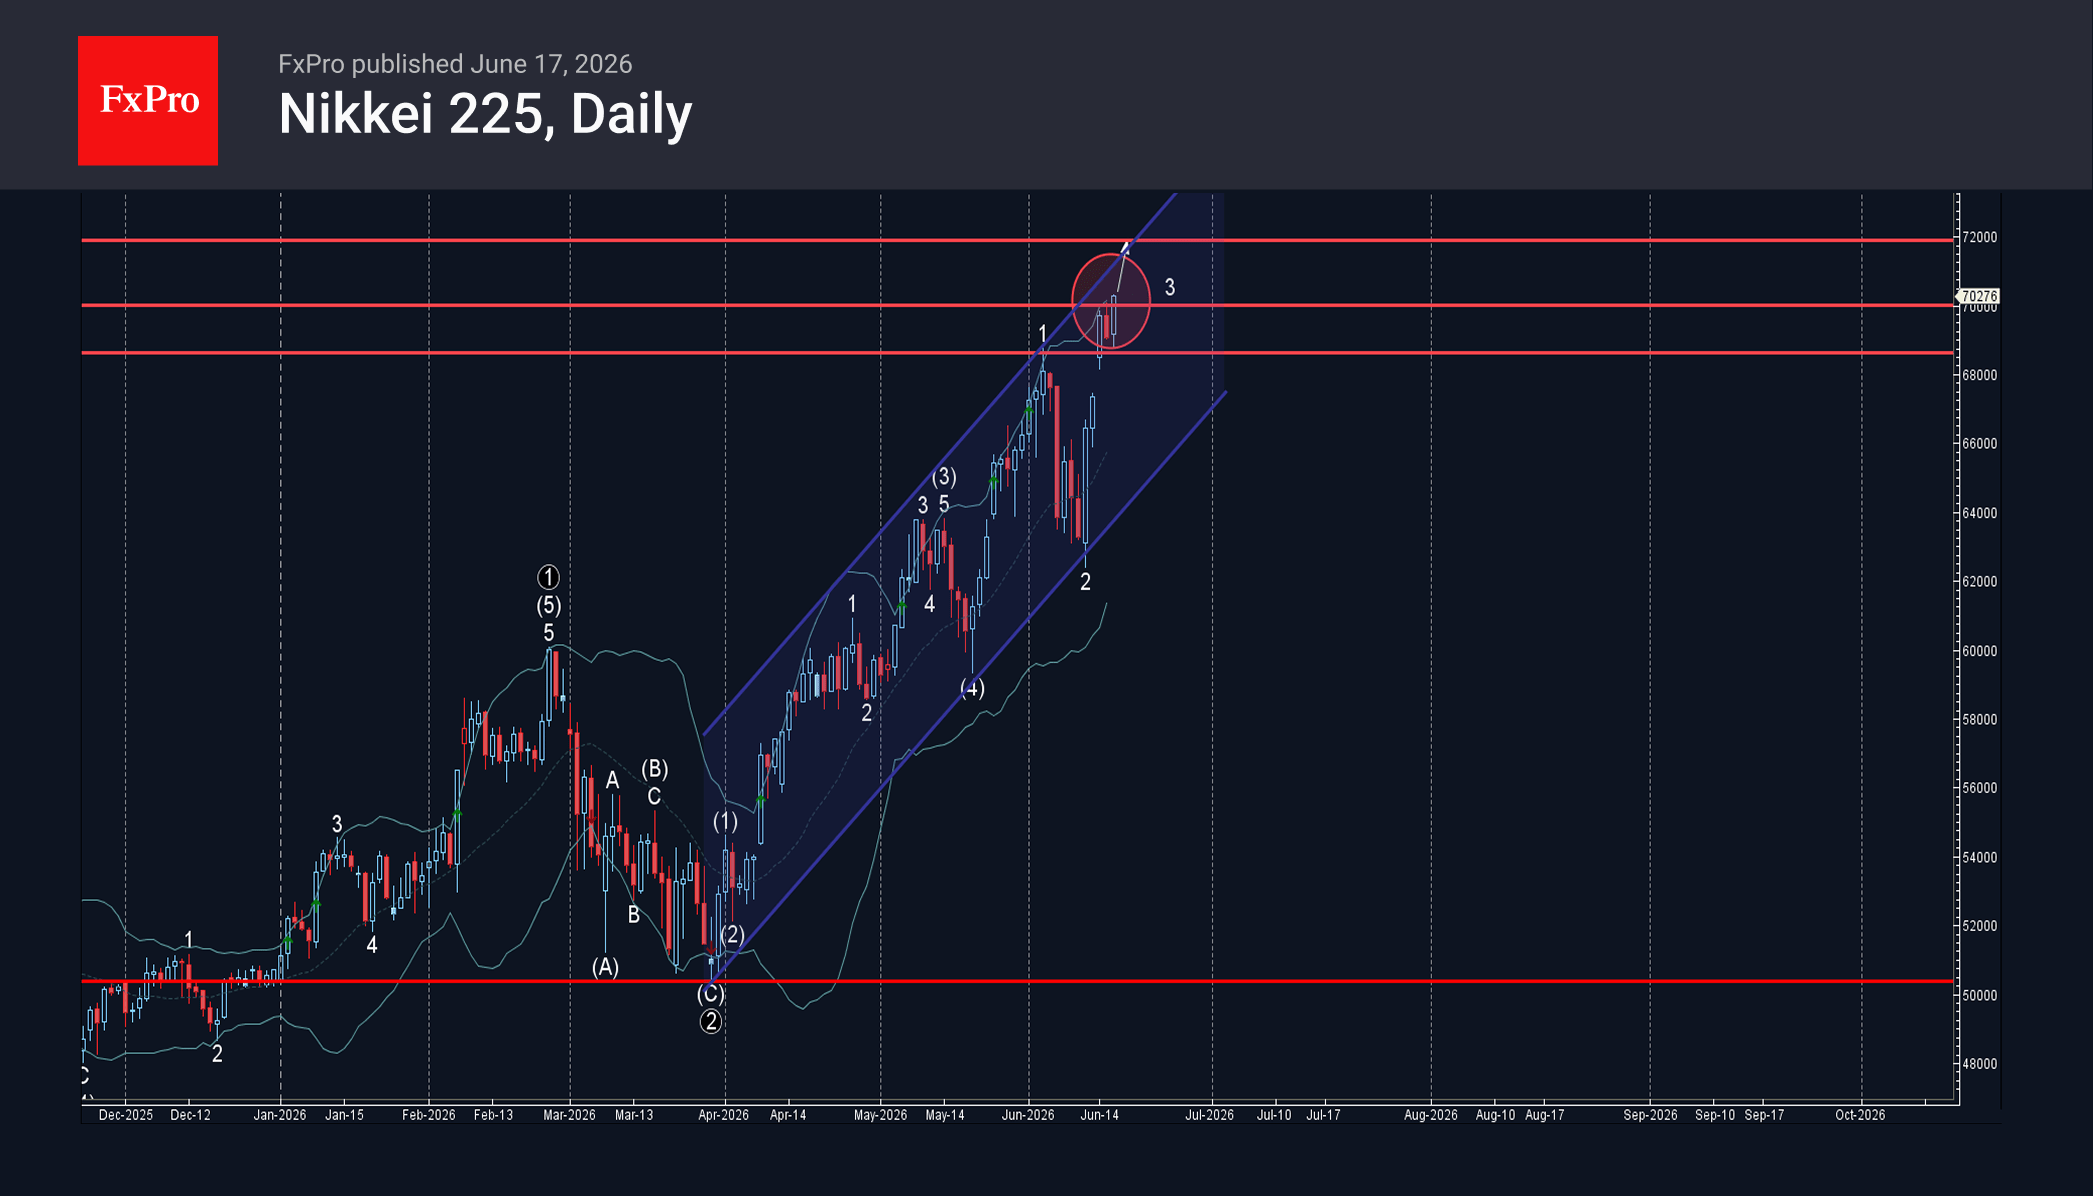
Nikkei 225 Wave Analysis
Nikkei 225: ⬆️ Buy
– Nikkei 225 broke resistance zone
– Likely to rise to resistance level 72000.00
Nikkei 225 index recently broke the resistance zone between the strong resistance level 68615.00 (which stopped the previous sharp impulse wave 1, can be seen from the daily Nikkei 225 chart below) and the round resistance level 70000.00
The breakout of this resistance zone should accelerate the active impulse waves 3 and (5).
Given the clear daily uptrend, Nikkei 225 index can be expected to rise to the next resistance level 72000.00 (target for the completion of the active impulse wave 3).
Fed Day Arrives: Dot Plot Holds the Key as Markets Await Warsh’s Debut
Markets are entering the Federal Reserve decision with remarkably little uncertainty about what policymakers will do, but considerable uncertainty about what they will signal next. The first FOMC meeting under Kevin Warsh as Chair is widely expected to deliver an unchanged federal funds rate at 3.50%-3.75%, with little chance of dissent. Following Stephen Miran's departure from the Committee, there is no obvious constituency for an immediate rate cut, while even the Fed's hawkish members have not signaled that conditions warrant a hike at this stage.
That leaves investors focused on two issues: the updated dot plot and Warsh's first press conference as Chair. Across markets, positioning reflects caution rather than conviction. NASDAQ futures are modestly higher, but S&P 500 and DOW futures are largely unchanged. The 10-year Treasury yield is slightly lower on the day but remains comfortably above 4.43%, while Gold continues to trade in a narrow range around 4300. In currency markets, the Dollar is broadly rangebound against its major peers as traders await a catalyst for a directional breakout.
Several aspects of today's announcement are already largely priced in. The Fed is expected to remove the easing bias from its statement, acknowledging that recent inflation developments have reduced the likelihood that the next policy move will be a cut. Similarly, the median projection in the Summary of Economic Projections is expected to shift from one cut this year, as projected in March, to no change through year-end. Neither development would be particularly surprising given the recent rise in inflation and resilience of economic activity.
The real question is whether the Fed is merely abandoning its easing bias or beginning to contemplate tightening again. The answer lies in the distribution of the dots rather than the median itself. If two or three policymakers project a future rate hike, markets are likely to dismiss those projections as the views of the Committee's traditional hawks. However, if four or more officials place their dots above the current policy range, investors may conclude that the Fed is moving beyond a "higher for longer" framework and beginning to actively discuss the possibility of additional tightening.
The other wild card is Kevin Warsh himself. Investors want to know whether he views recent inflation pressures as a temporary energy shock or the beginning of a more persistent second-round inflation cycle. Yet there is a catch. Warsh has long argued that central bankers should communicate less rather than more. As a result, investors may find that the Fed's new Chair offers fewer policy signals than markets have become accustomed to receiving.
In foreign exchange markets, the Dollar remains trapped between competing forces. The Swiss Franc is currently the strongest performer for the week, followed by the Euro and Australian Dollar. The New Zealand Dollar, Canadian Dollar and Yen lag behind. Sterling and the Dollar sit in the middle of the rankings. By the time the Fed decision is announced, markets will already know the rate outcome. What they do not know is how many policymakers now believe the next move could eventually be higher. That question may ultimately determine the Dollar's next major move.
Sterling Slips on UK Inflation Misses, But GBP/CAD Bullish Case Remains Intact
Today's data may delay a hike. It probably won't cancel one. Markets may push back expectations for the next BoE move, but elevated services inflation means tightening remains a live possibility. GBP/CAD still has two powerful tailwinds. A significant UK yield advantage and collapsing oil prices continue to support the pair even as Sterling digests softer inflation data. Read More.
DOW Hits Record High as Falling Oil Prices Offset Fed Fears
The real risk isn't today's rate decision. It may be how many Fed officials are quietly starting to project another rate hike. For now, though, falling oil prices are keeping the DOW record run strong. Read More.
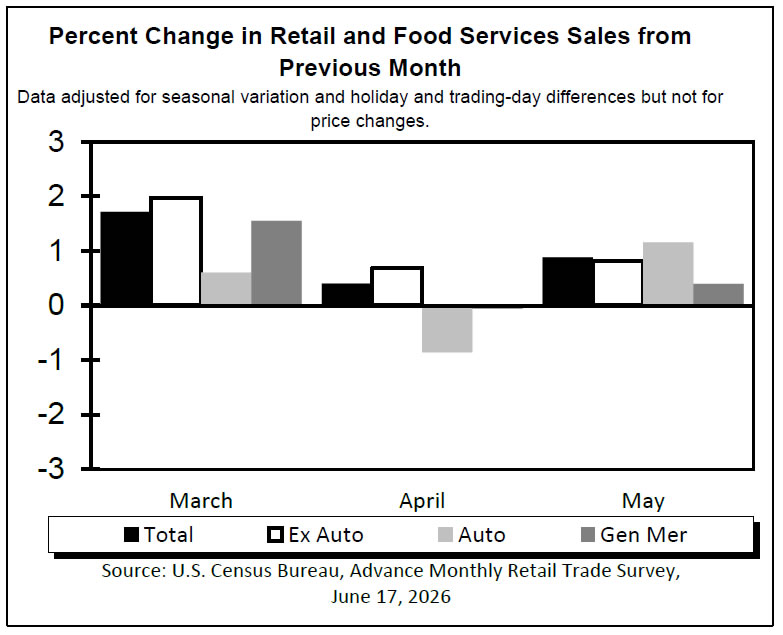
US Retail Sales Surge 0.9% in May, Signaling Resilient Consumer Demand
Higher rates haven't stopped consumers from spending. Strong gains in headline and core retail sales suggest demand remains resilient despite inflation and tighter financial conditions. Read More.
Eurozone Core Inflation Accelerates to 2.6% as Services and Energy Drive Prices Higher
The headline rose. The core story got stronger. Eurozone inflation accelerated in May, but the bigger development was a jump in core CPI from 2.2% to 2.6%, signaling that underlying price pressures remain stubborn. Read More.
UK Inflation Holds at 2.8% as Goods Disinflation Offsets Services Pressure
The Bank of England got some breathing room. Headline and core inflation both undershot forecasts, reducing pressure for an immediate policy response ahead of this week's rate decision. Read More.
Japan Exports Beat Expectations as AI Demand Offsets War-Related Disruptions
Japan's export boom looks stronger than it really is. Headline exports jumped 17.0% in May, but volumes rose just 0.5%, suggesting higher prices and a weaker Yen did most of the heavy lifting. Read More.
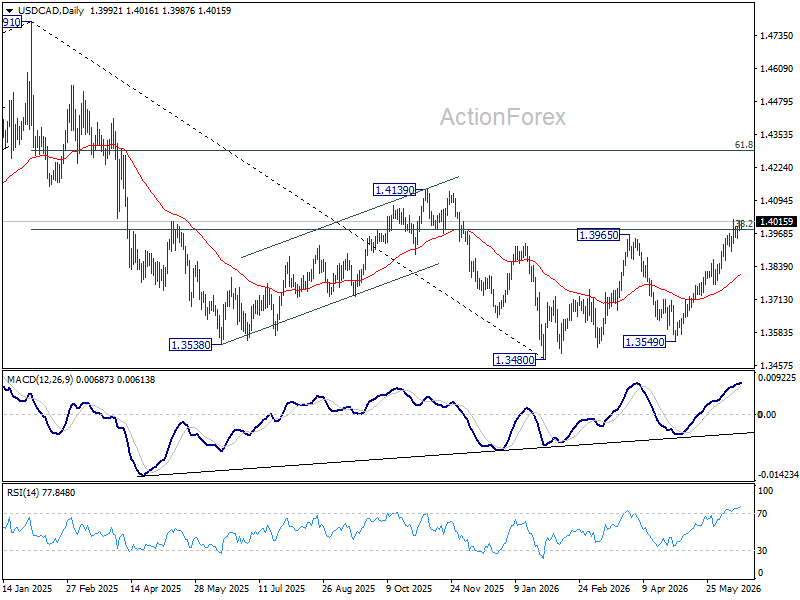
USD/CAD Daily Outlook
USD/CAD is still bounded in range below 1.4023 and intraday bias stays neutral. Further rise is expected as long as 1.3897 support holds. On the upside, sustained break of 38.2% retracement of 1.4791 to 1.3480 at 1.3981. Decisive break there will carry larger bullish implications and target 61.8% retracement at 1.4290 next. However, firm break of 1.3897 will turn bias back to the downside for deeper pullback.
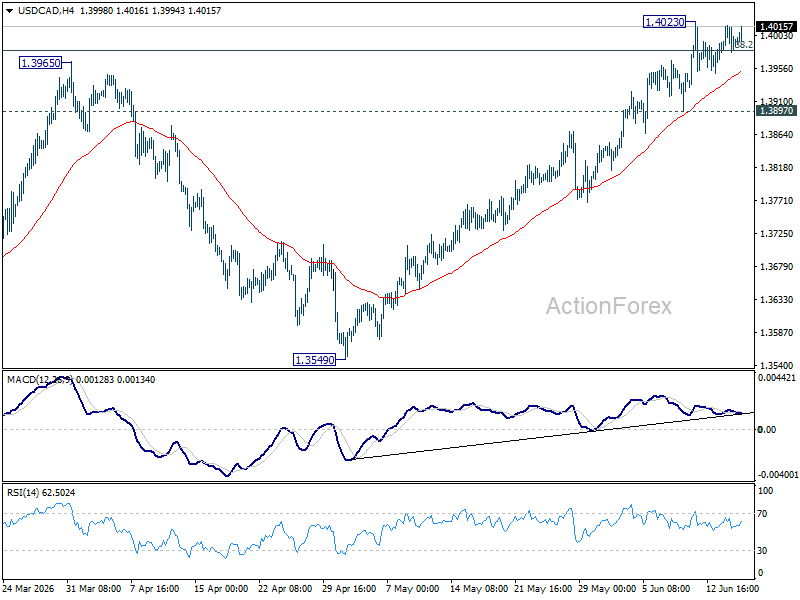
In the bigger picture, price actions from 1.4791 are seen as a corrective pattern to the whole up trend from 1.2005 (2021 low). Rejection by 38.2% retracement of 1.4791 to 1.3480 at 1.3981 will keep the decline intact, and bring another fall through 1.3480 at a later stage. However, firm break of 1.3981 will argue that the decline has completed, and set up further rise back to retest 1.4791 instead.
US Retail Sales Surge 0.9% in May, Signaling Resilient Consumer Demand
US retail sales rose 0.9% mom to USD 763.7B in May, comfortably exceeding expectations of 0.5% mom and accelerating from the previous month's 0.4% mom. The gain suggests that consumer spending remained resilient despite elevated inflation, high borrowing costs and growing uncertainty over the economic outlook.
Excluding automobiles, retail sales increased 0.8% mom to USD 623.4B, also beating expectations of 0.5% mom. Retail sales excluding gasoline rose 0.7% mom to USD 700.0B, indicating that the increase was not simply driven by higher fuel prices. Total retail sales for the March through May period were up 5.3% from a year earlier.
Given that household consumption accounts for roughly two-thirds of US economic activity, the latest figures provide further evidence that domestic demand remains a key pillar supporting growth.
| Indicator | May 2026 | Expected |
|---|---|---|
| Retail Sales M/M | 0.9% | 0.5% |
| Retail Sales Ex-Autos M/M | 0.8% | 0.5% |
| Retail Sales Ex-Gasoline M/M | 0.7% |
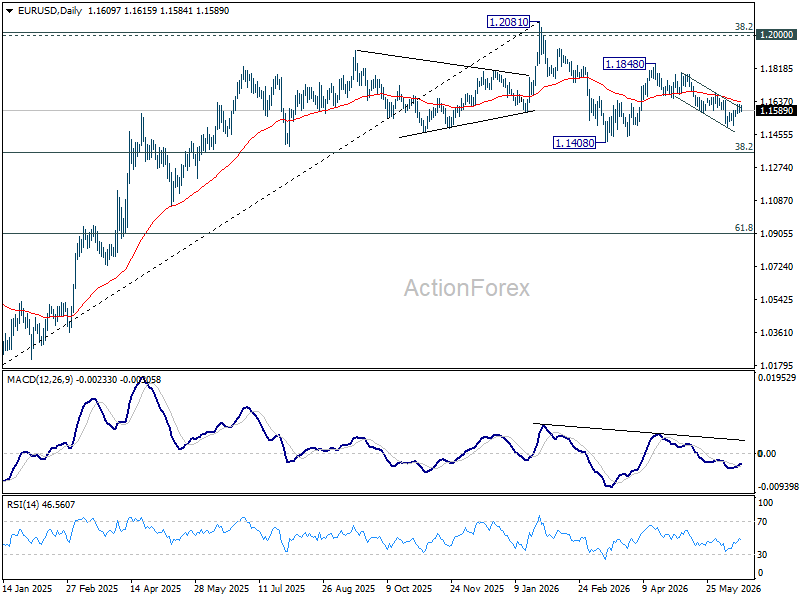
EUR/USD Daily Outlook
Range trading continues in EUR/USD and intraday bias stays neutral. Risk will stay on the downside as long as 1.1685 resistance holds. Break of 1.4990 will resume the fall from 1.1848 to retest 1.1408 low next.
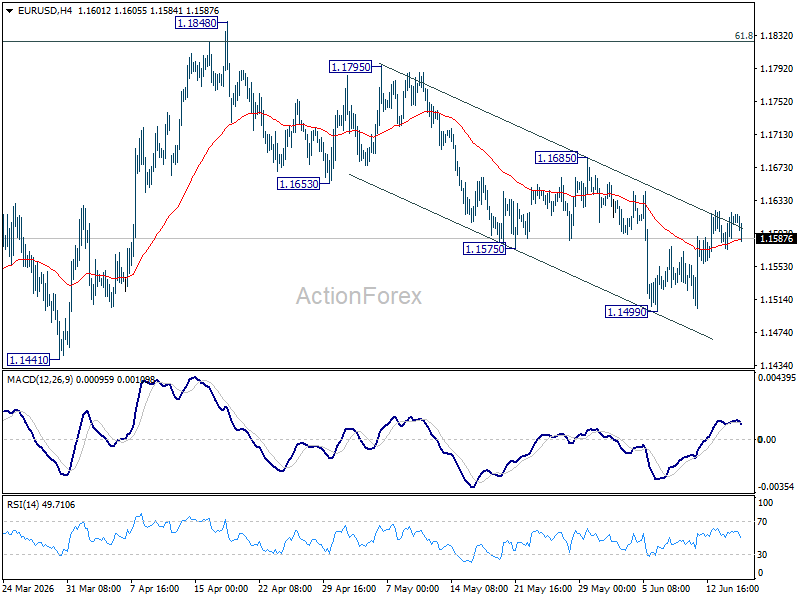
In the bigger picture, the strong support from 38.2% retracement of 1.0176 to 1.2081 at 1.1353 suggests that the pullback from 1.2081 is more likely a corrective move. Strong support was also found in 55 W EMA (now at 1.1547). Focus is back on 1.2 key cluster resistance level. Decisive break there will carry long term bullish implications. Nevertheless, break of 1.1408 support will revive the case of medium term bearish trend reversal.
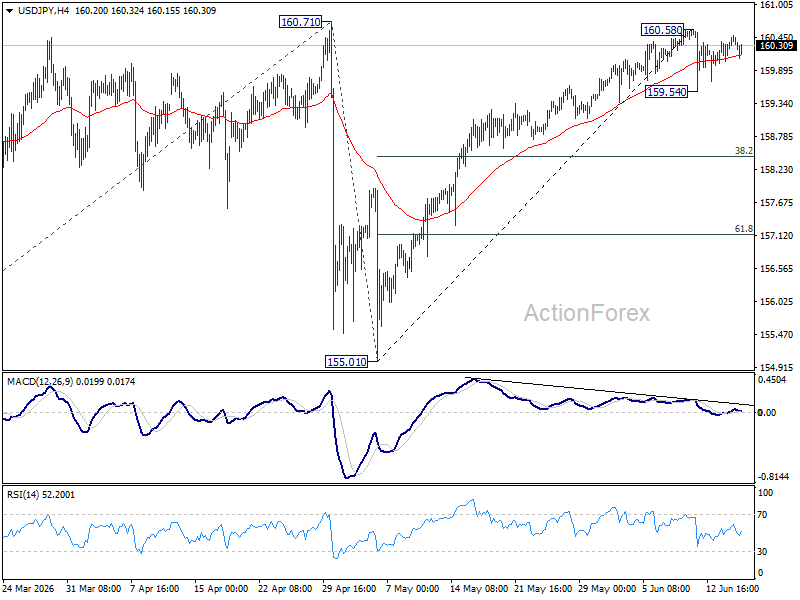
USD/JPY Daily Outlook
Intraday bias in USD/JPY remains neutral for the moment. On the downside, break of 159.54 will extend the fall from 160.58 short term top to 38.2% retracement of 155.01 to 160.58 at 158.45. However, decisive break of 160.71 will confirm up trend resumption. That should push USD/JPY through 161.94 to 100% projection of 152.25 to 160.71 from 155.01 at 163.47 next.
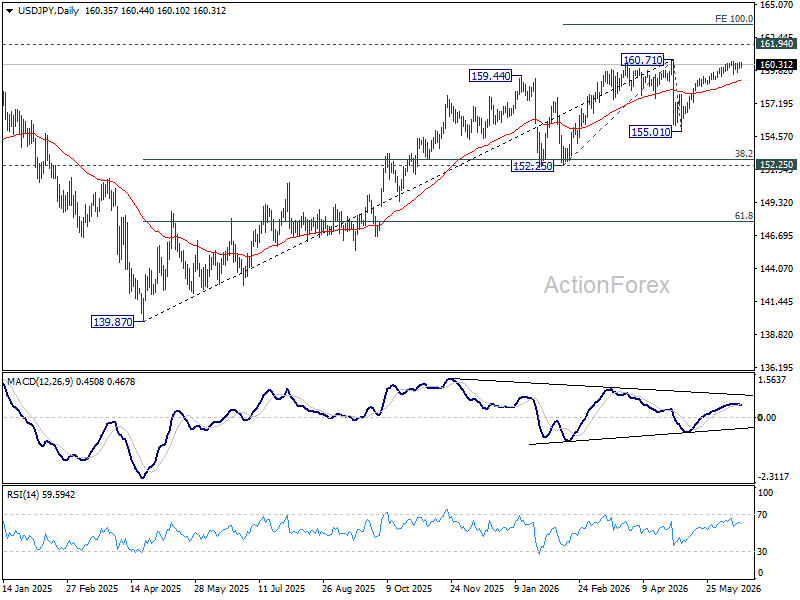
In the bigger picture, for now, corrective pattern from 161.94 (2024 high) is still seen as completed at 139.87. Rise from there is seen as resuming the long term up trend. So, break of 161.94 is expected at a later stage to resume the long term up trend. However, sustained break of 55 W EMA (now at 155.13) will dampen this view and bring deeper fall back towards 139.87 to extend the pattern from 161.94.
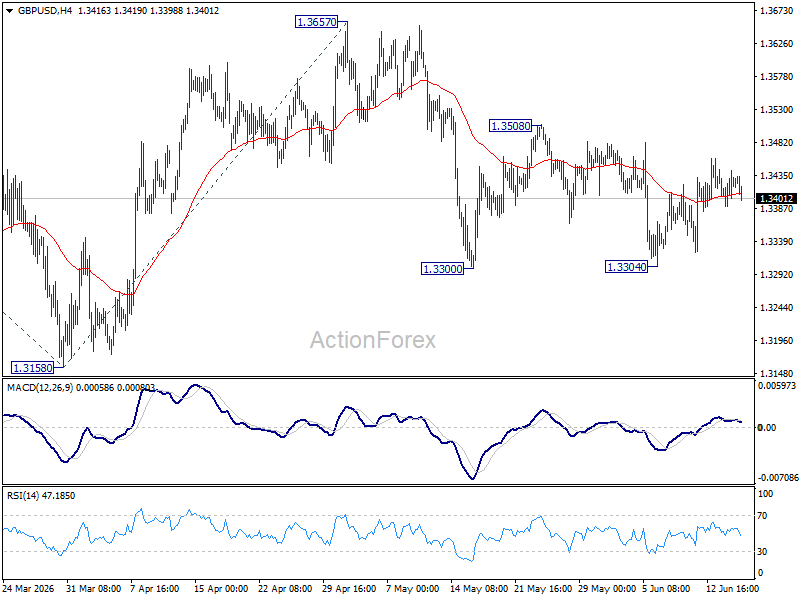
GBP/USD Daily Outlook
Intraday bias in GBP/USD remains neutral at this point, as range trading continues. Risk will stay mildly on the downside as long as 1.3508 resistance holds. Firm break of 1.3300 will resume the decline from 1.3657 to 1.3158 support next. However, break of 1.3508 will turn bias back to the upside for retesting 1.3657 instead.
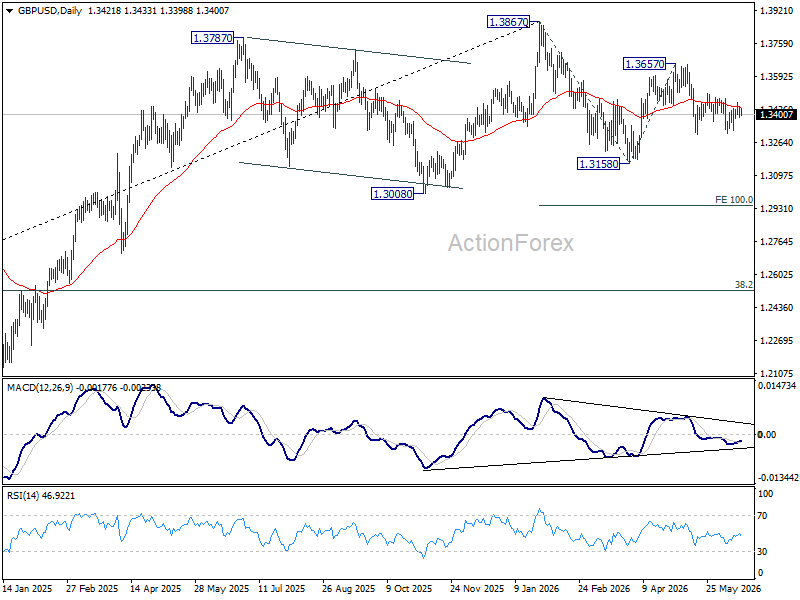
In the bigger picture, price actions from 1.3867 are a corrective pattern within the broader up trend from 1.0351 (2022 low). With 1.3008 support intact, medium term bullishness is maintained and break of 1.3867 is in favor for a later stage, towards 1.4248 key resistance (2021 high). However, firm break of 1.3008 will at least bring deeper fall to 38.2% retracement of 1.0351 to 1.3867 at 1.2524, with increased risk of bearish reversal.
USD/CHF Daily Outlook
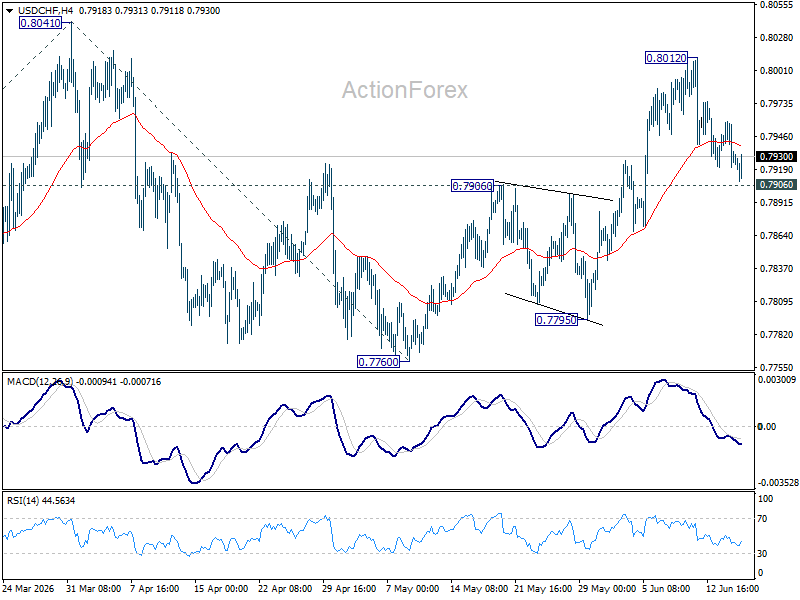
USD/CHF is still holding above 0.7906 resistance turned support. Intraday bias remains neutral and further rise is still in favor. Above 0.8012 will bring retest 0f 0.8041 high. Firm break there will resume the rise from 0.7603 and target 100% projection 0.7603 to 0.841 from 0.7600 at 0.8198 next. However, sustained break break of 0.7906 will turn bias back to the downside for 0.7795 support instead.
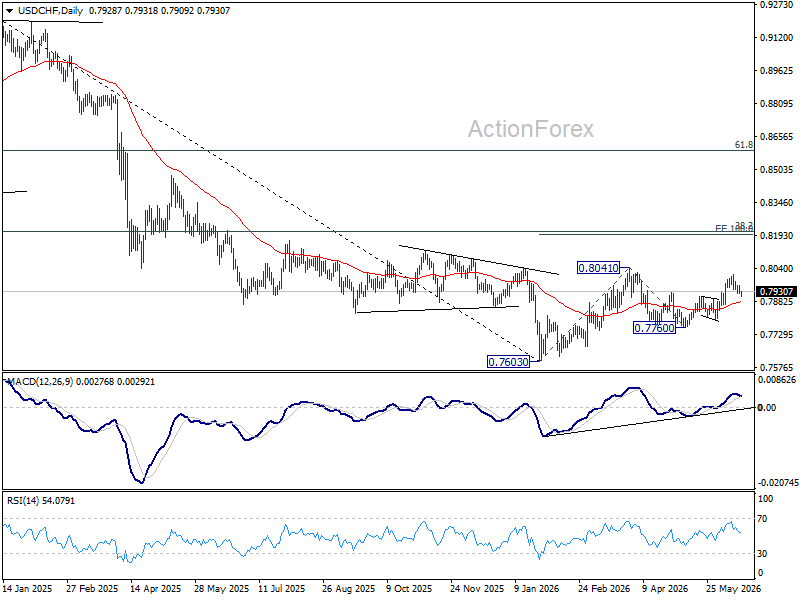
In the bigger picture, while a medium term bottom was formed at 0.7603, it's still early to call for bullish trend reversal. As long as 38.2% retracement of 0.9200 (2025 high) to 0.7603 at 0.8213 holds, the larger down trend could still continue through 0.7603 at a later stage. However, firm break of 0.7603 will argue that the trend has reversed and turn focus to 0.8332 support turned resistance (2023 low) for confirmation.
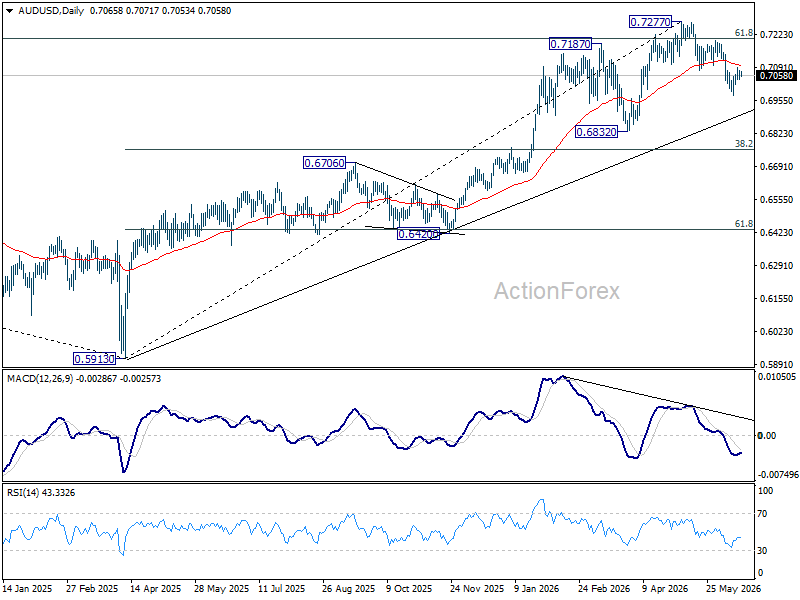
AUD/USD Daily Report
Intraday bias in AUD/USD is turned neutral with current retreat. Some consolidations would be seen. Fall from 0.7277 might have completed as a three wave correction at 0.6977. Above 0.7087 will target 0.7200 resistance. On the downside, though, break of 0.6977 will resume the fall towards 0.6832 support.
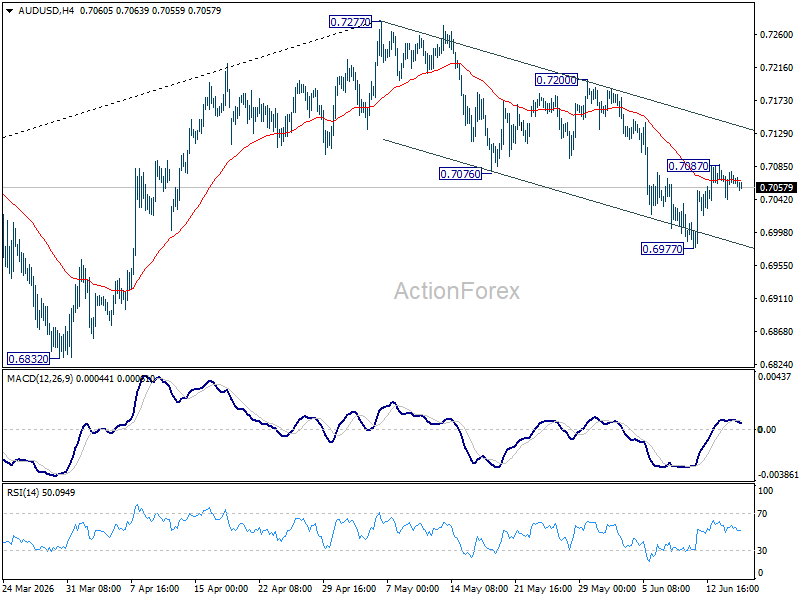
In the bigger picture, considering bearish divergence condition in D MACD, a medium term top could be formed at 0.7277 after failing to sustain above 61.8% retracement of 0.8006 (2021 high) to 0.5913 (2024 low) at 0.7206). Deeper fall could be seen to 38.2% retracement of 5913 to 0.7277 at 0.6756 as a correction. But strong support should be seen there to bring rebound. Consolidations would continue below 0.7277 for a while.