Sample Category Title
USD/JPY Potential Target At 110.32
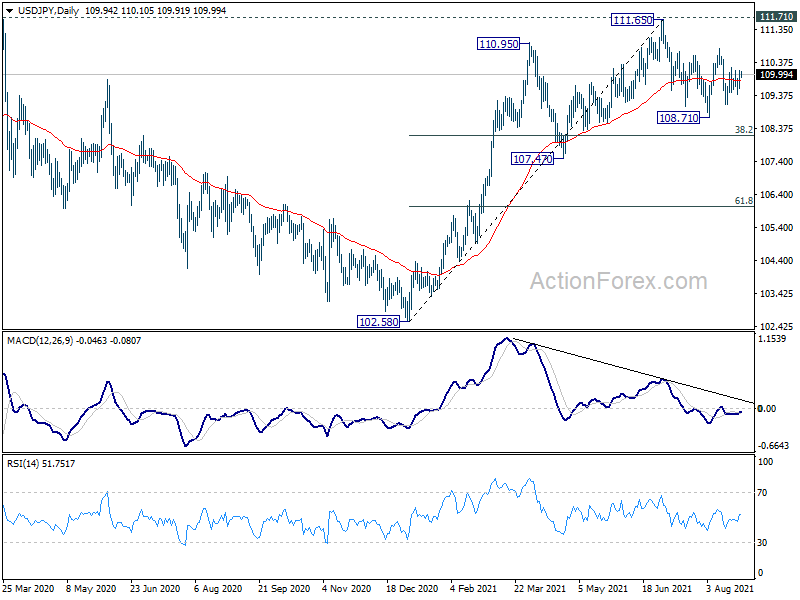
On August 25, the US Dollar surged by 38 pips or 0.35% against the Japanese Yen. The currency pair reversed from a support line at 109.71 during Wednesday's trading session.
Everything being equal, the exchange rate is likely to continue to trend bullish during the following trading session. The potential target for buyers will be near the 110.32 level.
However, the USD/JPY currency exchange rate could find resistance at 110.10 within this session.
XAU/USD Decline Likely To Continue
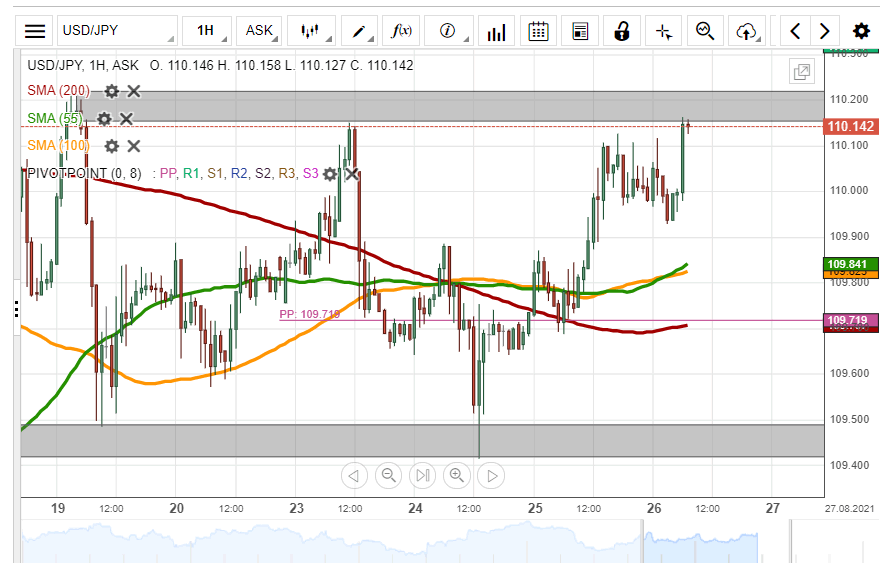
On August 25, the XAU/USD exchange rate fell by 121 pips or 0.67%. The decline was stopped by the 200– hour simple moving average during Wednesday's trading session.
By and large, the commodity is likely to continue to edge lower during the following trading session. The potential target for bearish traders will be near the 1775.00 level.
However, the 200– hour SMA support line at 1788.1 could provide support for the yellow metal in the shorter term.
Today It’s All About The ECB
Markets
The ECB awoke from the summer slumber with two opposing speeches yesterday. VP de Guindos said the economy again surprised positively and expects the September forecasts to be revised upwardly. He added that when the economy gets back to its feet, it's only normal that fiscal and monetary policy normalize as well. Chief Economist Lane, a well-known dove, struck a much more cautious tone. He suggested the central bank could and should wait with adjusting PEPP, saying that keeping financing conditions favourable is key. It would not be fair to say markets completely ignored Lane's comments but combined with yesterday's moderately positive risk setting, de Guindos' did grab most of the attention. That's also because they are in contrast with what is currently priced in (European) markets. Either way, German Bunds underperformed USTs even as the August Ifo indicator eased more than expected (from 100.7 to 99.4 vs 100.4 consensus). The curve bear steepened with changes varying form 1.1 bps (2y) over 5.6 bps (10y) to 7.5 bps (30y). US yields rose between 0.5 bps (3y) to 4.5 bps (10y). The 5y rose 2.1 bps despite a solid $61bn auction that had strong bidding metrics but tailed slightly. The ongoing rebound in commodities surely helped core bond yields too. The dollar swapped gains for losses as sentiment picked up in US dealings. The trade-weighted DXY fell for a fourth day straight to 92.82. EUR/USD marched higher to 1.1772. USD/JPY for the first time in two weeks closed just above 110. EUR/GBP is struggling for direction these last few days. It is holding an extremely tight sideways trading range between 0.855 and 0.857.
The Bank of Korea hiked rates with 25 bps to 0.75% (cf. infra). Other Asian-Pacific news is scarce, leaving a mixed sentiment to dominate equity markets this morning. China underperforms. Core bonds have an upward bias. The big three on FX markets, the dollar, euro, and the yen, top the G10 leaderboard. EUR/USD holds near yesterday's close.
Yesterday's ECB comments especially by de Guindos beg the question: how many others share his views? We may get a little more insight on that with the publication of the ECB minutes today. They usually turn out to be less informative compared to the Fed's but they are still worth mentioning in the run-up to a potentially pivotal ECB meeting September 9. In this respect we also highlight a slew of other ECB speeches by Rehn, Villeroy and Schnabel today. So today it's all about the ECB only to pass the baton from tomorrow on to the Fed. The rather excessive move in German/European yields yesterday shows just how little is priced in. The German 10y yield captured a first resistance of -0.44%. It's not out of the woods yet though. -0.40% is crucial but that might be a bit to soon to conquer today. The same holds for EUR/USD and 1.18. We would like to see European (real) yields and the euro bottom out but that'll require the ECB first to move more to the hawkish side of the spectrum.
News headlines
This morning, the Bank of Korea was the first major Asian central bank to hike its policy rate, by 0.25% to 0.75%. The BOK governor indicated that after the rate hike policy remains accommodative. The bank also signaled potential further adjustments, depending on financial imbalances, moves by other central banks, and by the developments in the pandemic. With respect to the latter, the governor Lee Ju-yeol indicated that the delta variant is having less negative impact on growth. The BOK expects the economy to growth 4% this year and raised its inflation outlook to 2.1%. The Korean won doesn't profit from the rate hike and even trades marginally weaker near USD/KRW 1169.
According to Australian Bureau of statistics, payrolls dropped 2% on a national level and 3.7% in the populous region of New South Wales. ABS indicated that's the result of ‘increasing restrictions in the fourth and the fifth week of the lockdown in New South Wales, including a pause in construction activity'. It also included lockdowns in Victoria and South Australia and travel and broader restrictions across all states and territories. At a national level almost every industry posted a decline in payroll jobs during the last two weeks of July. The Aussie dollar is losing marginally ground this morning (AUD/USD 0.7265) after a (commodity driven) rebound over the previous days.
EUR/USD Daily Outlook
Daily Pivots: (S1) 1.1741; (P) 1.1758; (R1) 1.1790; More...
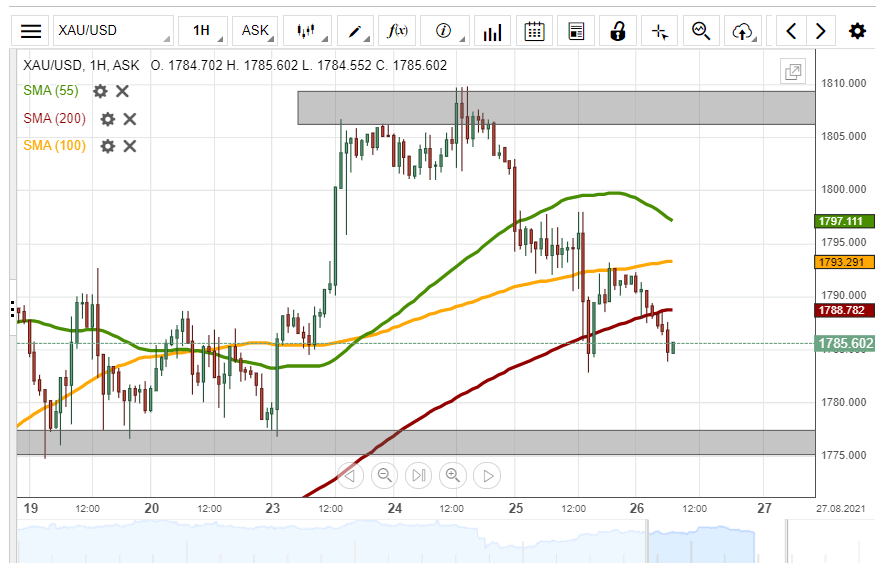
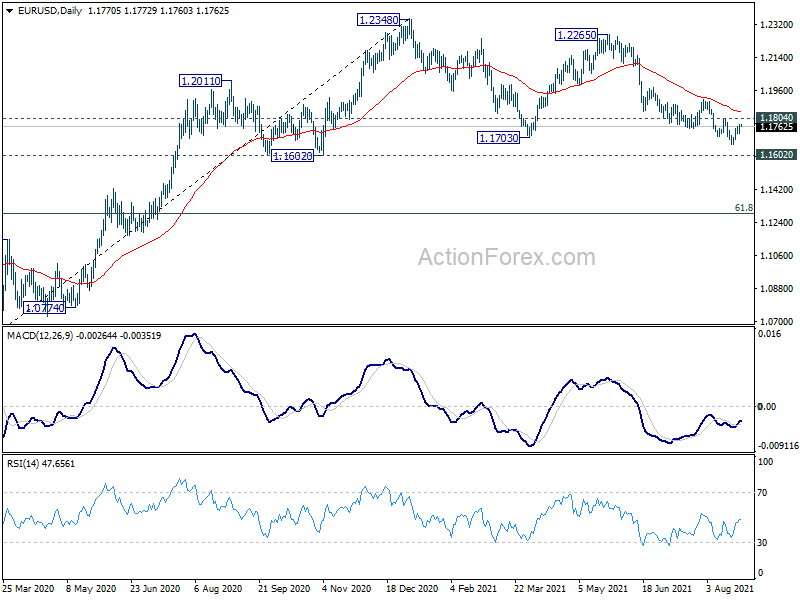
EUR/USD is still bounded in range of 1.1663/1804 and intraday bias remains neutral. With 1.1804 resistance intact, another fall cannot be ruled out yet. But we'd continue to look for strong support from 1.1602/1703 key support zone to bring rebound. On the upside, above 1.1804 resistance will turn bias back to the upside for 1.1907 resistance first. However, sustained break of 1.1602/1703 will carry larger bearish implication and pave the way to 1.1289 fibonacci support.
In the bigger picture, rise from 1.0635 is seen as the third leg of the pattern from 1.0339 (2017 low). Further rally remains in favors long as 1.1602 support holds, to cluster resistance at 1.2555 next, (38.2% retracement of 1.6039 to 1.0339 at 1.2516). However sustained break of 1.1602 will argue that the rise from 1.0635 is over, and turn medium term outlook bearish again. Deeper fall would be seen to 61.8% retracement of 1.0635 to 1.2348 at 1.1289 and below.
XAUUSD Is Possibly Bearish
Technical analysis
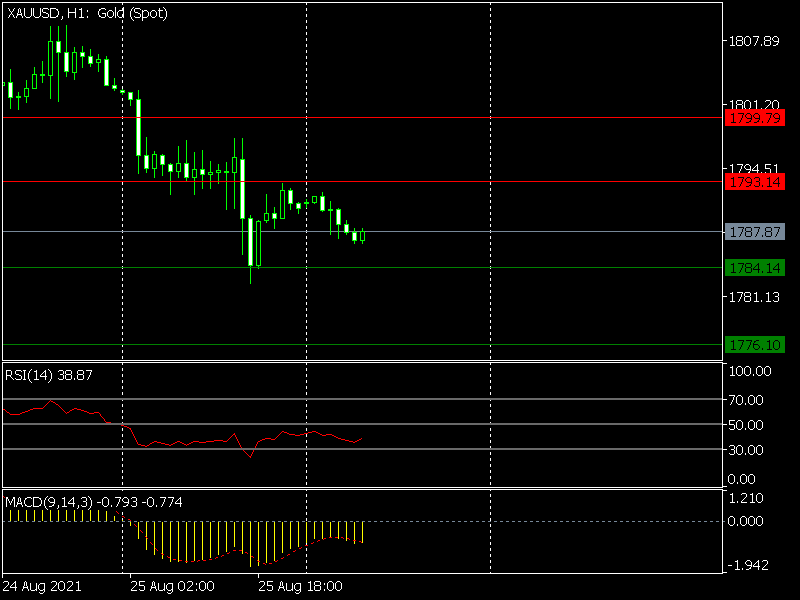
The MACD indicator line is below 0, pointing down
The RSI is below 50.
What the possible outcomes are
The U.S. Treasury yields jumped higher and may continue their way up. The 10-year benchmark pointed at 1.35% yesterday. However, despite all that, XAUUSD may move the opposite way.
If the price passes the initial support level of 1,784.14, it could test the next lower at 1,776.10.
Alternatively, if the price reverses, then it could reach the first resistance level of 1,793.14.
A pass above the first level can move the price up higher towards 1,799.79.
Key levels
Support 1,784.14 1,776.10
Resistance 1,793.14 1,799.79
GBP/USD Daily Outlook
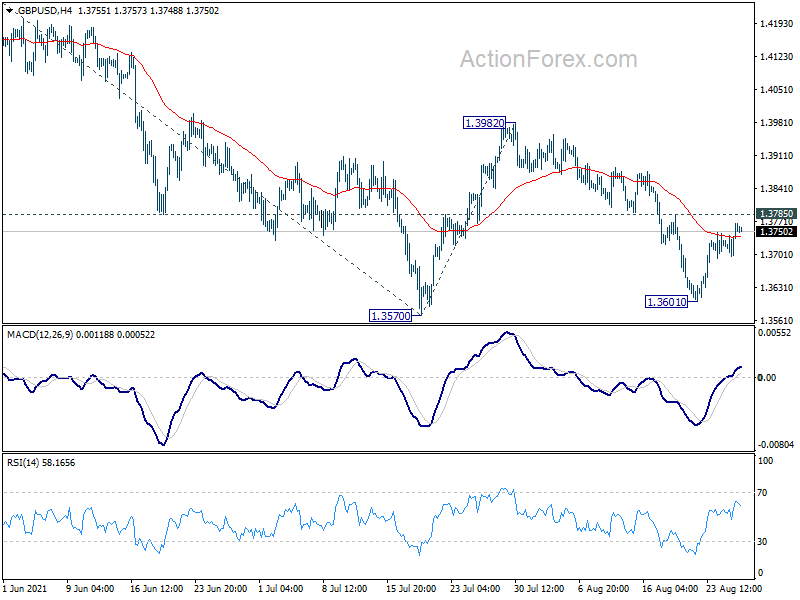
Daily Pivots: (S1) 1.3718; (P) 1.3742; (R1) 1.3788; More...
GBP/USD is staying in range above 1.3601 and intraday bias remains neutral. Another fall is in favor with 1.3785 minor resistance intact. On the downside, firm break of 1.3570 will resume larger fall from 1.4248 to 1.3482 resistance turned support next. Break there will target 100% projection of 1.4248 to 1.3570 from 1.3982 at 1.3304. However, on the upside, break of 1.3785 will turn bias back to the upside for 1.3982 resistance intact.
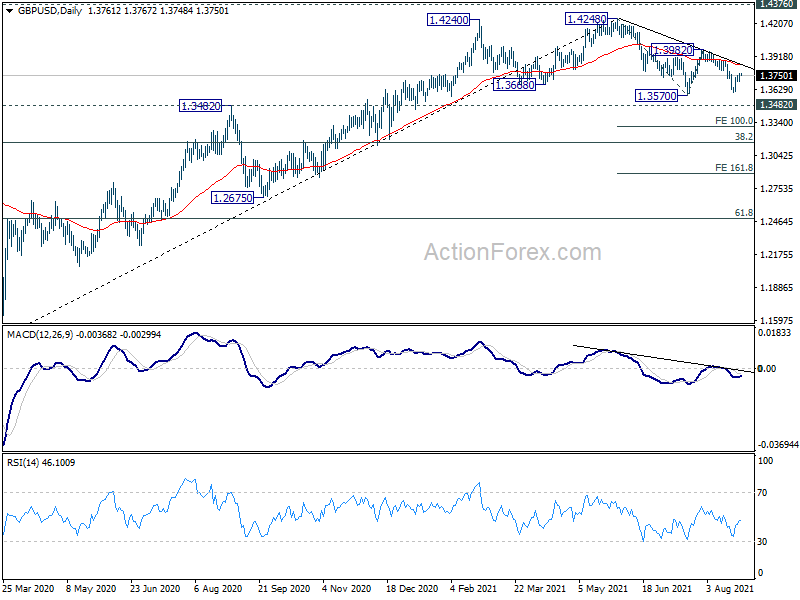
In the bigger picture, current development argues that rise from 1.1409 (2020 low) has completed at 1.4248, after failing 1.4376 resistance. Fall from there could either be correcting the rise form 1.1409, or starting another falling leg inside long term sideway pattern. In either case, sustained break of 1.3482 resistance turned support will target 38.2% retracement of 1.1409 to 1.4248 at 1.3164 first. Break there will pave the way to 61.8% retracement at 1.2493.
EURUSD Cools Ahead Of Jackson Hole And US GDP Data
The EURUSD was little changed during the Asian session as traders waited for the upcoming statement from the European Central Bank (ECB) and economic data from the US. The ECB will publish the latest account of monetary policy, which will shed more light on the bank’s thinking. Later on, the US will deliver the second estimate of GDP data. Analysts expect a slight improvement of the GDP reading from 6.5% to 6.7%. At the same time, the statistics agency will publish the second quartet PCE number. Still, the main catalyst for the pair will be statements from central bankers at the virtual Jackson Hole summit.
US stocks did well in the overnight session as traders remained optimistic about corporate profit growth. The Dow Jones, S&P 500, and Nasdaq 100 indices rose by more than 0.10%. The latter two are comfortably at their all-time high. Their futures rose after strong earnings from Salesforce and Ulta Beauty. Salesforce made a profit of $1.48 per share, which was better than the median estimate of $0.92. Meanwhile, the wave of mergers and acquisitions continued. According to the Wall Street Journal, Western Digital was in talks to combine with Kioxia Holdings in a $20 billion deal.
The Australian dollar tilted lower today after the strong economic data from the country The statistics agency said that building capital expenditure rose by 4.6% in the second quarter. In the same month, the plant and machinery capital expenditure rose by 4.3% while private new capital expenditure rose by 4.4%. Capital expenditure plays a major role in the overall calculator of a country’s GDP. Elsewhere, Hong Kong will publish its trade numbers while Sweden will release the latest PPI data.
AUDUSD
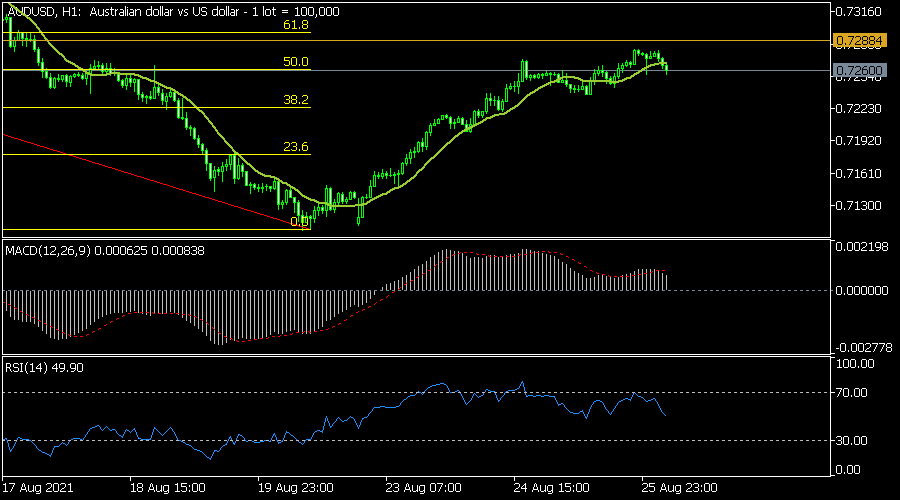
The AUDUSD pair declined to 0.7258, which was slightly below this week’s high of 0.7280. On the hourly chart, the pair dropped to the 50% Fibonacci retracement level. It also declined slightly below the 25-day moving average while the MACD remains above the neutral level. The RSI has started forming a bearish divergence pattern. Therefore, the pair may keep falling as bears target the key 38.2% Fibonacci level at 0.7220.
EURUSD
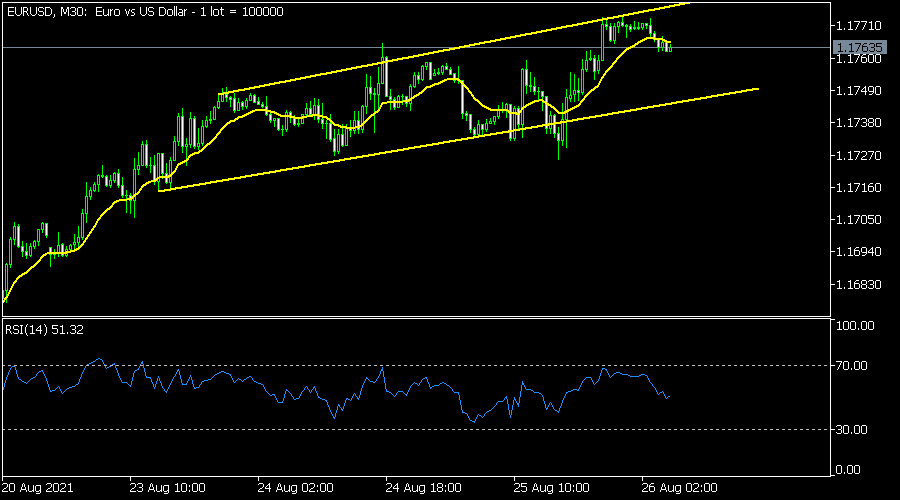
The EURUSD was little changed and is trading at 1.1763, which is slightly below this week’s high of 1.1773. On the 30-minute chart, this price is slightly below the 25-day moving average. It is also slightly above the 63.8% Fibonacci retracement level. The price is also below the upper side of the ascending channel. Therefore, the pair may keep falling as bears target the lower side of this channel at 1.1745.
NDX100
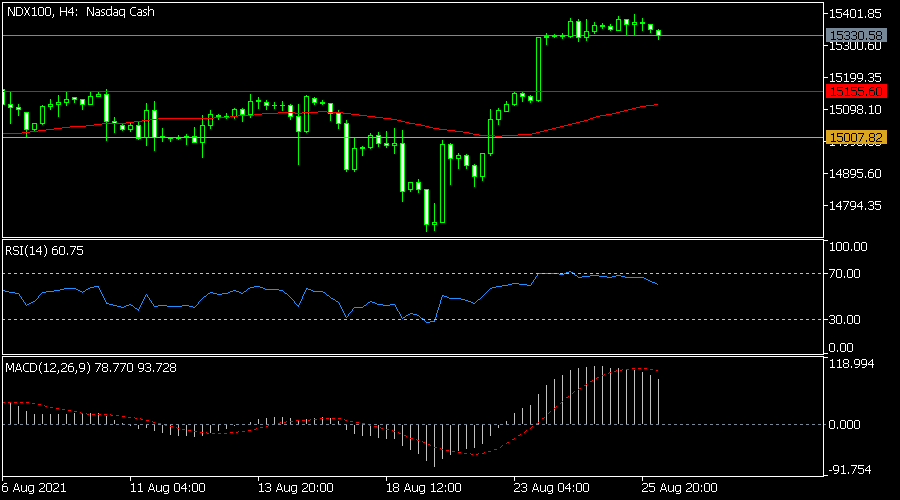
The Nasdaq 100 index is hovering at its highest level on record as interest in technology stocks remain. It is trading at $15,330, which was slightly below the all-time high of $5,400. On the four-hour chart, the pair has formed a bullish consolidation pattern while oscillators have formed a bearish divergence pattern. Therefore, the index will likely pull back to the support at $15,155 and then continue with the bullish trend.
Where Do We Go Now, Sweet Powell?
S&P 500 hit the 4500 mark on Wednesday, and at this speed, we could well see the Credit Suisse’s 5000 target reached before next year. Or not.
The stock market really starts gaining a momentum that worries many people, as the more the equity prices go up, the sharper a downside correction would be.
So, all eyes and ears are now set to the Jackson Hole symposium, where the Federal Reserve (Fed) Chair Jerome Powell will speak about the Fed’s plans about what’s coming next.
To predict how the market could react to Mr. Powell’s speech, we first need to understand what’s priced in and what’s not.
Actual price levels in major US indices include the information that the Fed could start tapering its bond purchases before the end of the year, or at the beginning of the next, based on the fact that the US jobs market is showing an encouraging progress and inflation is relatively high.
But, we also know that the rising Covid cases threatens a healthy recovery in the coming months, and Powell will certainly say that the Fed should monitor the economic data closely to adjust its policy to it.
What’s left to price is, which between the strong jobs/high inflation and the threat of a slowdown in economic recovery would weight more? There are two options: either the Fed is still firmly convinced that the strong progress in jobs figures justify tapering its bond purchases according to the plan, or soft economic data could change the original plan and bring the Fed to delay normalization on the QE front, meanwhile the interest rates will stay near zero levels for at least until 2023.
Speaking of the economic data, the major data on today’s calendar is the US Q2 GDP update, which is expected to print 6.7% growth versus 6.5% released earlier. I believe (hope) that good data should still trigger a positive market reaction and should not demoralize investors even it means a less dovish Fed, but a soft data could be more efficient in boosting the Fed doves, hence the equity bulls at a time the Fed is discussion tapering.
And speaking of the doves, the European Central Bank meeting minutes should show nothing less than a sufficiently dovish policy stance today, as European policy makers recently changed their inflation goal from ‘below but close to 2%’ to 2%, and seem ready to tolerate higher inflation in the short run for the sake of a healthy post-pandemic recovery, especially now that we see the delta worries rising. And that dovishness from the ECB should keep the euro under pressure against the US dollar. We see solid offers into the 1.18 mark, but the euro bears remain timid before Powell’s Jackson Hole speech, in case Powell doesn’t stick to the text and say something surprisingly dovish. Yet the sentiment in EURUSD remains comfortably bearish in the medium run: the Fed tapering is coming sooner rather than later, while the ECB is taking the opposite direction of more support.
When it comes to the Fed, calling off the bond tapering is not the base case scenario. The base case scenario is Jerome Powell sticking to the taper plan, but cautiously.
Hence, Fed sticking to its tapering plan could awaken some bears and trigger a certain profit taking across the major US indices in the coming sessions, but the depression may not last long as the market bears seem hibernating before time this year.
USD/CHF Daily Outlook
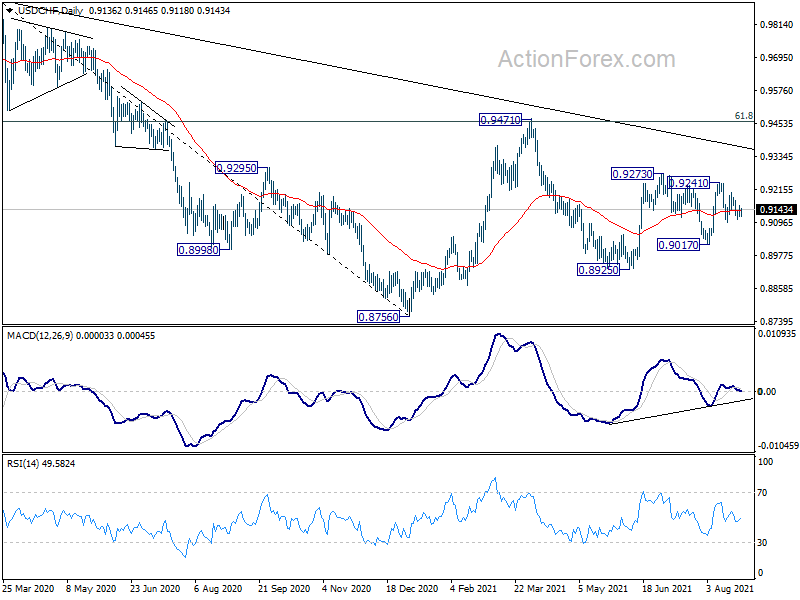
Daily Pivots: (S1) 0.9123; (P) 0.9140; (R1) 0.9156; More....
Intraday bias in USD/CHF stays neutral as range trading continues. On the upside, break of 0.9241 resistance should resume the rise from 0.8925 through 0.9273. On the downside, break of 0.9098 will target 0.9017 support first. Further break there will likely resume the decline from 0.9471 through 0.8925 low.
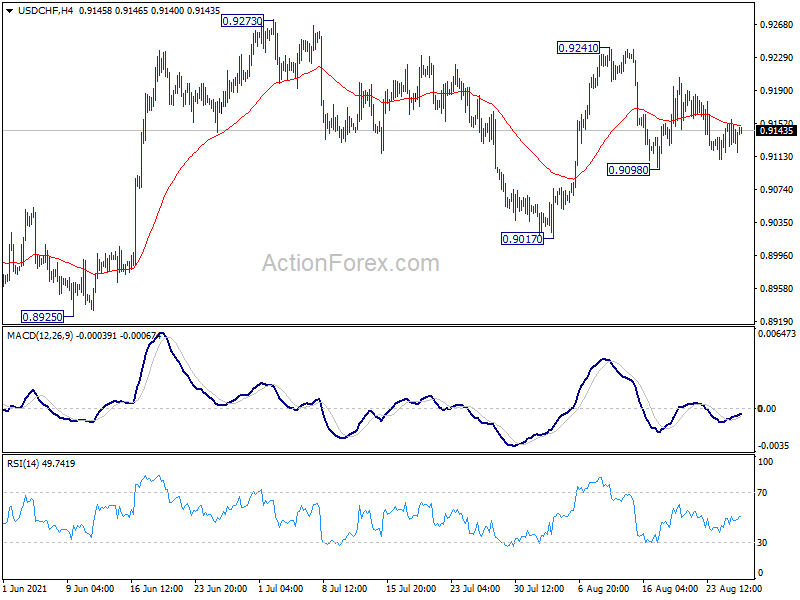
In the bigger picture, the failure to sustain above 55 week EMA (now at 0.9180) retains medium term bearishness in USD/CHF. Break of 0.8925 support should resume the whole decline form 1.0342 (2016 high) through 0.8756 low. However, break of 0.9273 resistance and sustained trading above 55 week EMA will be an early sign of bullish trend reversal. Focus will then turn to 0.9471 resistance for confirmation.
USD/JPY Daily Outlook
Daily Pivots: (S1) 109.71; (P) 109.92; (R1) 110.20; More...
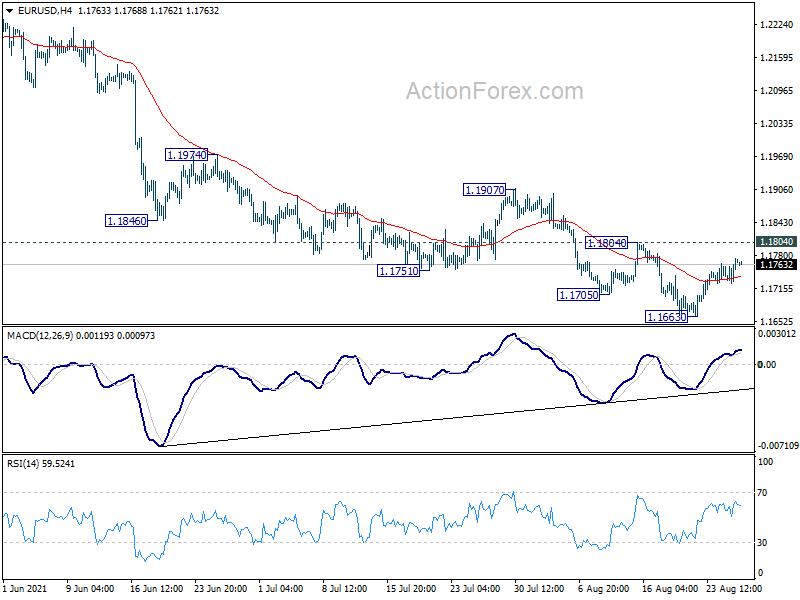
Range trading continues in USD/JPY and intraday bias remains neutral for the moment. On the upside, break of 110.79 will resume the rebound from 108.71 to retest 111.65 high. On the downside, break of 109.10 will target 108.71 support first. Firm break there will resume the decline from 111.65 and target 38.2% retracement of 102.58 to 111.65 at 108.18 next.
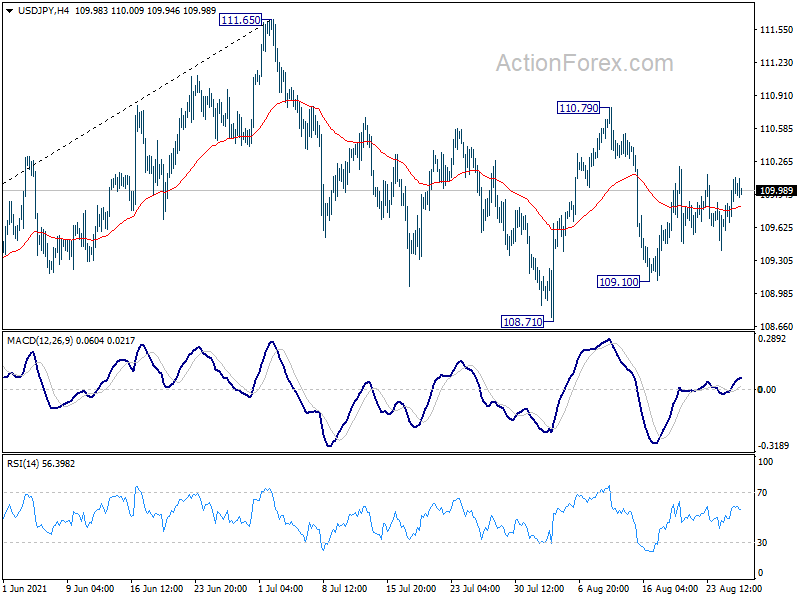
In the bigger picture, medium term outlook is staying neutral with 111.71 resistance intact. The pattern from 101.18 could still extend with another falling leg. Sustained trading below 55 day EMA will bring deeper fall to 107.47 support and below. Nevertheless, strong break of 111.71 resistance will confirm completion of the corrective decline from 118.65 (2016 high). Further rise should then be seen to 114.54 and then 118.65 resistance.