Sample Category Title
EUR/CHF Outlook: Rises To One-Week High On SNB Intervention Talks
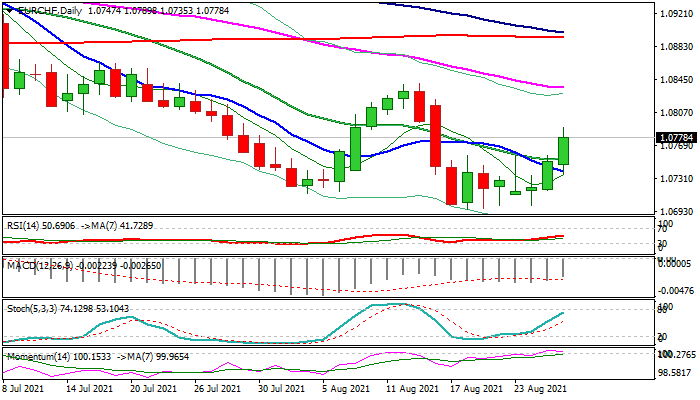
The EURCHF cross rose to one-week high in early European session on Thursday, extending strong gains into second straight day.
The move was sparked by SNB intervention talks that pushed Swiss franc lower in the middle of risk aversion phase, when safe haven instruments usually benefit.
Extension of bounce from a nine-month low at 1.0695 (Aug 19 low) still looks as correction of a downtrend from 1.1151 (2021 high, posted o Mar 4), with pivotal barriers at 1.0835/40 (55DMA / Aug 13 high) expected to cap and keep larger bears intact.
Fading bullish momentum on daily chart warns of recovery stall, as weekly techs in full bearish setup and converging 100/200DMA’s (1.0899/93), on track to form death-cross, add to negative signals.
Res: 1.0789, 1.0806, 1.0840, 1.0875.
Sup: 1.0753, 1.0735, 1.0717, 1.0695.
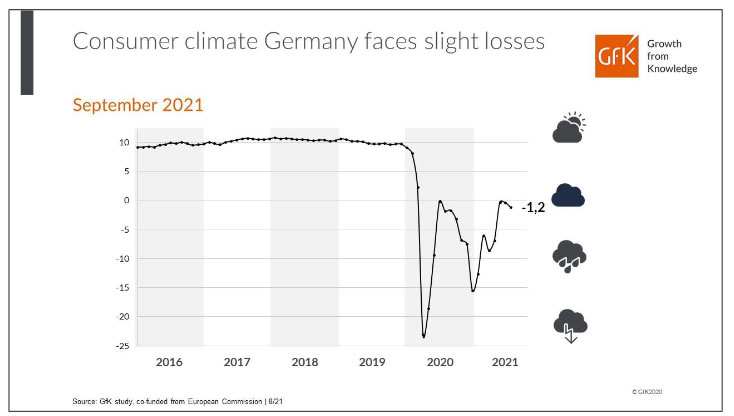
Germany Gfk consumer sentiment dropped to -1.2, fear of tightened restrictions again
Germany Gfk consumer sentiment for September dropped from -0.4 to -1.2. In August, economic expectations dropped from 54.6 to 40.8. Income expectations rose from 29.0 to 30.5. Propensity to buy dropped from 14.8 to 10.3.
Rolf Bürkl, a GfK consumer expert, commented on this observation: "Significant higher incidence values, a slowdown in vaccination momentum, and discussions about how to deal with unvaccinated individuals in the future have caused noticeable uncertainty among consumers in Germany. They fear that restrictions could even be tightened again. This is obviously depressing consumer sentiment right now."
Gold Confirms Bearish Scenario
Gold lost ground for the third day in a row, retreating to $1785 an ounce after another failed attempt to break above $1800. Such dynamics of the precious metal runs counter to rising demand for many commodities, which indicates bearish pressure.
Gold bulls failed to return the metal to an upward trend, as evidenced by the technical picture. An unsuccessful attempt to break above $1800 paves the way for declines in the $1500-1600 area, where gold might be by the middle of next year.
Gold made its third unsuccessful attempt to break above its 200 SMA early week, and now the bears are increasing the pressure in the critical technical area.
$1790 passes the 50-day moving average that acts as a signal line for the medium-term trend. The price staying under this line indicates bearish dominance.
Around $1800, the uptrend's support line is located, which now has more and more signs of resistance, preventing the gold price from going higher.
Fundamentally, the current macroeconomic cycle is also not favourable for gold purchases. The current situation is comparable to late 2012/early 2013 when global central banks reduced their economic support.
Things are moving much faster now: between the cyclical highs and lows, it has been five rather than ten years, and the QE-induced price spike lasted five months rather than 35 as after the global financial crisis.
The correction of gold from the 2011 peaks to the bottom at the end of 2014 took about 50% of the rally. A proportionate correction creates the potential for a drop to $1560, zeroing out all the gains from April to August 2020.
Since this time, we see a much faster economic and monetary policy response with stimulus. The above correction could shrink from 3 years after the upward trend break to 2-3 quarters, i.e., reach the bottom in the first or second quarters of 2022.
AUDUSD Advances Towards Familiar Resistance
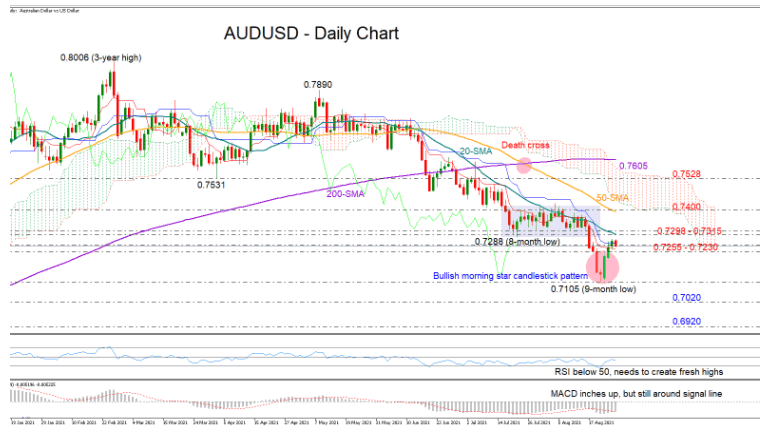
AUDUSD has been on the rise since the confirmation of a bullish morning star candlestick pattern, which foresaw the start of a new bullish round last Friday, but another challenge is currently displaying on the radar. Particularly, the price needs to close decisively above the 20-day simple moving average (SMA) at 0.7298, which has been cancelling upside pressures since the end of May.
Of note, the RSI continues to fluctuate below its 50 neutral mark, failing to print higher highs despite its recent advance, while the MACD, although a bit stronger, remains attached to its red signal line. Additionally, the red Tenkan-sen line is showing no sign of correcting its bearish cross with the blue Kijun-sen line as the downward-sloping 20- and 50-day SMAs keep promoting a down-trending market. Overall, downside risks seem to be present.
Should the 20-day SMA put the breaks on the bullish action, pressing the price below 0.7230, all the attention will turn back to the nine-month low of 0.7105. Breaching that floor, the pair could mark a new lower low near the 0.7020 restrictive region last active during the second half of 2020, while a steeper decline could target the 0.6920 handle.
In the positive scenario, a clear extension above the 20-day SMA may last until the 0.7400 resistance area, where the 50-day SMA is also hovering. Higher, a step above the Ichimoku cloud, which was a tough obstacle from the end of May to mid-June, may be needed to open the door for the 200-day SMA.
Summarizing, despite the bullish candlestick signals, the latest rebound in AUDUSD is still under scrutiny as the price is approaching a familiar resistance.
US Oil Heads Towards Daily Resistance
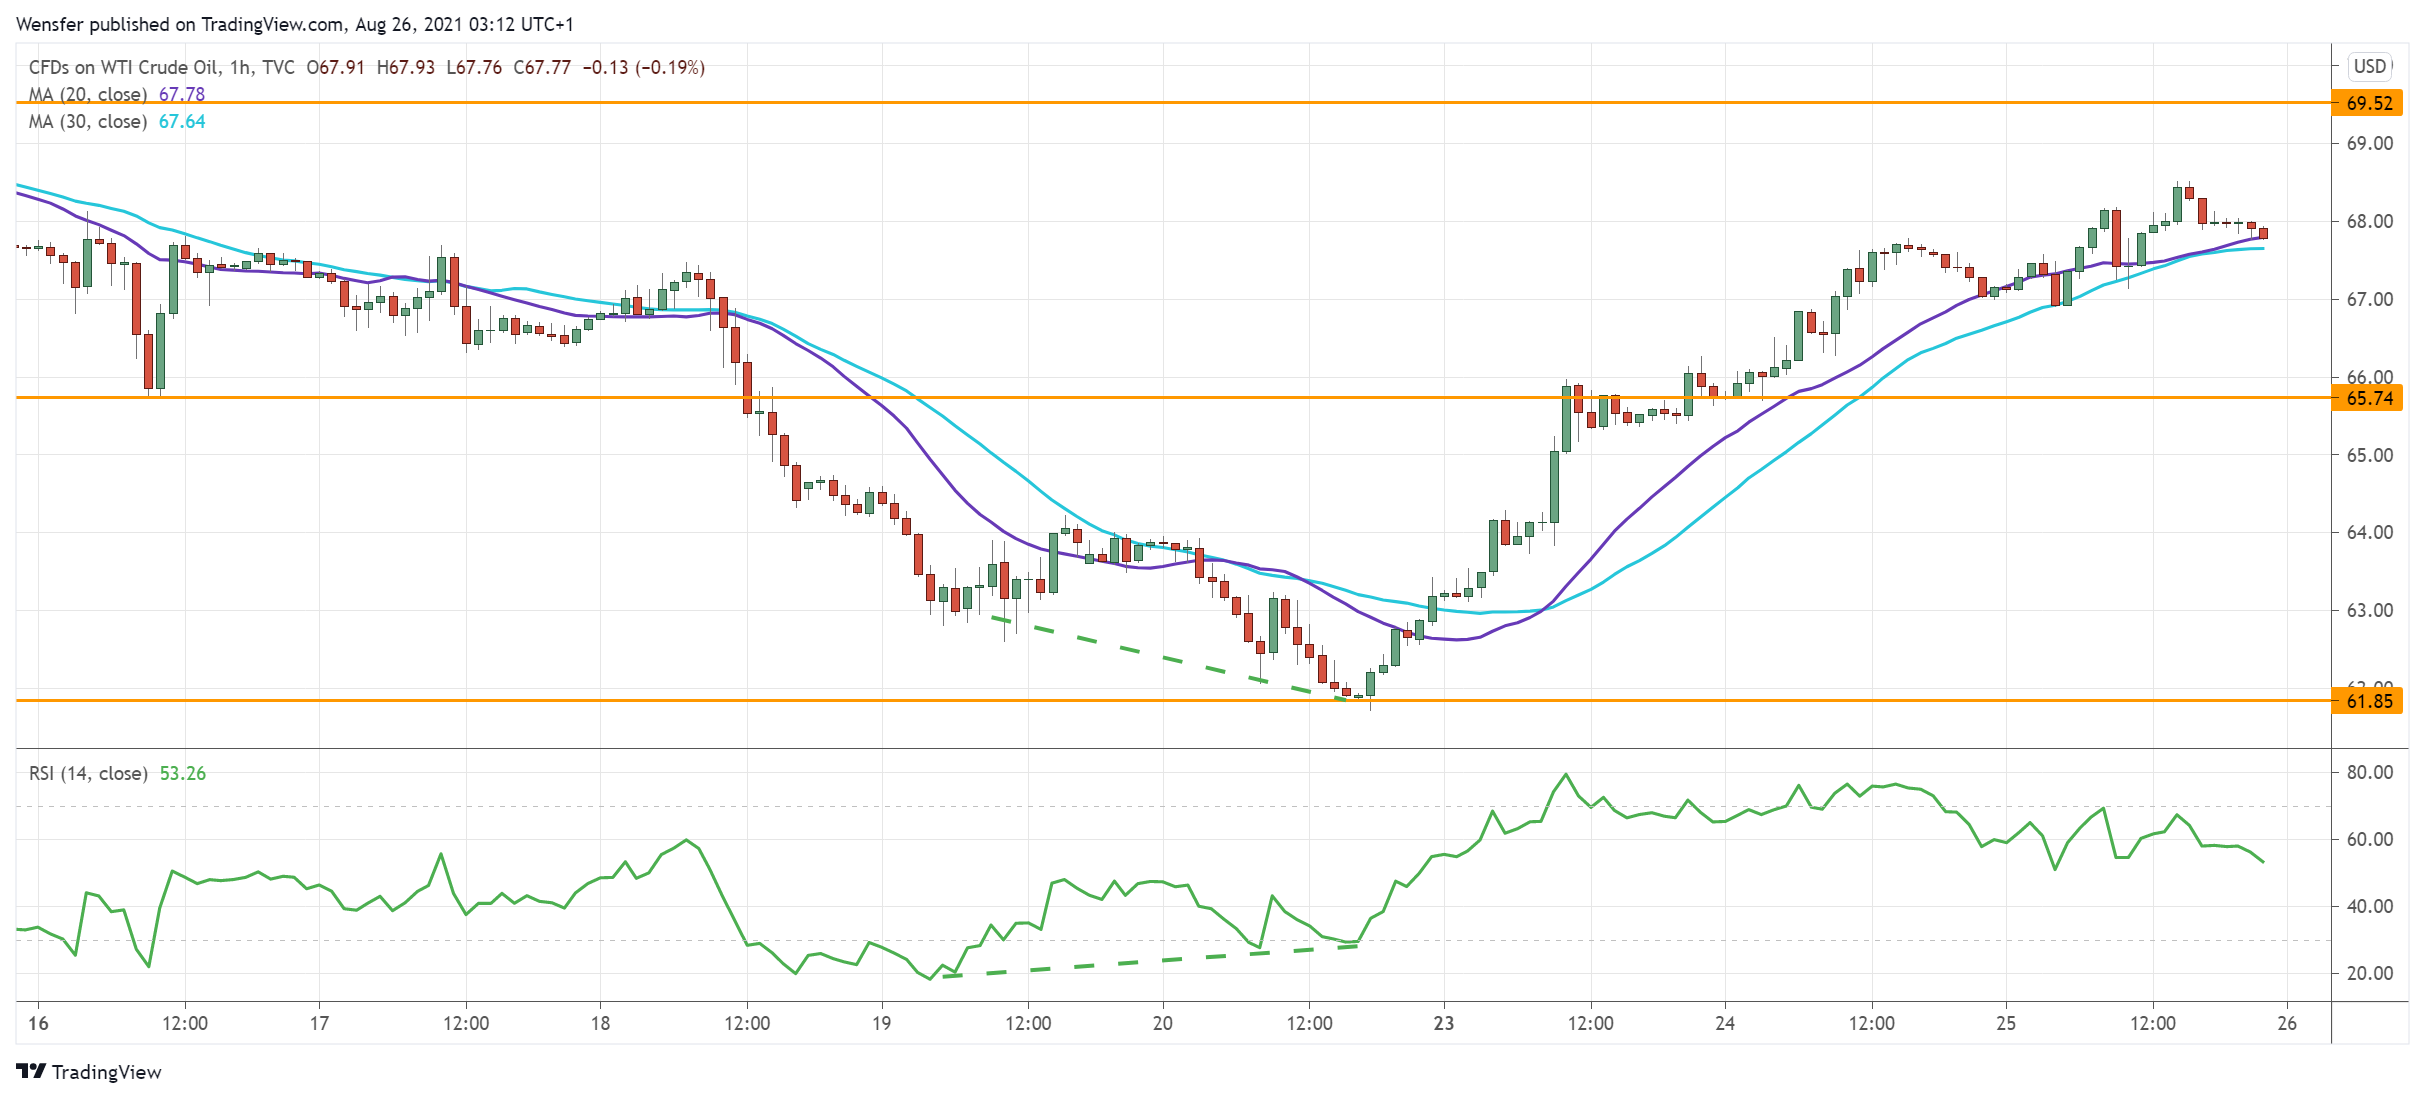
WTI crude rallied after the EIA showed a drop in the US inventories.
Price action continues on its upward journey after it bounced off May’s low at 62.00. A bullish RSI divergence at that major support suggested that the selling pressure was fading.
The rally above 67.40 is a confirmation that buyers have taken over. 69.50 is the hurdle ahead and a breakout may end a seven-week long consolidation and resume the uptrend.
An overbought RSI may trigger a limited pullback. 65.70 would be the first support in that case.
USD/NOK Retreats To Critical Support
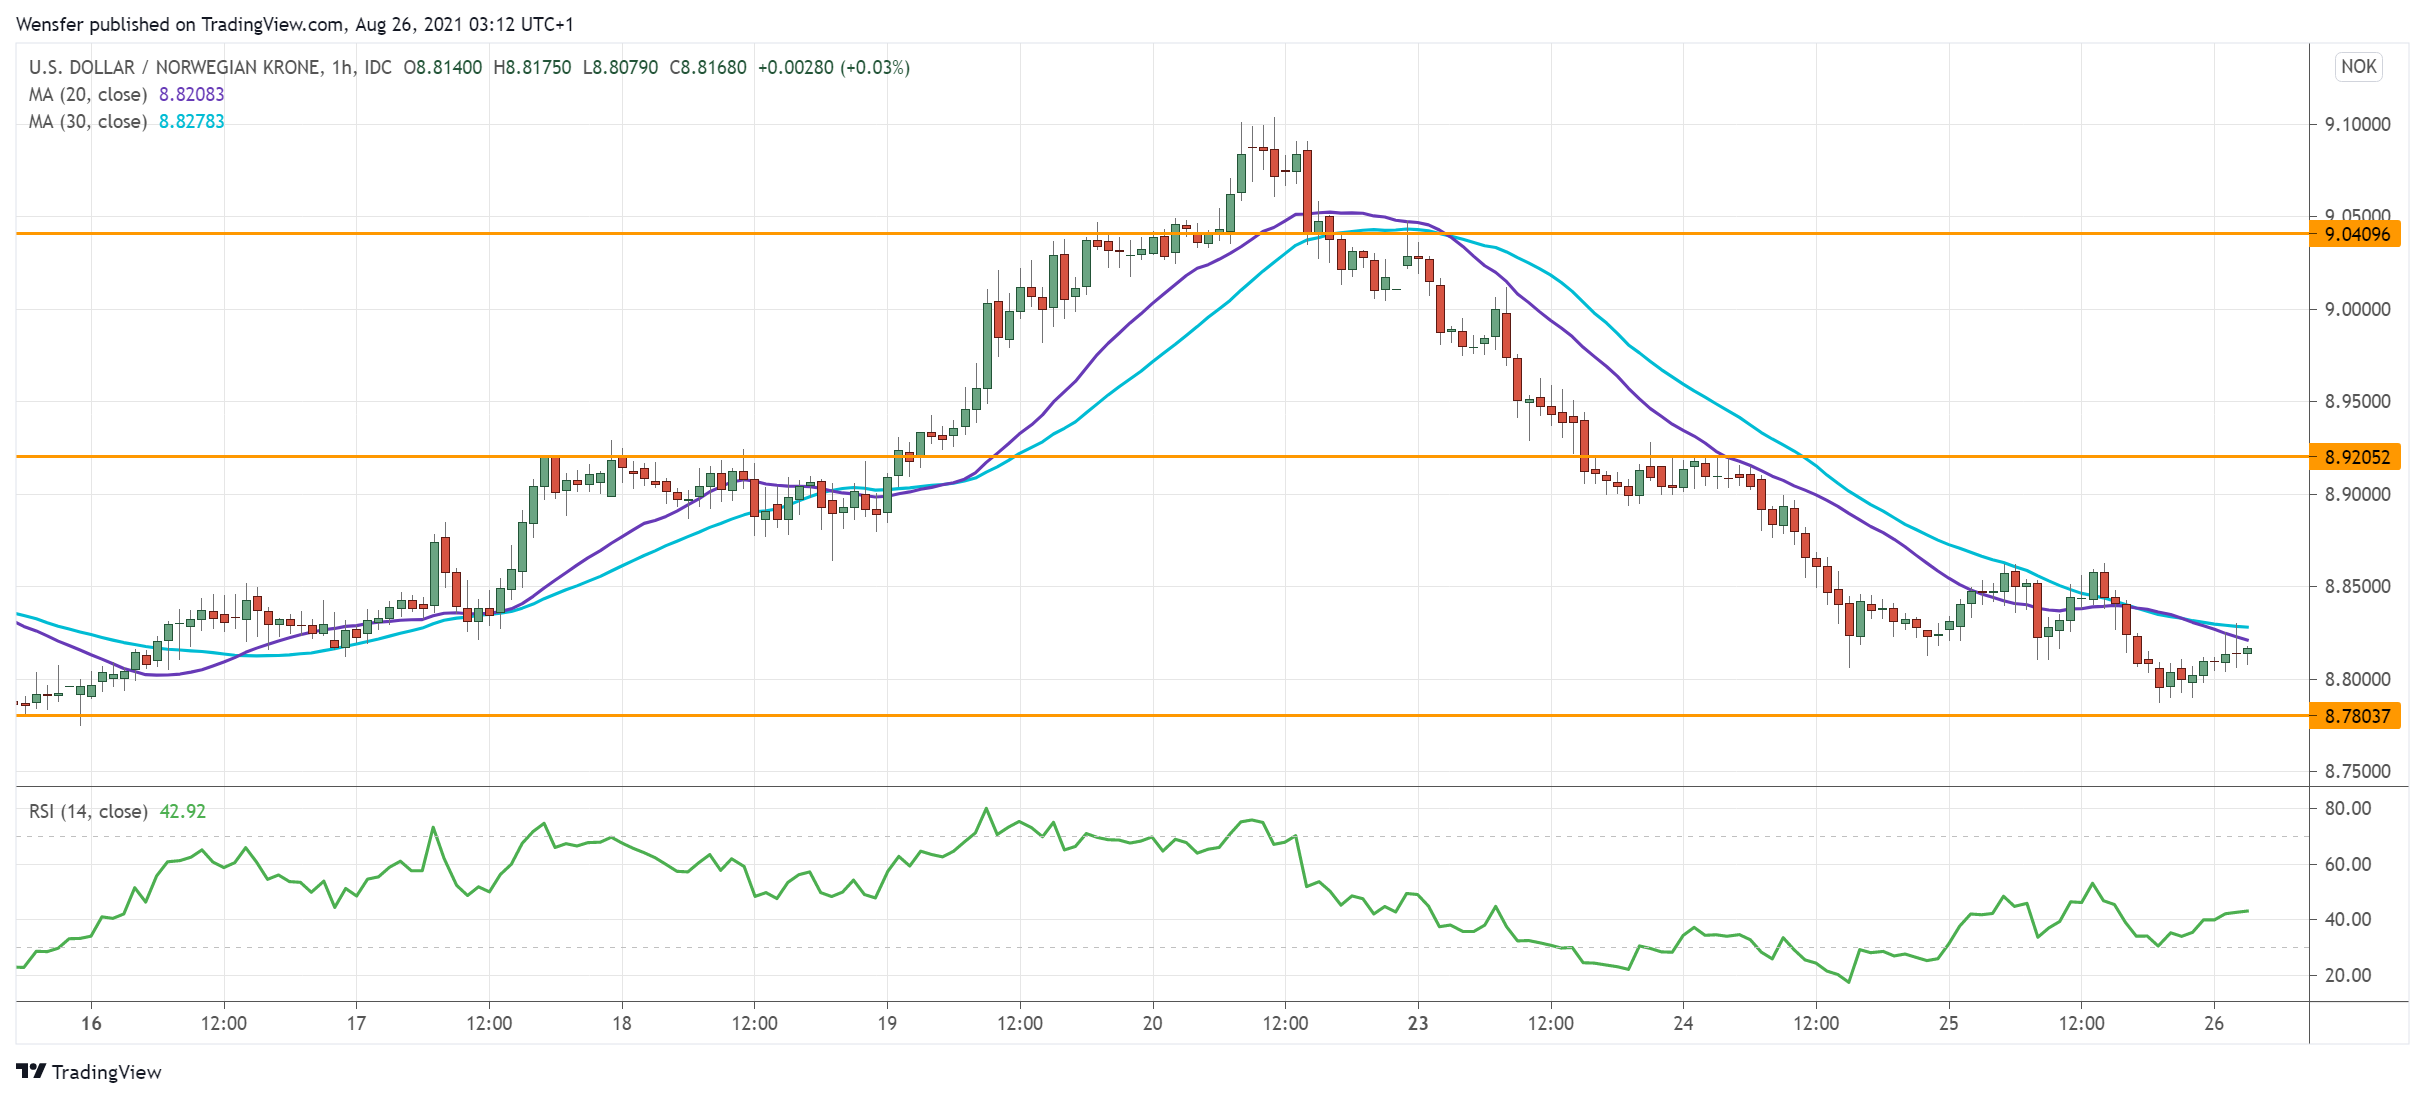
The commodity-linked Norwegian krone strengthened as oil prices recovered.
The greenback had met stiff selling pressure at the double top (9.1000). The subsequent break below 8.8800 suggests that hands are weak on the long side.
Profit-taking and fresh selling have sent the price to 8.7800, which is critical support from the daily timeframe. Its breach could signal a bearish reversal.
An oversold RSI may attract some buying interest, but the bulls will need to lift offers around 8.9200 before they could push for a rebound.
XAU/USD Tests Key Resistance
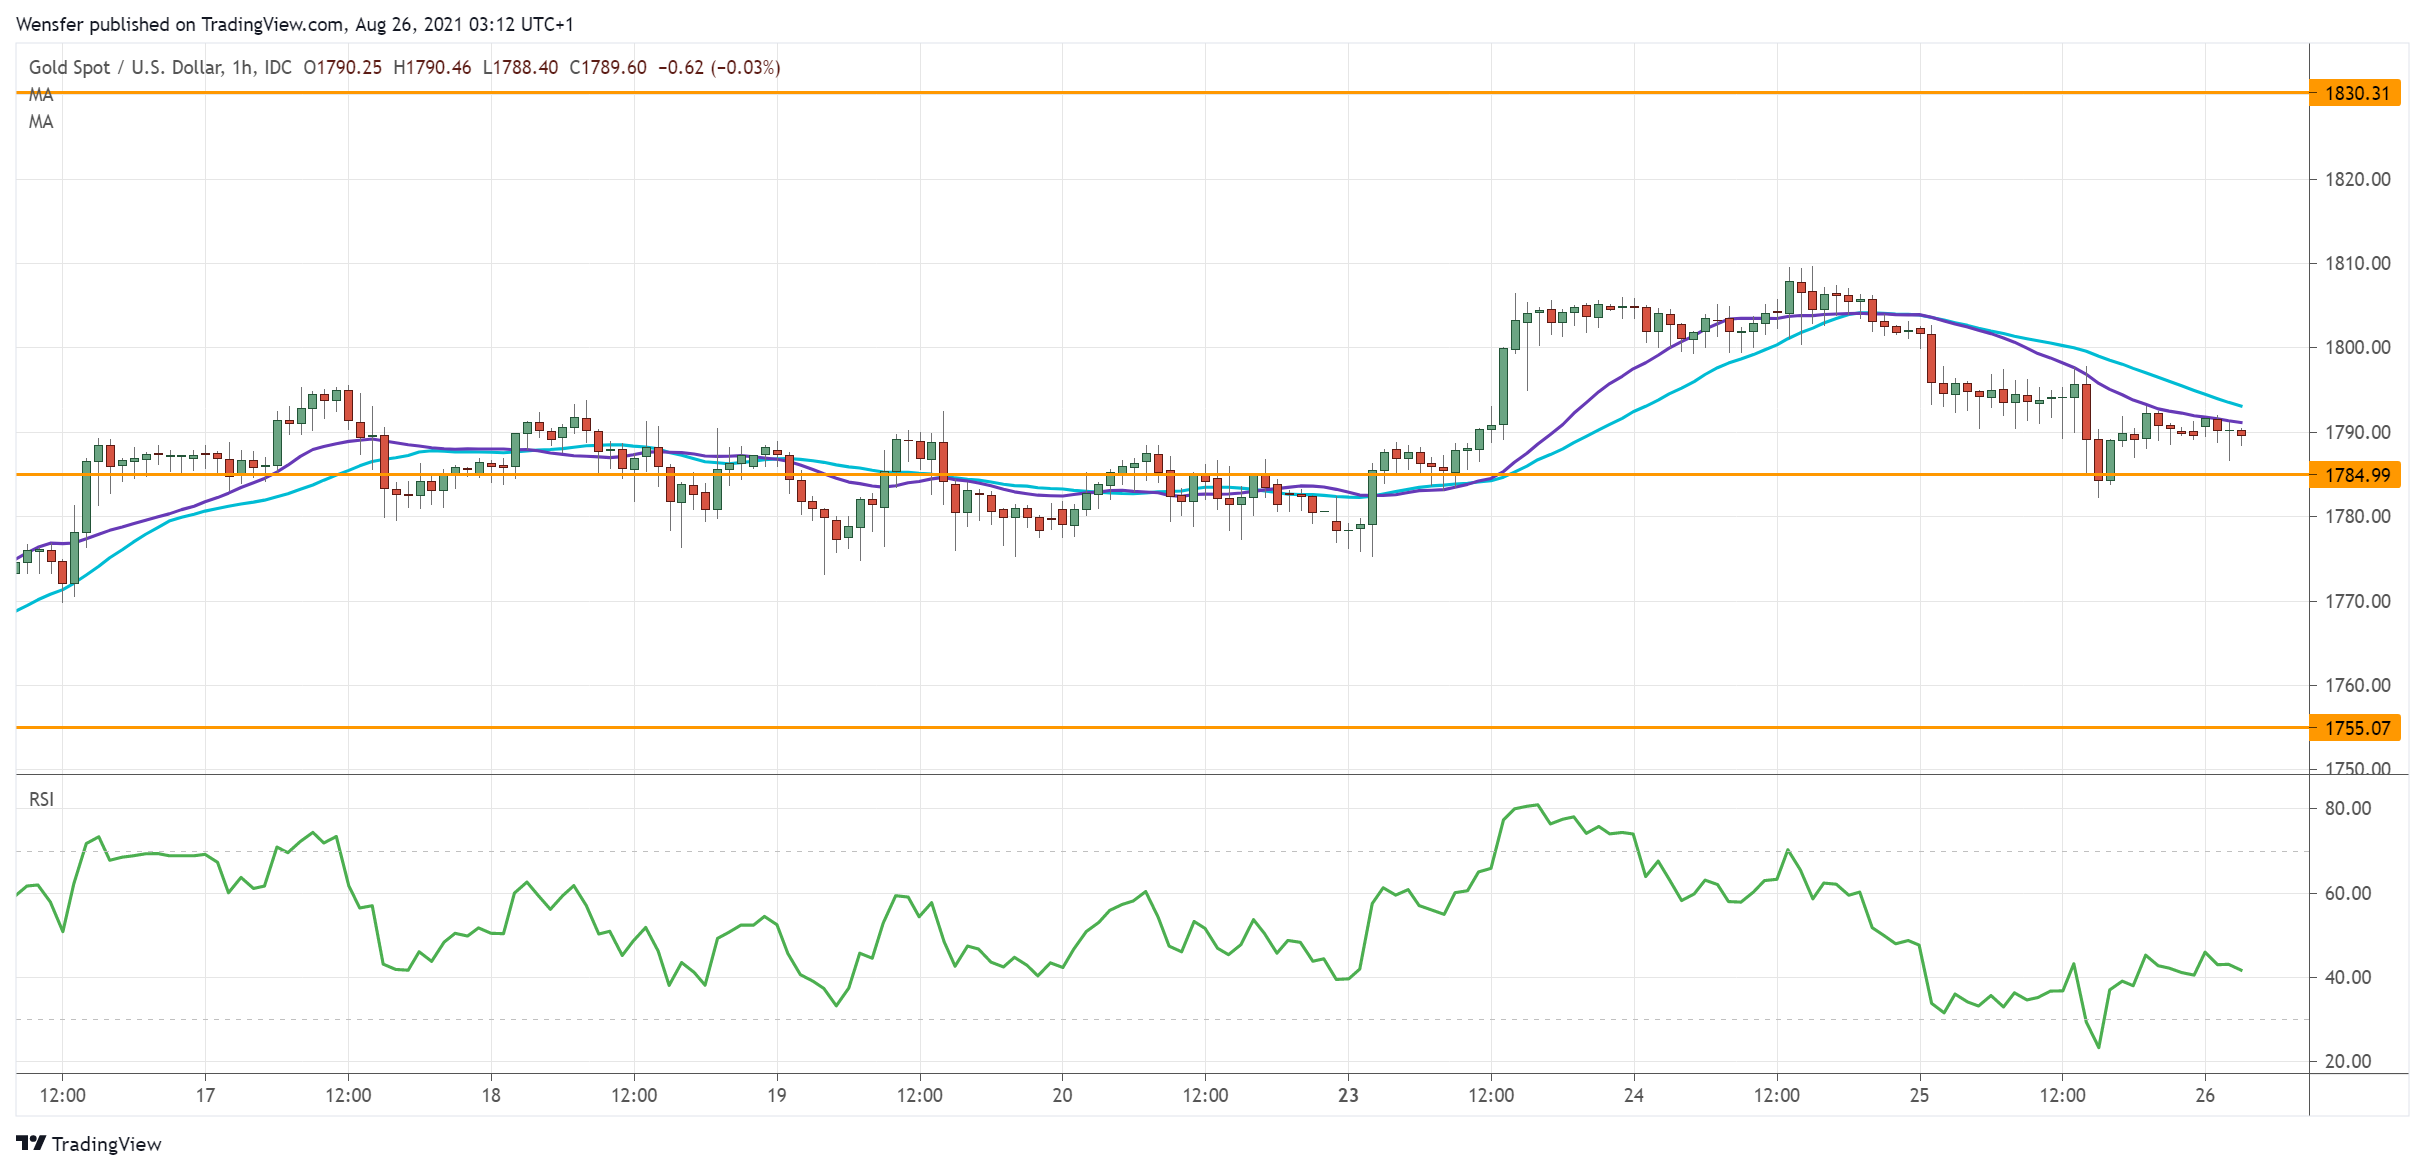
The US dollar’s weakness continues to fuel the gold rush.
The precious metal has recouped most losses from the crash earlier this month. The rapid recovery indicates traders’ strong willingness to buy the dips.
The price is about to test the major supply zone between 1810 and 1830 from the daily chart. Analysts can expect stiff selling pressure as short-term buyers take profit.
A bullish breakout may jump-start the uptrend once again. As the RSI goes muted, 1785 is the first level to gauge the strength of the rebound.
Daily Tecnical Analysis
EUR/USD
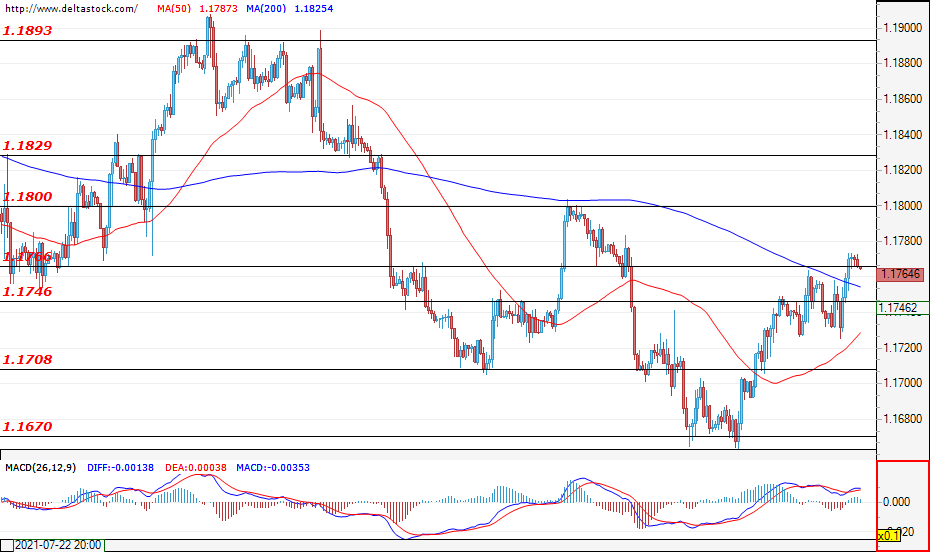
Current level - 1.1764
The forecasts for today's trading session are for the currency pair to test the support at 1.1700 due to the fact that, during the early hours of today's trading session, the EUR/USD bounced from the resistance level at 1.1770. The upward movement that began in the start of the week and led to an appreciation of the euro against the dollar would most probably end, and the pair will likely continue the downtrend which is coming from the higher time frames. Only a breach of the resistance level at 1.1770 would head the pair towards the psychological level of 1.1800. During today’s session, volatility will most likely spike after the U.S. preliminary GDP and the initial jobless claims reports are announced at 12:30 GMT.
| Resistance | Support | ||
| intraday | intraweek | intraday | intraweek |
| 1.1766 | 1.1800 | 1.1746 | 1.1670 |
| 1.1780 | 1.1830 | 1.1708 | 1.1600 |
USD/JPY
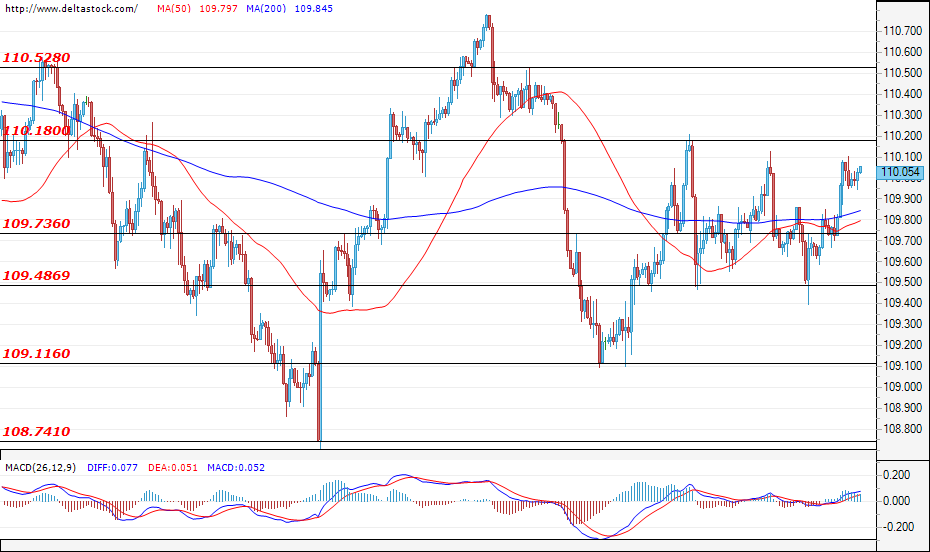
Current level - 110.05
The range movement between 109.48 - 110.18 continues and, at the moment, neither the bulls nor the bears are managing to take control. A breach of any of the mentioned boundaries of the range could draw a clearer direction for investors. There is no planned economic news for today that would affect the volatility of the currency pair.
| Resistance | Support | ||
| intraday | intraweek | intraday | intraweek |
| 110.18 | 110.52 | 109.73 | 109.11 |
| 110.52 | 111.00 | 109.48 | 108.74 |
GBP/USD
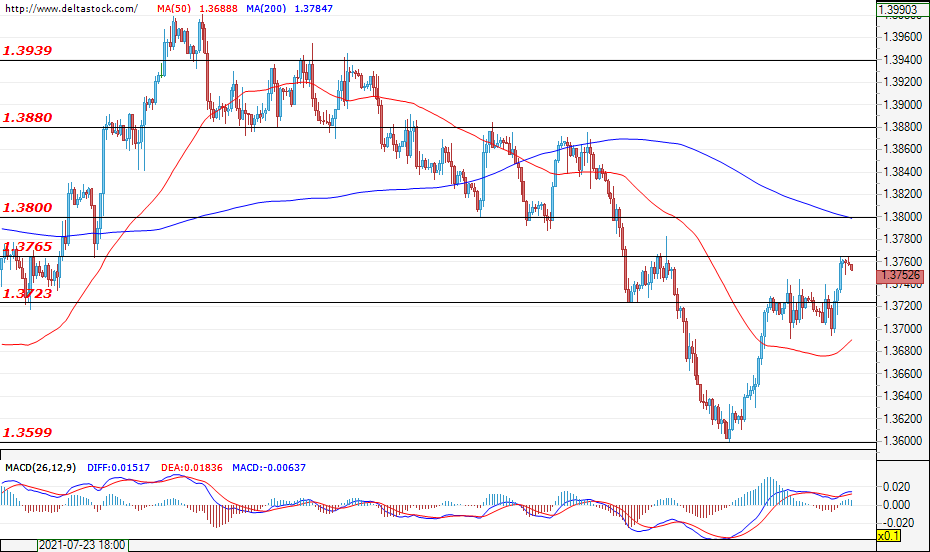
Current level - 1.3752
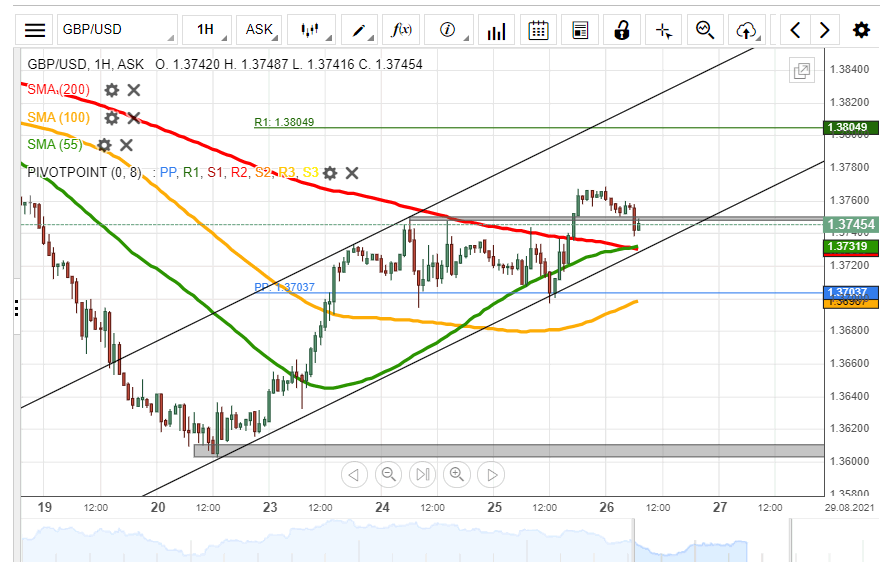
At the time of writing the analysis, the pair is testing the resistance at 1.3765 and the situation is similar to that of the EUR/USD – for an appreciation of the U.S. dollar against the other major currencies. The expectations are for this resistance to remain unbreached and for the upward movement that began in the start of this week to end. In case the GBP/USD successfully breaches the support at 1.3723, this would signal that the corrective move has ended and that the long-term downtrend will continue towards the next target – the support level of 1.3600. In the opposite direction, a breach of the resistance at 1.3765 would be an opportunity for the bulls to lead the pair towards the resistance of 1.3800.
| Resistance | Support | ||
| intraday | intraweek | intraday | intraweek |
| 1.3765 | 1.3880 | 1.3720 | 1.3567 |
| 1.3800 | 1.3939 | 1.3600 | 1.3508 |
EUR/USD Bounces Off Support
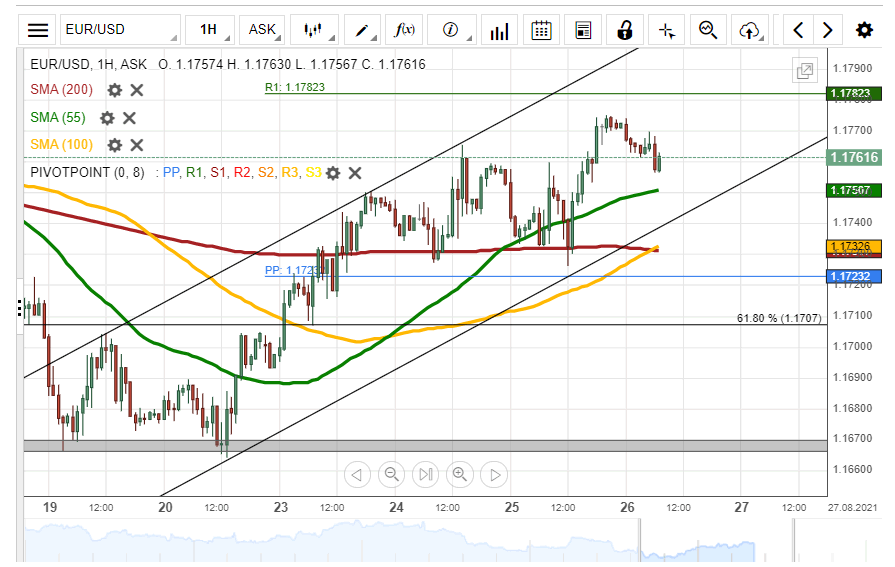
On Wednesday, the EUR/USD currency pair bounced off a support level formed by the 200– hour simple moving average at 1.1729. As a result, the common European currency surged by 43 pips or 0.37% against the US Dollar during Wednesday's trading session.
Technical indicators suggest buying signals on the 4H time-frame chart. Most likely, the exchange rate could continue to edge higher during the following trading session.
However, bullish traders may encounter the weekly resistance level at 1.1782 within this session.
GBP/USD Two Scenarios Likely
On Wednesday, the British Pound surged by 62 pips or 0.46% against the US Dollar. The currency pair breached the weekly resistance line at 1.3750 during Wednesday's trading session.
All things being equal, the exchange rate could continue to trend higher in an ascending channel pattern during the following trading session. The potential target for the GBP/USD pair will be near the 1.3820 area.
However, technical indicators suggest selling signals on the daily time-frame chart. Most likely, the currency exchange rate could make a brief pullback within this session.