Sample Category Title
Bank of Korea raises interest rate, embarking normalization process
Bank of Korea raised interest rate by 0.25% to 0.75% today, becoming the first major Asian economy to hike. "The Board will gradually adjust the degree of monetary policy accommodation as the Korean economy is expected to continue its sound growth and inflation to run above 2% for some time, despite ongoing uncertainties over the virus," the BOK said in its monetary policy statement.
Governor Lee Ju-yeol said, "we've decided to put the focus on reducing financial imbalances, and as we raise the rate, we are embarking on a process of normalizing policy in line with economic recovery."
BoK maintained its forecast of 4% GDP growth this year. Consumer inflation forecast was, however, upgraded from 1.8% to 2.1%.
Elliott Wave View: CADJPY Shows Impulsive Rally
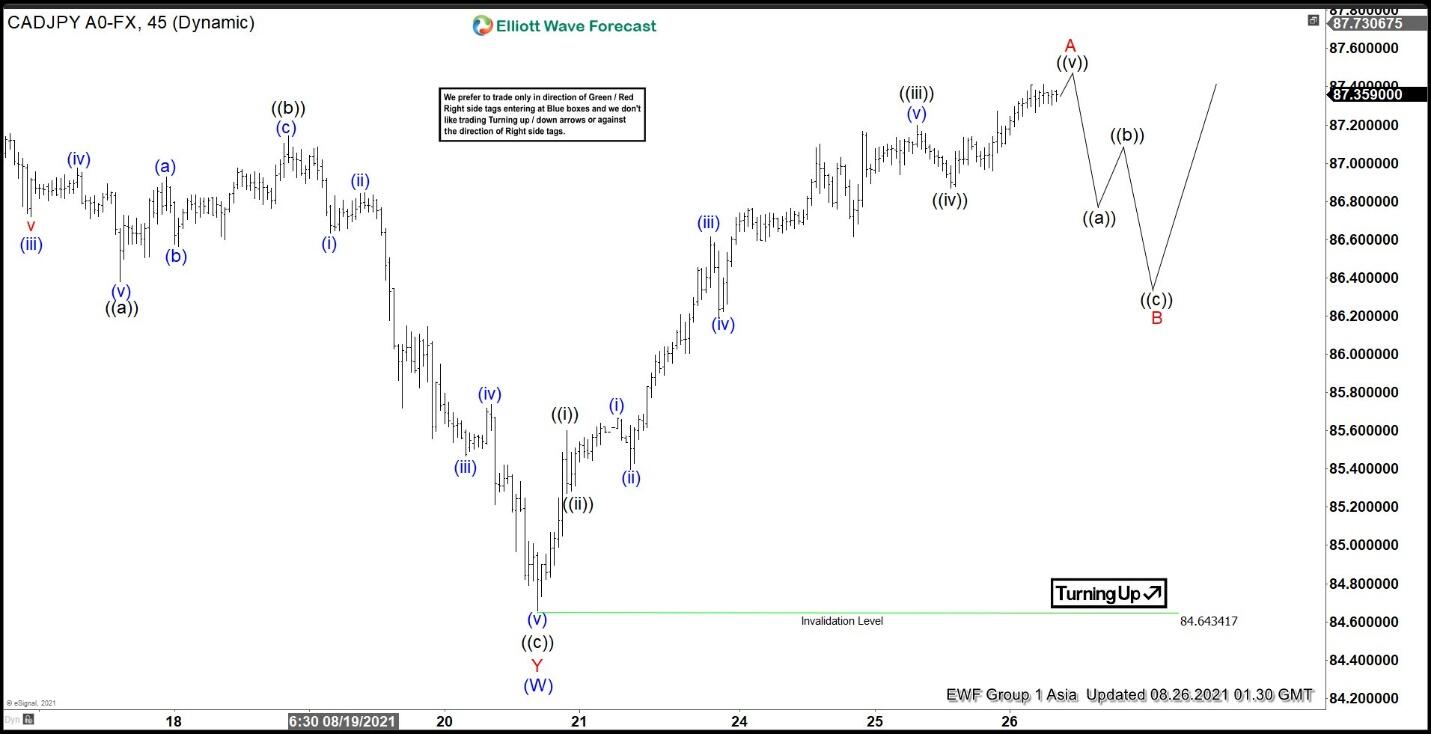
Short-term Elliott wave view in CADJPY suggests that the pullback to 84.64 ended wave (W). Pair is doing a corrective rally in wave (X) which is unfolding as a zigzag Elliott Wave structure. The first leg of the zigzag wave A is in progress as a 5 waves impulse. Up from wave (W), wave ((i)) ended at 85.6 and pullback in wave ((ii)) ended at 85.27. Pair resumes higher again in wave ((iii)) towards 87.2 with internal subdivision as an impulse in lesser degree. Wave (i) of ((iii)) ended at 85.66 and pullback in wave (ii) of ((iii)) ended at 85.39. Pair resumes higher in wave (iii) of ((iii)) towards 86.61, and wave (iv) of ((iii)) ended at 86.19. Wave (v) ended at 87.2 which also completed wave ((iii)).
Afterwards, pair did a pullback in wave ((iv)) which ended at 86.86. Final leg higher wave ((v)) of A is expected to end soon. Expect pair to pullback in wave B to correct the 5 waves rally from August 20 low before the rally resumes. The Internal structure of the pullback is proposed to be unfolding as a zigzag structure in 3 waves. Near term, as far as pivot at 84.64 low stays intact, expect pullback to find support in 3, 7, or 11 swing for further upside.
CADJPY 45 Minutes Elliott Wave Chart
Japan corporate services price rose 1.1% yoy in Jul, on transportation fees
Japan corporate services price index rose 1.1% yoy in July, below expectation of 1.3% yoy. The increase was driven by 1.4% rise in transportation fees, and in particular, with international freight costs up 24.6%. Meanwhile, hotel service fees rose 10.8%, highest in six years, reflecting the impact of the Tokyo Olympics.
"The recent increase in infections will weigh on services producer prices, though we could see service demand perk up if progress in vaccinations help re-open the economy," said Shigeru Shimizu, head of the BoJ's price statistics division.
US 10-year yield jumped as focus turns to Jackson Hole
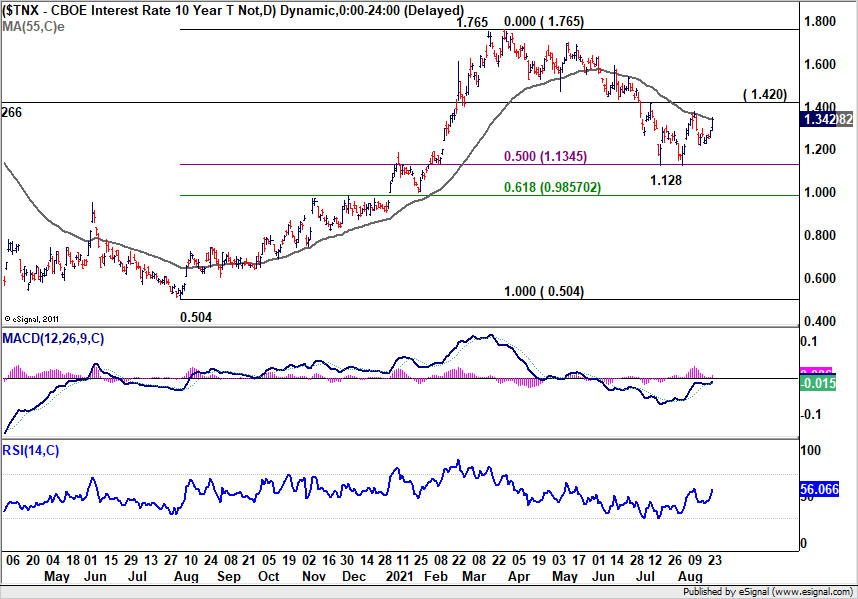
US 10-year yield staged a strong rally overnight, closing up 0.052 at 1.342. The development came as markets are awaiting the highly anticipated Jackson Hole Symposium, which kicks off today. While the main highlight is Fed Chair Jerome Powell's speech on Friday, there would likely be continuous news flow of central banker comments ahead of that.
After Fed hawk Robert Kaplan's comments the possibly of adjusting the timing of tapering, it seems less likely for Fed to make a September announcement. We'll look forward to other Fed officials for guidance, as Powell would act like what he used you be, composed, balanced, but non-inspirational.
Some suggested reading on Jackson Hole:
- Jackson Hole Symposium Preview: Affirming Likelihood of Taper Announcement in November while Striking Balance between Strong Data and Pandemic Resurgence
- What Will the Fed Signal at Jackson Hole?
- Jackson Hole Symposium Preview: Powell Under Pressure
As for 10-year yield, it's back pressing 55 day EMA (now at 1.344) with yesterday's rise. Sustained trading above there, followed by firm break of 1.420 resistance, should confirm that the correction from 1.765 has completed 1.128. That came after hitting 50% retracement at 1.1345. We should then see further rise back to retest 1.1765 high during the rest of the year, as the world is well-vaccinated to live with the coronavirus.
Market Morning Briefing: Aussie Could Hold Below 0.73 In The Near Term
STOCKS
Dow closed on a positive note but the other indices mentioned below closed in the red, dipping slightly from higher levels seen over the last few sessions. We need to watch price action to see if Nifty and sensex can produce a short corrective dip and Shanghai can hold below crucial resistance at 3550 and fall further in the near term. Nikkei also needs to break above 28000 to turn bullish but will it see a corrective dip before rising again? We would wait and watch price action near respective immediate supports and resistance levels.
Dow (35405.50, +39.24, +0.11%) has been rising in line with our expectations. A rise to35500-35750 is expected soon.
DAX (15860.66, -45.19, -0.28%) has dipped slightly after testing 15932 on the upside. Note that 16000 can produce a small corrective dip that could be short lived and extend to 15800-15650 before the upmove resumes again. Watch price action near current levels. A break above 16000 on the flip side will be strongly bullish.
Nikkei (27693.42, -31.38, -0.11%) has come down slightly today. The resistance at 28000 is holding fow now.A strong break above the level of 28000 is needed for the view to be bullish towards 29000.While below 28000, the chances of seeing a fall towards 27000 cannot be negated.
Shanghai (3520.18, -20.20, -0.57%) has come down after testing a high of 3540 yesterday. Note that 3550 is an important resistance on the 3-day candles and while that holds, Shanghai can fall towards 3500-3450 initially while on the broader range there is scope towards 3350 on the downside. A break above 3550 will be needed to make the index strongly bullish.
Nifty (16634.65, +10.05, +0.06%) has come off yesterday after testing the level of 16712.45 in line with our expectations. A corrective fall towards 16500 is possible now before we see a rise towards 16700 and eventually 16800.
Sensex (55944.21, -14.77, -0.026%) has come down after testing 56000. A fall towards 54000 is possible from here before we see an eventual rise towards 57000 in the medium term.
COMMODITIES
Crude prices trade higher ahead of the Fed’s Jackson Hole meeting and on hopes of increase in oil demand after US drug Regulator granted full approval to the Pfizer Inc/BioNTech SE Covid-19 vaccine that is expected to impact the Covid vaccine rates. Brent and WTI may face rejection fro immediate resistance near 72.50 and 68-70 respectively. Failure to face rejection from 72.50 on Brent can open up chances of a further rise to 75 before the expected fall takes place. Gold trades lower while Silver is up today. Copper will have to break above 4.30 to rise further and while below 4.30, a dip to 4.20/4.00 cannot be ruled out.
Brent (71.80) has risen today and is likely to test 72.50 before coming off from there. Failure to fall from 72.50 will open up chances of a possible test of 75 on the upside before a sharp decline sets it. We would initially look at price action near 72.50 which is expected to produce a rejection over the next 1-2 sessions.
WTI (67.81) can test 68-70 before the expected dip is seen.
Gold (1791.20) has dipped to test 1788 before bouncing from there. If the bounce holds, we may expect a re-test of 1800-1810 region in the near term else a fall back towards 1770/65 cannot be ruled out. Watch price action near current levels.
Silver (23.84) has risen from levels seen yesterday and could be headed towards 24 in the next few sessions. A sustained and strong rise above 24 is needed to negate bearishness towards 23-22.50 in the medium term.
Copper (4.2505) has dipped as the interim resistance near 4.30 seems to be holding well. A fall to 4.00 is possible on a break below 4.20. Else the price needs to rise above 4.30 to head higher.
FOREX
Dollar Index has fallen sharply ahead of the Jackson Hole meeting due tomorrow pulling up Euro to levels above 1.1750. Euro needs to hold above 1.1750 to trade higher else it can fall back to lower levels soon. Similarly support at 92.50 is expected to hold on Dollar-Index. Aussie, Pound and EURJPY have risen well but a small corrective dip could be expected in the next few sessions before resumption of upmove again. USDINR may fall back towards 74.10/74.00 while broad range of 74.0-74.50 is likely to hold in the medium term. Dollar Yen and USDCNY is ranged for now.
Dollar Index (92.88) has fallen sharply ahead of the Jackson Hole meeting scheduled tomorrow. A test of 92.50/60 is possible before the index bounces higher again. Failure to hold above 92.50 will turn bearish opening up chances of a fall to 92. Watch price action near 92.60/50 on a further dip from current levels.
Euro (1.1763) rose to test immediate trend resistance at 1.1774 before dipping slightly from there. While the resistance holds, Euro can come down towards 1.1748-1.1730 in the near term. A break above 1.1774-1.18 will be needed for it to turn bullish again.
EURJPY (129.38) has dipped from 129.50 and could dip further towards 129 before bouncing back from there. A broad range of 128-130.50 continues to hold in the medium term.
Dollar-Yen (109.99) has risen as expected but the broad range of 109-110.50 continues to hold unless a sustained break on either side is seen. There is resistance near 110.20-110.50 from where the pair can again face rejection.
Aussie (0.7263) could hold below 0.73 in the near term. A corrective dip to 0.7250/30 looks possible before it bounces back again to higher levels.
Pound (1.3753) has dipped slightly from 1.3766 and could fall towards 1.37 before again rising up sharply.
USDCNY (6.4820) has risen and could head towards 6.49/50 in the near term. A broad range of 6.50-6.45 can hold for the medium term.
USDINR (74.25) closed above 74.20 yesterday but selling is seen on the NDF markets that quotes 74.11 just now indicating a possible decline in the pair today. A broad range of 74.50-74.00 is likely to hold for the medium term within which the pair is likely to trade within 74.10-74.30 region for most of the time. The movement in the Dollar-Rupee has been sideways and unable to give clarity on further direction. At such times we would like to wait for a clear break out on either side of the mentioned range that would turn out to be a sharp movement to be seen soon. For now watch for a possible dip to 74.10 today. The RBI will be keen to prevent a month close below 74.
INTEREST RATES
The US Treasury yields have risen well and have room to move up further ahead of the Jackson Hole meeting tomorrow. Strong resistances are ahead which we expect to hold. Can the yields come down again following the Fed Chairman’s speech at Jackson Hole tomorrow? We will have to wait and see. The German yields have moved up and are in a corrective rally now. A further rise is possible from here before the broader downtrend resumes. The 5Yr GoI is stuck in a narrow range and looks mixed in the near-term with equal chances of moving on either side from here.
The US 2Yr (0.24%) Treasury yield remains stable while the 5Yr (0.83%), 10Yr (1.34%) and the 30Yr (1.95%) have risen further sharply. The 10Yr has risen past 1.3% and can now head towards 1.4%-1.45%. The 30Yr can surge to 2.1% on a break above 2%. The price action thereafter will need a close watch to see if the yields are reversing lower again or not.
The German 2Yr (-0.75%), 5Yr (-0.71%), 10Yr (-0.42%) and 30Yr (0.04%) yields have moved up sharply especially at the far-end. The expected corrective rally is happening now. The 10Yr can go up to -0.30%/-0.25% and the 30Yr to 0.10%-0.15% in the coming days. Thereafter we expect a fresh fall and the broader downtrend can resume again.
The 5Yr GOI (5.6854%) is stuck in a narrow range of 5.68%-5.72% over the last few days. The near-term outlook is mixed. A breakout on either side of 5.68%-5.72% can take it up to 5.74%-5.76% or drag it down to 5.66%-5.62%. Broadly, 5.62%-5.76% could be the range of trade.
Gold Price Faces Resistance, US GDP Next
Key Highlights
- Gold price started a strong upward move from the $1,680 region.
- It broke a key bearish trend line with resistance at $1,788 on the 4-hours chart.
- Crude oil price recovered above $65.00, but it is still well below $70.00.
- The US GDP could grow 6.7% in Q2 2021 (preliminary), up from 6.5%.
Gold Price Technical Analysis
Earlier this month, gold price saw a sharp decline below $1,750 against the US Dollar. The price even declined below $1,700 before the bulls appeared near $1,680.
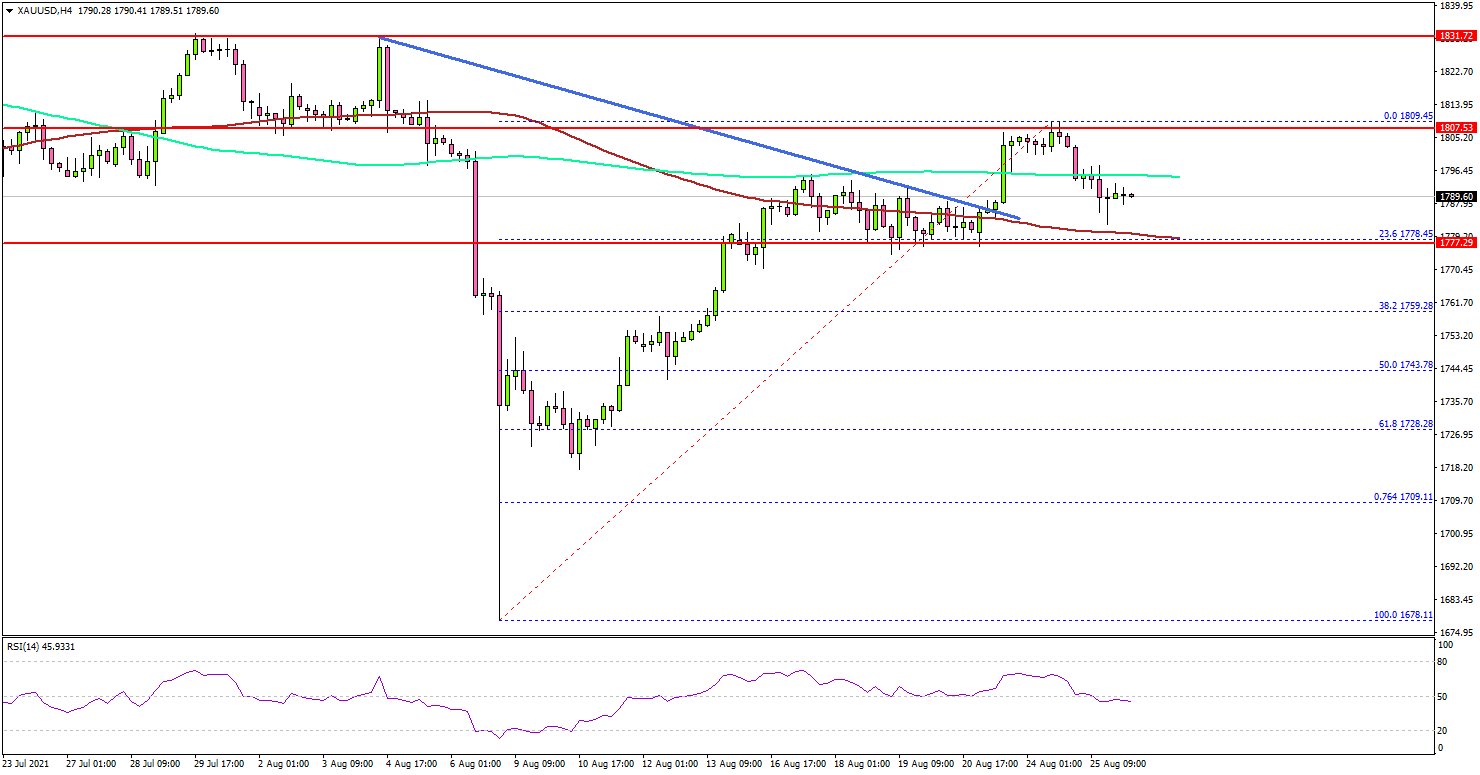
The 4-hours chart of XAU/USD indicates that the price traded as low as $1,678. Recently, there was a strong recovery wave above the $1,720 and $1,750 resistance levels.
There was a break above a key bearish trend line with resistance at $1,788. The pair surpassed the $1,800 level, the 100 simple moving average (red, 4-hours), and the 200 simple moving average (green, 4-hours).
However, there was no upside continuation above $1,810. A high is formed near $1,808 and the price is now correcting gains. On the downside, there is a major support forming near $1,778 and the 100 simple moving average (red, 4-hours).
The 23.6% Fib retracement level of the upward move from the $1,678 swing low to $1,808 high is also near $1,778. If there is a downside break below $1,778, the price could correct lower towards $1,750.
The next major support could be $1,743 or the 50% Fib retracement level of the upward move from the $1,678 swing low to $1,808 high. On the upside, the price is facing resistance near $1,808 and $1,810.
The main resistance sits near $1,830, above which the price could rise towards $1,850. Looking at EUR/USD, the pair could attempt a recovery wave above the 1.1800 zone. Besides, GBP/USD could test the main 1.3800 resistance zone.
Economic Releases to Watch Today
- US Initial Jobless Claims - Forecast 350K, versus 348K previous.
- US Gross Domestic Product Q2 2021 (Preliminary) – Forecast 6.7% versus previous 6.5%.
Eco Data 8/26/21
[php_everywhere instance="1"]
Bitcoin – Poised for a Correction?
Running on fumes after 70% rally
Bitcoin has enjoyed a good run this past month but recent rallies are struggling to generate much momentum, which suggests a corrective move may be on the cards.
There was a lot of excitement as bitcoin broke back above $50,000 for the first time since May but it wasn’t long until profit-taking once again kicked in.
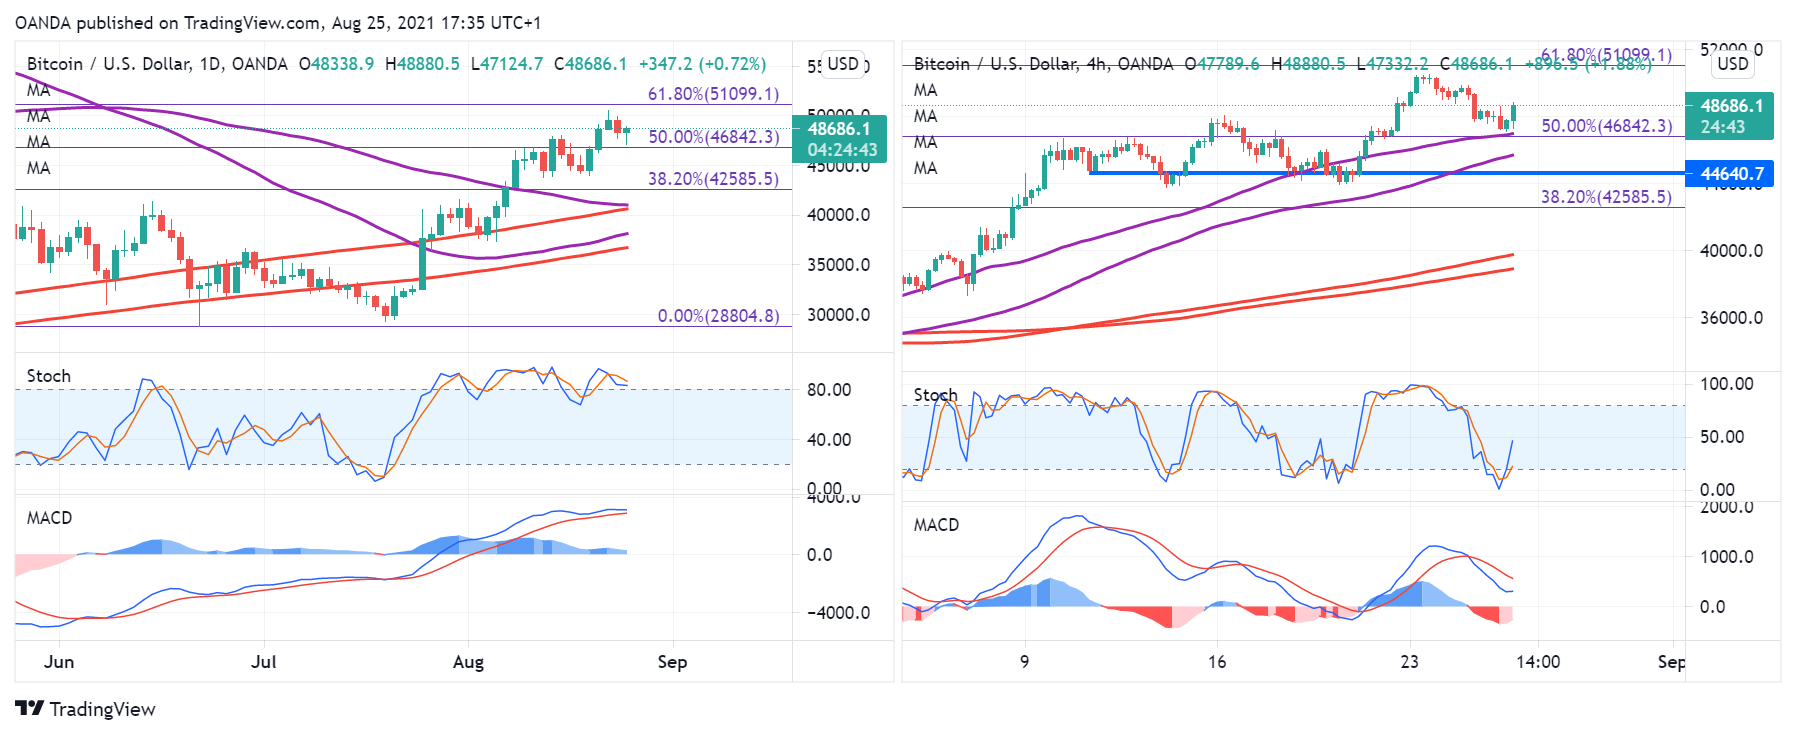
There is resistance around $51,000 – the 61.8% retracement of the April highs to June lows – which may be contributing to the profit-taking we appear to be seeing.
The momentum indicators on the daily chart are also both showing divergences – lower highs as price action makes new highs – which is another sign that the trend is weakening.
A correction would be interesting at this point, with bitcoin having rallied more than 70% in a little over a month.
Not exactly extraordinary for bitcoin considering what we’ve become accustomed to but still very substantial. The longer-term still looks bullish but perhaps a correction would be healthy.
With bitcoin having tracked the 55/89 SMA band higher on the 4-hour chart, a move below here could signal a correction is underway.
Markets Steady ahead of Jackson Hole
Back on the fence
A relatively muted session on Wednesday as investors sit on the fence ahead of the Jackson Hole Symposium later in the week.
It’s all gone very quiet in the markets, which is hardly surprising under the circumstances. The combination of light news flow, few economic releases and caution ahead of the Jackson Hole event has taken all of the excitement out of the markets. Instead, it’s been replaced by nervous anticipation as we wait to see what the Fed will do next.
Frankly, I wouldn’t be surprised if this turns out to be one big anticlimax, with Powell saying very little of note and instead insisting that the data will dictate any decisions in the upcoming meetings. In other words, the Chairman may simply kick the can down the road and buy the central bank a few more weeks.
Rather sensible in the grand scheme of things. But it may not do much for these markets unless it’s accompanied by something more substantial. If not, then the next few weeks may see plenty more of this kind of inactivity, as anticipation builds ahead of the September meeting.
Durable goods orders provide cause for optimism
US durable goods orders remained strong in July despite a slight dip in the headline number driven by a drop in Boeing aircraft purchases.
These are very volatile large orders which is why the core number is often a better reflection of spending habits. Core orders rose 0.7% – ahead of expectations – while the June reading was also revised higher by 0.2%.
While recent PMIs suggest growth may have slowed a little, which could be reflected in future orders, the US continues to look in a healthy position and that should be reflected in the data in the longer term.
Large cash piles and a willingness to invest is exactly what the economy needs. Supply chains and staffing issues may take the edge off in the near term.
Oil stabilises after a bumper start to the week
Oil prices have seen their resurgence grind to a halt on Wednesday, following a remarkable start to the week.
A 15% decline between early July and late August has been followed by a 10% rally this week alone as new Chinese Covid cases fell to zero, putting at ease concerns about more severe restrictions and lower growth.
The rally began to falter on Tuesday as API reported a weekly draw of only 1.622 million barrels, a little short of expectations. Prices did recover early in Europe but once again ran into a wall as we moved into the US session. This came around the 50% retracement level – July highs to August lows – and shortly after the durable goods orders release.
What we’re probably seeing is just a bit of profit-taking in choppy trading, with the 50% level providing a perfect opportunity. We have seen a small bounce after EIA reported a larger drawdown of three million barrels but prices are still largely flat on the day.
Gold rally hangs on Powell comments
Gold is also seeing some profit-taking after a bumper couple of weeks.
The yellow metal managed to break above $1,800 but failed to generate any significant momentum. There was plenty of resistance just above here, with gold rotating off the 200-day SMA before heading lower.
A move above here would have been a very bullish signal and could still come if Powell fails to signal that a taper is likely this year. While the 200-day SMA was the turning point this time, this also falls around key Fibonacci levels and a significant area of resistance over the last couple of months. A move above $1,833 could be very bullish.
Taper talk around the September decision could kill hopes of $1,800 before it even had a chance at a serious run above it. Perhaps it’s this fear that’s triggering the profit-taking we’re seeing in gold after a very good run in recent weeks. The yellow metal has rallied roughly 6% since the flash crash, not a bad return considering how bad things were looking at that point.
AUD/USD: Bulls are Pausing and Awaiting Fresh Signals from Jackson Hole Event
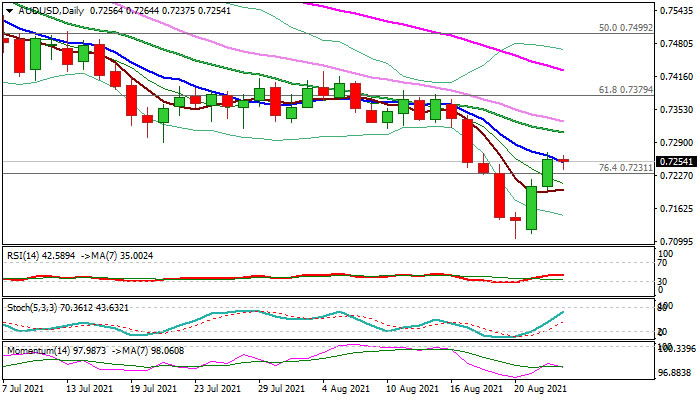
The AUDUSD is holding within narrow consolidation on Wednesday, after Mon-Tue bounce retraced over a half of last week’s sharp bearish acceleration which hit a multi-month low at 0.7106.
Fresh bulls faced strong headwinds from falling 10DMA (0.7252) while rising bearish momentum on daily chart also caused recovery to lose steam.
Traders await the outcome of Jackson Hole symposium which starts on Thursday with central bankers’ rhetoric likely to signal near-term direction.
Hawkish stance would inflate the US dollar on expectations for early tapering and policy tightening that would bring Aussie dollar under fresh pressure.
Also, deteriorating health situation on record new Covid-19 infections in some parts of Australia, would contribute to bearish sentiment.
On the other side, the Aussie would receive fresh boost if the US central bankers keep dovish stance, however overall picture would remain soured by worsened health conditions that may limit recovery.
Res: 0.7289; 0.7310; 0.7329; 0.7372
Sup: 0.7237; 0.7200; 0.7142; 0.7106