Sample Category Title
Silver Price Hits Historic Record Around $64
On 27 November, we suggested that silver was preparing to challenge its all-time high. Since then (marked with the orange arrow), XAG/USD has risen by roughly 18%, breaking above the psychological $60-per-ounce threshold for the first time in history.
The rally has been driven by strong retail inflows into silver ETFs, alongside expectations of a structural supply deficit by 2026 due to robust industrial demand—particularly from solar energy, electric vehicles, and data-centre infrastructure.
The weakening of the US dollar following the Federal Reserve’s decision on Wednesday also helped lift dollar-denominated silver to a new historic peak near $64.
Technical Analysis of XAG/USD
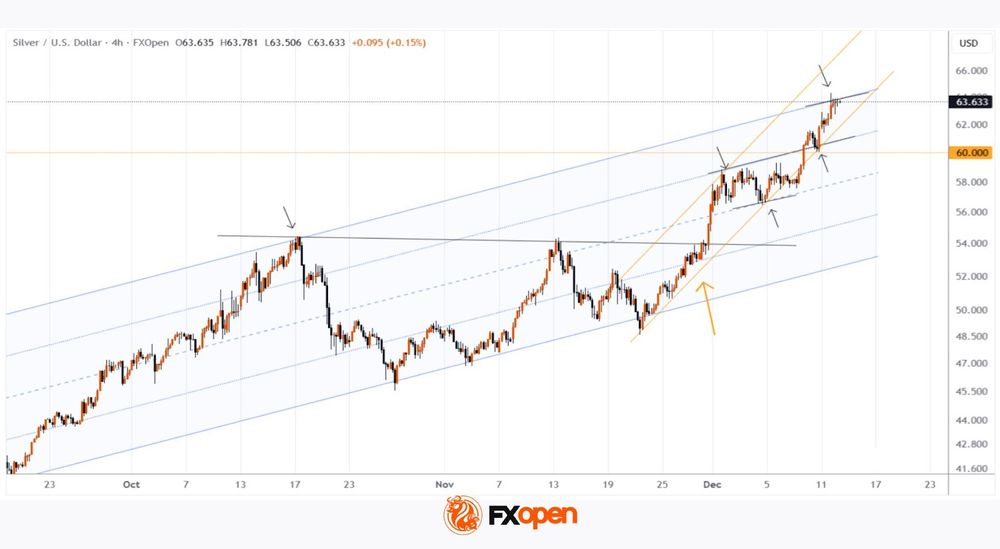
A review of the XAG/USD chart shows that the price has been moving within a rising channel that encapsulates the uptrend beginning in early September.
Within this structure:
→ the channel median acted as a springboard for price growth on 4 December;
→ the line dividing the upper half of the channel into quarters switched from resistance (earlier in the month) to support on 10 December;
→ silver is now trading near the channel’s upper boundary, which may behave as significant resistance (as it did in mid-October).
Given these factors, the market may now be heavily overheated, leaving it vulnerable to a correction. Should this scenario begin to unfold, we could see a bearish break of the steep upward trajectory that has lifted silver by around 30% from the 21 November low.
Start trading commodity CFDs with tight spreads. Open your trading account now or learn more about trading commodity CFDs with FXOpen.
This article represents the opinion of the Companies operating under the FXOpen brand only. It is not to be construed as an offer, solicitation, or recommendation with respect to products and services provided by the Companies operating under the FXOpen brand, nor is it to be considered financial advice.
XBR/USD Chart Analysis: Price Rebounds from a Seven-Week Low
On 1 December, we outlined a descending channel on the XBR/USD chart and noted that the bearish trend was driven by fading geopolitical risks. Indeed, hopes for an end to the war in Ukraine—along with the possibility of sanctions on Russia being eased—acted as a bearish catalyst.
In addition, the International Energy Agency reaffirmed its forecast for a record supply surplus and highlighted that global inventories have reached a four-year high.
Under the influence of these and other factors, such as signs of a slowdown in the Chinese economy, Brent crude fell to a seven-week low at point A. However, today the XBR/USD chart shows a bullish reversal, again triggered by geopolitics, according to media reports:
→ The United States has intercepted a sanctioned Venezuelan tanker, which Caracas described as an “act of piracy”.
→ Ukraine has struck another vessel from the “shadow fleet” linked to Russia’s oil trade.
Technical Analysis of XBR/USD
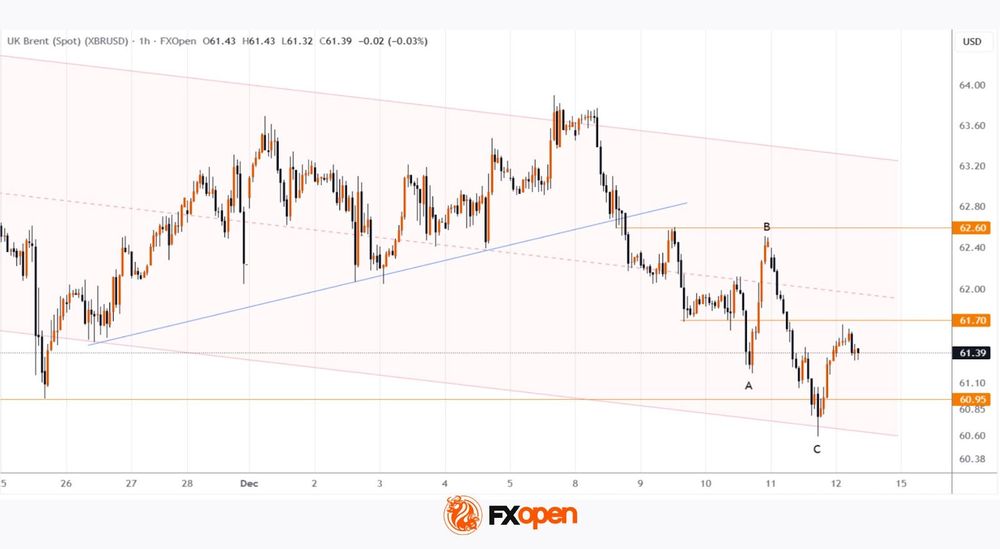
From a bearish perspective:
→ the $62.60 level (where the blue trendline was broken) remains a significant resistance zone;
→ bulls failed to preserve the gains from the A→B rally, as the price sank further to the low at point C;
→ the nearest resistance lies around $61.70.
From a bullish perspective:
→ the lower boundary of the channel may continue to act as support;
→ Brent crude has rebounded convincingly after a false bearish break below the November low—an indication of a potential liquidity grab, suggesting that “smart money” may be siding with demand.
Given these factors, geopolitical tensions may intensify, potentially driving XBR/USD back towards the median of the descending channel.
Start trading commodity CFDs with tight spreads. Open your trading account now or learn more about trading commodity CFDs with FXOpen.
This article represents the opinion of the Companies operating under the FXOpen brand only. It is not to be construed as an offer, solicitation, or recommendation with respect to products and services provided by the Companies operating under the FXOpen brand, nor is it to be considered financial advice.
EUR/USD Daily Outlook
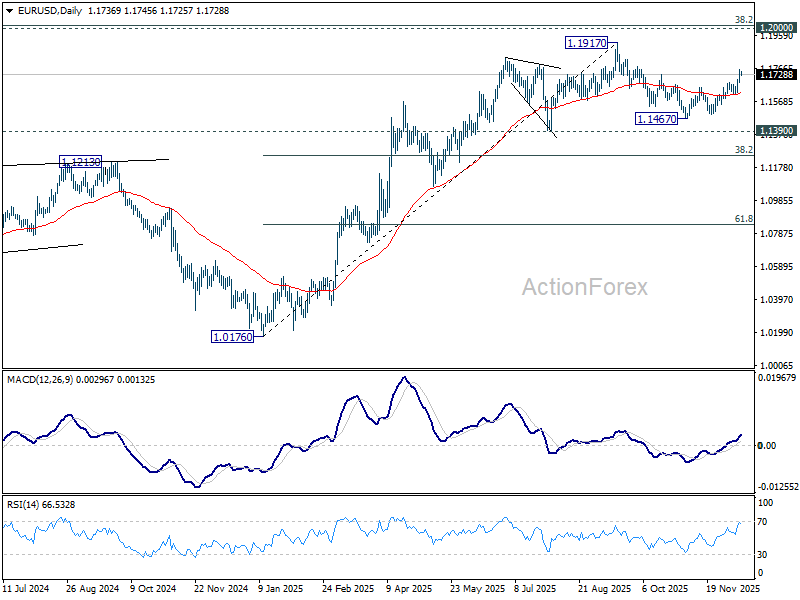
Daily Pivots: (S1) 1.1692; (P) 1.1727; (R1) 1.1773; More….
EUR/USD's rally from 1.1467 is in progress and intraday bias stays on the upside. Current development suggests that fall from 1.1917 has completed as a correction to 1.1467. Further rally should be seen to retest 1.1917 high. For now, risk will stay on the upside as long as 1.1614 support holds, in case of retreat.
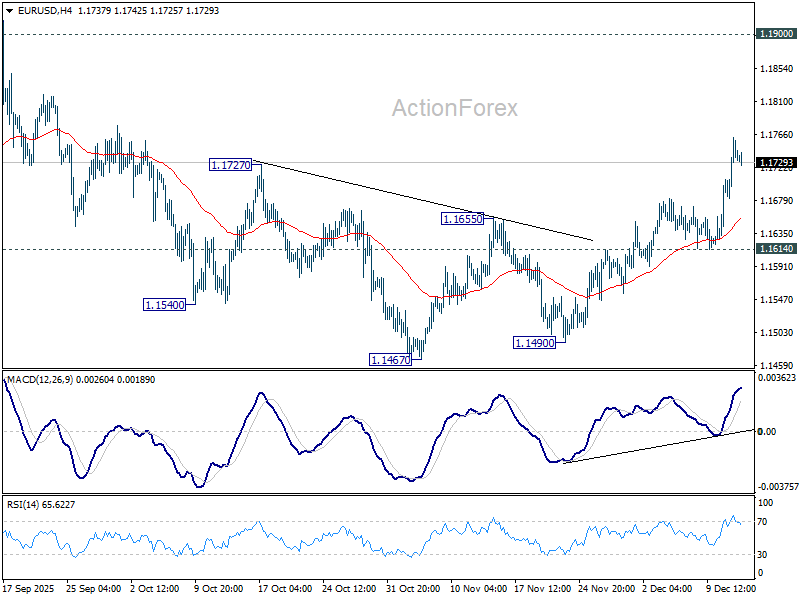
In the bigger picture, as long as 55 W EMA (now at 1.1346) holds, up trend from 0.9534 (2022 low) is still in favor to continue. Decisive break of 1.2 key psychological level will carry larger bullish implication. However, sustained trading below 55 W EMA will argue that rise from 0.9534 has completed as a three wave corrective bounce, and keep long term outlook bearish.
USD/JPY Daily Outlook
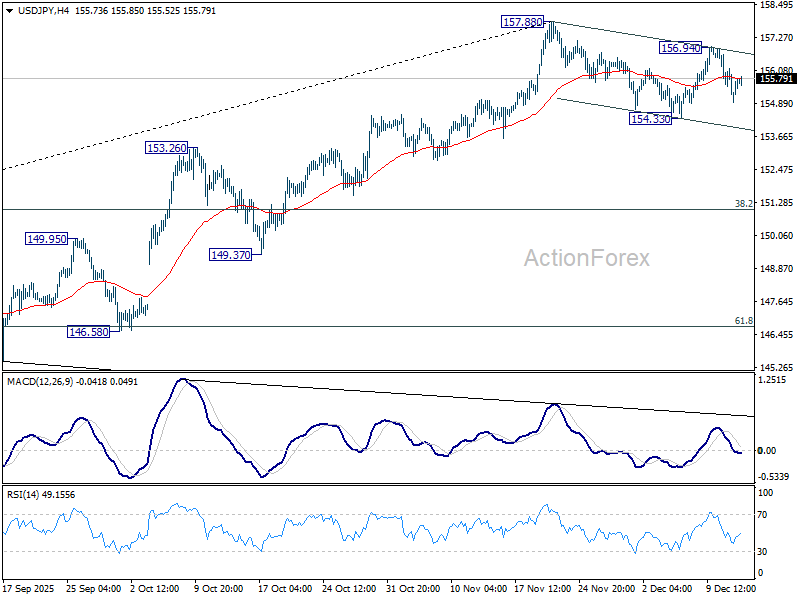
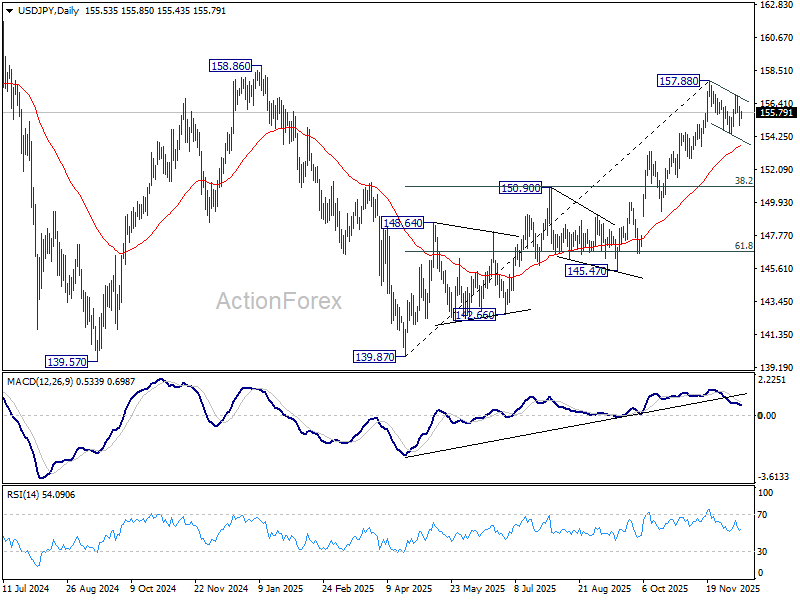
Daily Pivots: (S1) 154.95; (P) 155.56; (R1) 156.17; More...
USD/JPY is still extending the corrective pattern from 157.88 and intraday bias remains neutral. On the downside, break of 154.33 will target 55 D EMA (now at 153.58) and possibly below. On the upside, above 156.94 will bring retest of 157.88. Firm break there will resume whole rally from 139.87 to 158.85 key structural resistance.
In the bigger picture, corrective pattern from 161.94 (2024 high) could have completed with three waves at 139.87. Larger up trend from 102.58 (2021 low) could be ready to resume through 161.94 high. Decisive break of 158.85 structural resistance will solidify this bullish case and target 161.94 for confirmation. On the downside, break of 150.90 resistance turned support will dampen this bullish view and extend the corrective range pattern with another falling leg.
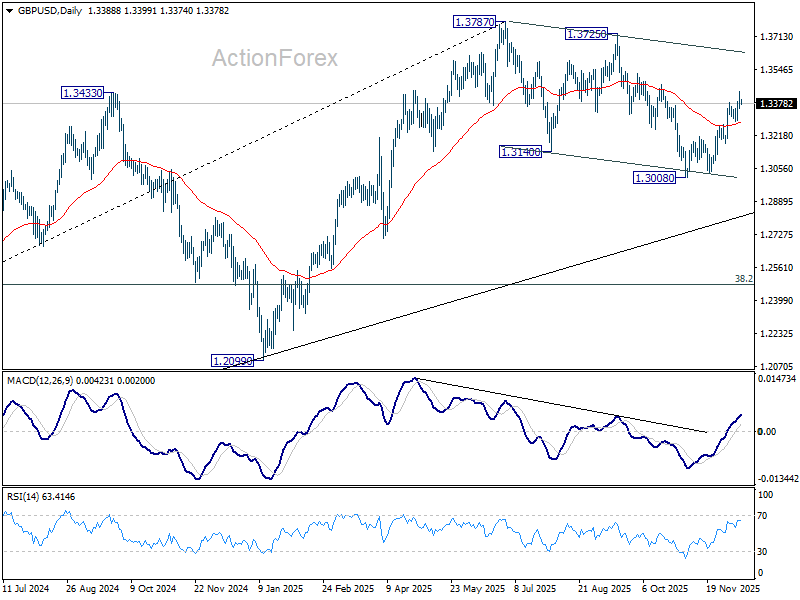
GBP/USD Daily Outlook
Daily Pivots: (S1) 1.3349; (P) 1.3393; (R1) 1.3432; More...
Intraday bias in GBP/USD remains on the upside as rise from 1.3008 is in progress. As noted before, fall from 1.3787 should have completed as a three-wave correction to 1.3008. Firm break of 1.3470 resistance will pave the way to retest 1.3787 high. Further rally is expected as long as 1.3286 support holds, in case of retreat.
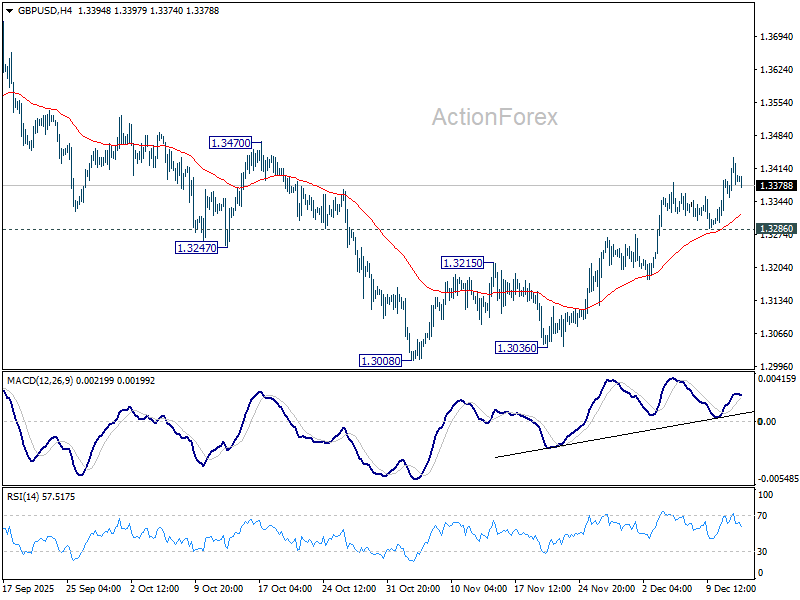
In the bigger picture, current development suggests that fall from 1.3787 is merely a corrective move, and larger rise from 1.0351 (2022 low) is still in progress. Firm break of 1.3787 will target 1.4248 (2021 high) key structural resistance. This will remain the favored case as long as target 38.2% retracement of 1.0351 to 1.3787 at 1.2474 holds, in case of another fall.
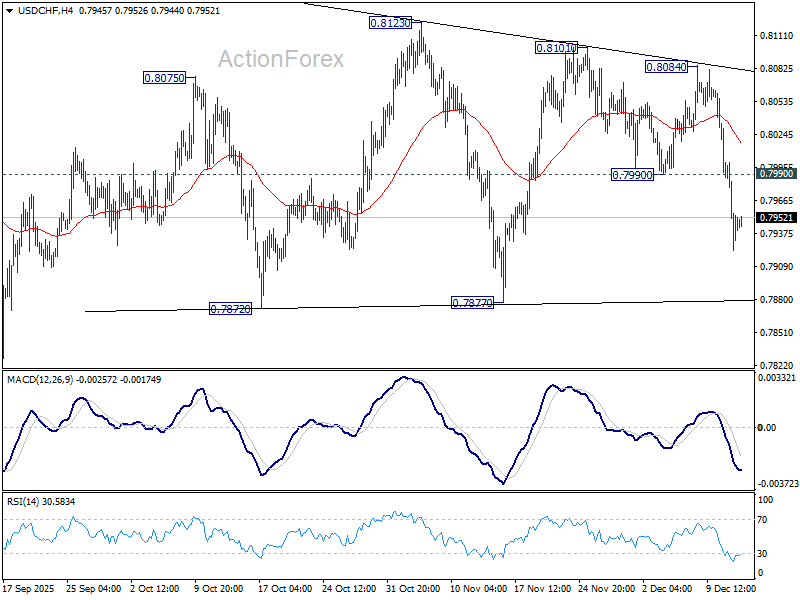
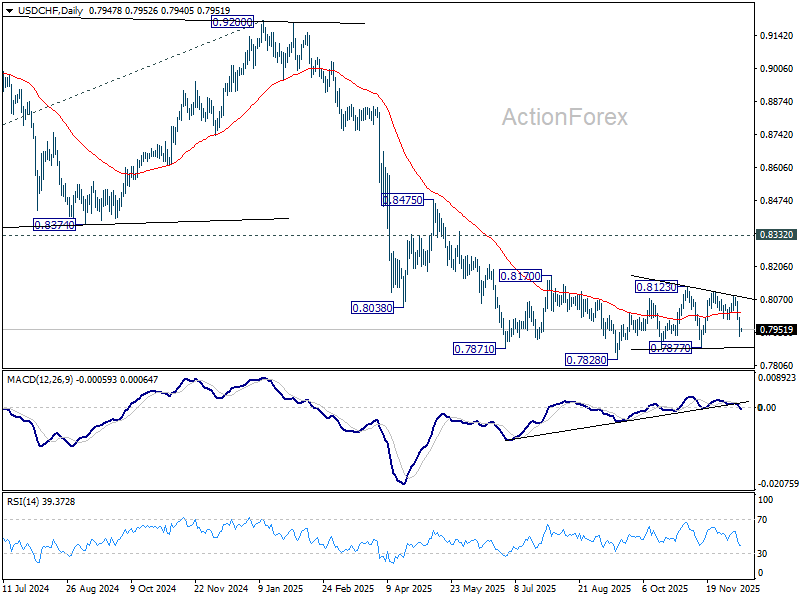
USD/CHF Daily Outlook
Daily Pivots: (S1) 0.7917; (P) 0.7961; (R1) 0.7998; More…
Intraday bias in USD/CHF remains on the downside for 0.7877 support. Firm break there will argue that large down trend is ready to resume through 0.7828 low. ON the upside, though above 0.7990 support turned resistance will turn intraday bias neutral again first. Overall, price actions from 0.7828 are seen as a corrective pattern that might still extend further.
In the bigger picture, outlook will stay bearish as long as 0.8332 support turned resistance holds (2023 low). Long term down trend from 1.0342 (2017 high) is still in progress. Next target is 100% projection of 1.0146 (2022 high) to 0.8332 from 0.9200 at 0.7382.
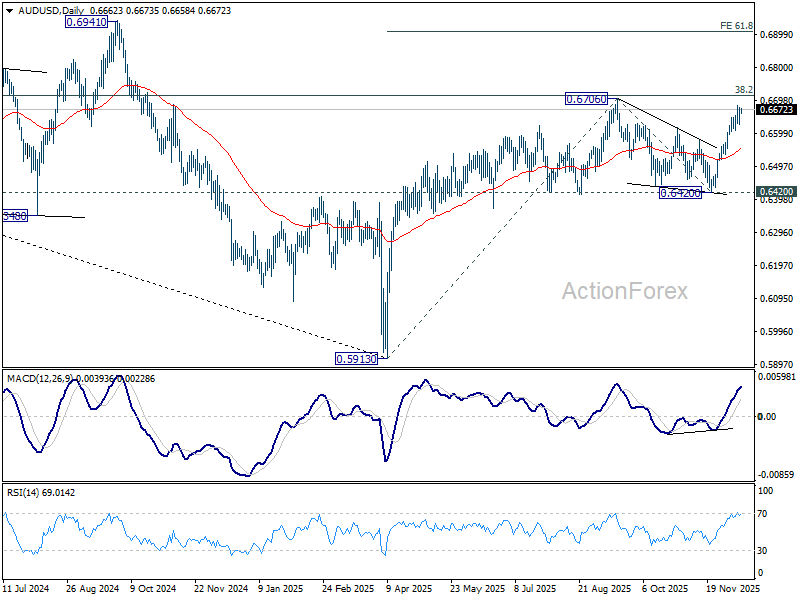
AUD/USD Daily Report
Daily Pivots: (S1) 0.6635; (P) 0.6657; (R1) 0.0.6687; More...
Intraday bias in AUD/USD remains neutral and more consolidations could be seen below 0.6685 temporary top. On the upside, above 0.6685 will target a retest of 0.6706 high. Decisive there will confirm up trend resumption, and target 61.8% projection of 0.5913 to 0.6706 from 0.6420 at 0.6910. However, break of 55 D EMA (now at 0.6549) will extend the corrective pattern from 0.6706 with another falling leg.
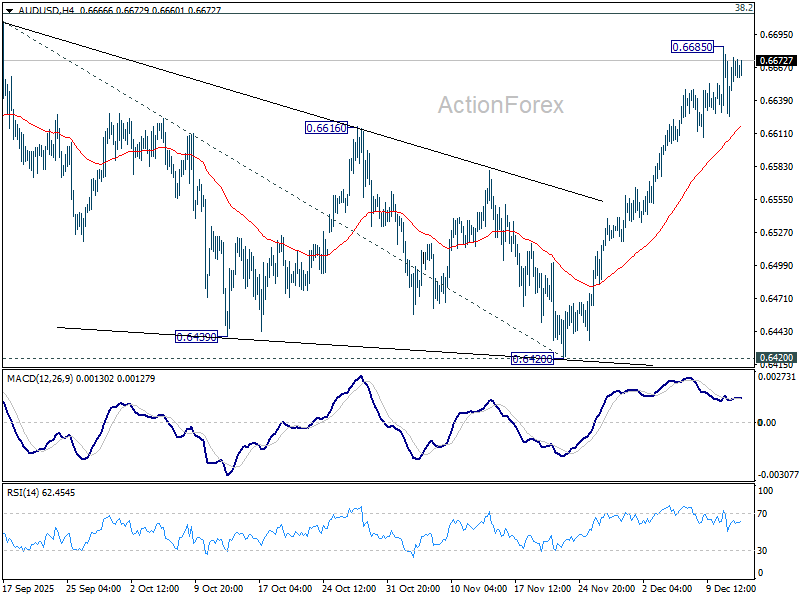
In the bigger picture, the break of multi-year falling trend line resistance suggests that rise from 0.5913 is possibly reversing whole down trend from 08006 (2021 high). Decisive break of 38.2% retracement of 0.8006 to 0.5913 at 0.6713 will solidify this case, and bring further rally to 61.8% retracement at 0.7206. On the downside, however, firm break of 0.6420 support will suggest rejection by 0.6713 and retain medium term bearishness.
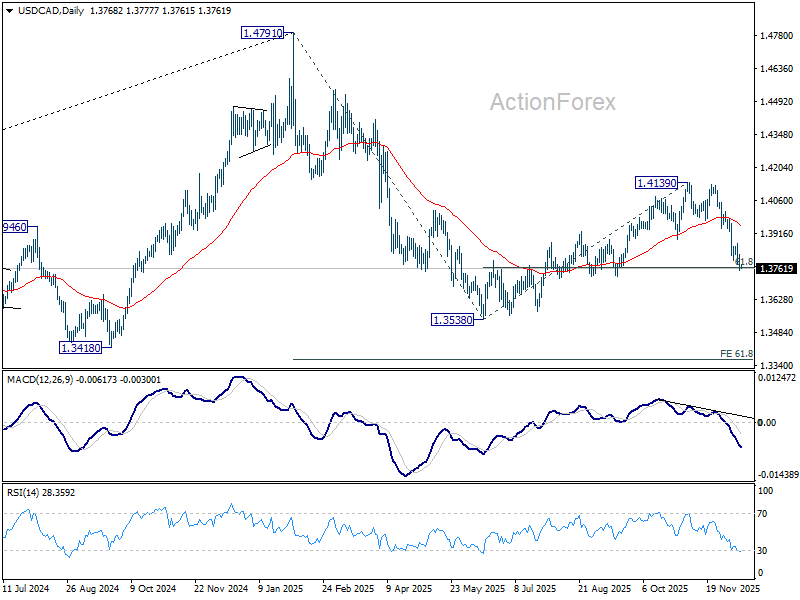
USD/CAD Daily Outlook
Daily Pivots: (S1) 1.3744; (P) 1.3783; (R1) 1.3810; More...
Intraday bias in USD/CAD remains on the downside for the moment. Sustained break of 61.8% retracement of 1.3538 to 1.4139 at 1.3768 will extend the fall from 1.4391 towards 1.3538 low. On the upside, above 1.3870 minor resistance will turn intraday bias neutral again first.
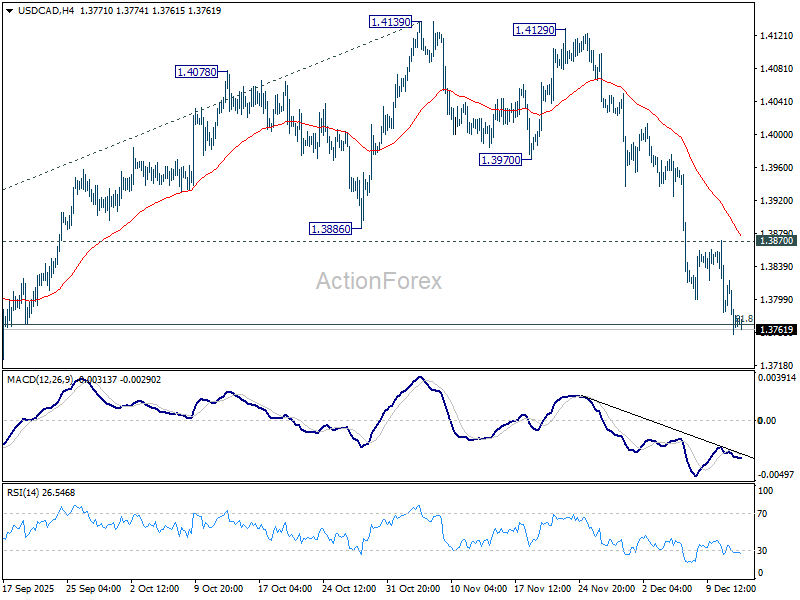
In the bigger picture, current development suggests that price actions from 1.4791 is developing into a deeper, larger scale correction. In the less bearish case, it's just correcting the rise from 1.2005 (2021 low). But even so, break of 1.3538 will pave the way to 61.8% projection of 1.4791 to 1.3538 from 1.4139 at 1.3365. This will remain the favored case as long as 1.4139 resistance holds, in case of rebound.
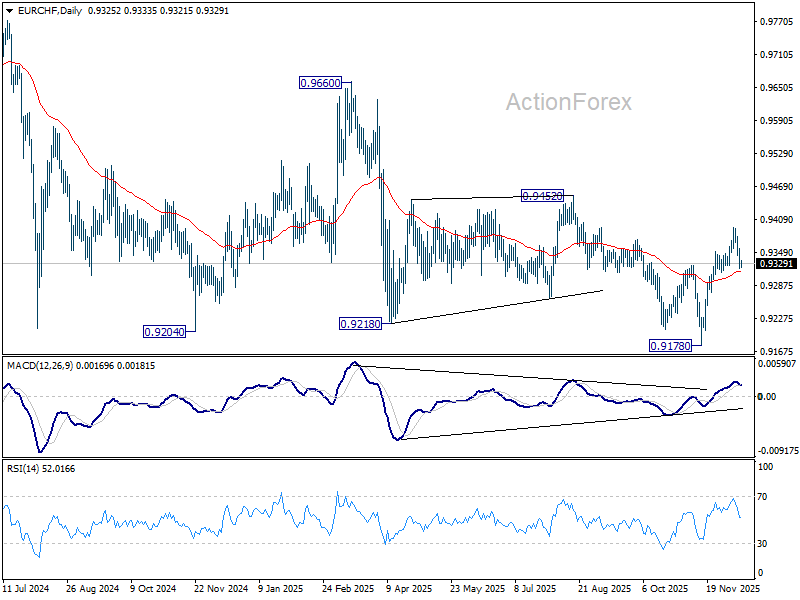
EUR/CHF Daily Outlook
Daily Pivots: (S1) 0.9317; (P) 0.9340; (R1) 0.9358; More....
Intraday bias in EUR/CHF remains neutral for the moment. Further rise is expected with 0.9325 support intact. On the upside, above 0.9394 will resume the rebound from 0.9178 to 0.9452 key structural resistance. Decisive break there will carry larger bullish implications. Nevertheless, firm break of 0.9325 will bring deeper fall through 55 D EMA (now at 0.9313) and below.
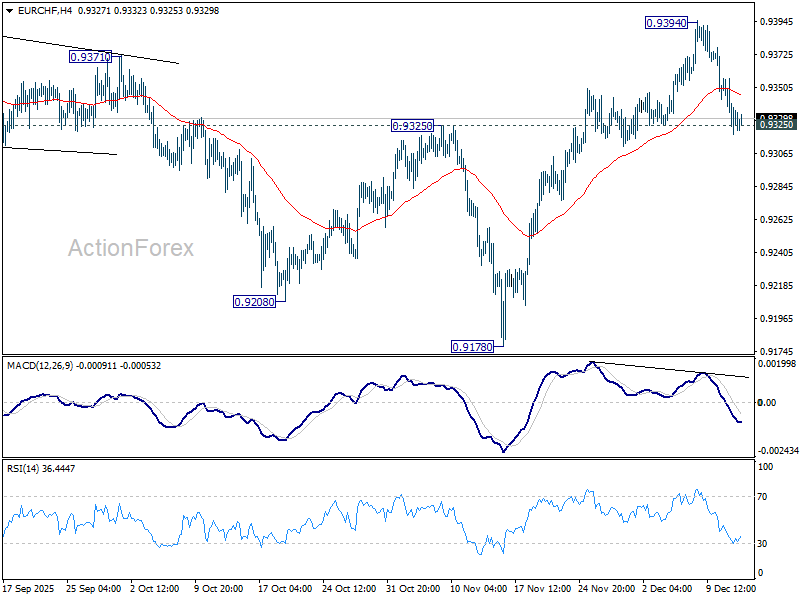
In the bigger picture, EUR/CHF has breached long term falling channel resistance as the rebound from 0.9278 extends. Considering bullish convergence condition in W MACD, sustained trading above 55 W EMA (now at 0.9372) will indicate medium term bottoming, and suggests that it's already in larger scale rebound. Further break of 0.9452 resistance will bring stronger medium term rally towards 0.9228 resistance next. Nevertheless, rejection by 55 W EMA will retain bearishness for another fall through 0.9278 at a later stage.
GBP/JPY Daily Outlook
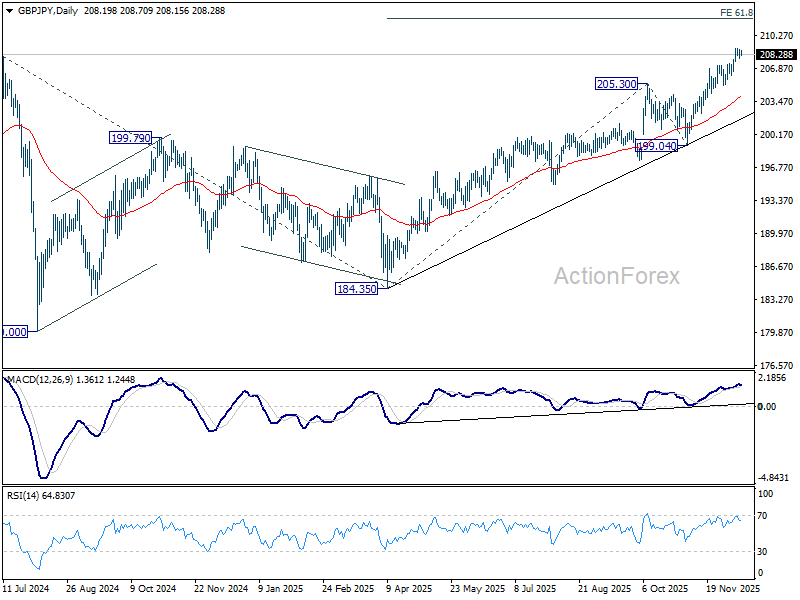
Daily Pivots: (S1) 207.83; (P) 208.32; (R1) 208.73; More...
Intraday bias in GBP/JPY is turned neutral and some consolidations would be seen below 208.92 temporary top. Further rally is expected as long as 205.17 support in case of retreat. On the upside, break of 208.92 will resume larger up trend to 61.8% projection of 184.35 to 205.30 from 199.04 at 211.98.
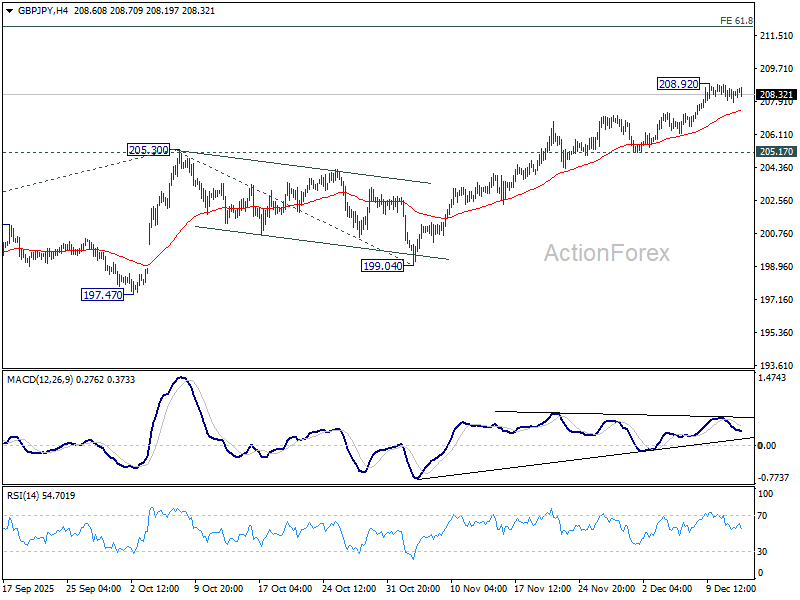
In the bigger picture, up trend from 123.94 (2020 low) is resuming. Next target is 61.8% projection of 148.93 to 208.09 from 184.35 at 220.90. On the downside, break of 199.04 support is needed to be the first sign of medium term topping. Otherwise, outlook will stay bullish even in case of deep pullback.