
Sample Category Title
Sunset Market Commentary
Markets
Yesterday’s Fed decision left markets with some kind of ‘glass half full, glass halve empty’ dichotomy. As such, the Fed message should be supportive for overall market/risk sentiment. Some optimists even might have discerned some Goldilocks features from a scenario that includes higher growth, easing inflationary pressures and the Fed Chair elaborating on solid productivity growth. The Fed engaging in ‘technical measures’ to guarantee ample liquidity also should give comfort. Still, this good news occurs in an environment where most Fed governors feel their room of maneuver restrained by upside inflation risks and at the same time developing labour market weakness. With policy rate entering ‘within the range of plausible neutral estimates’ any further easing can’t occur on some kind of ‘autopilot’. The end of the cycle is coming close and further steps will have to finely checked against incoming data and the perceived risk balance. Short-term US money/interest rate markets perfectly capture this balanced set-up. Money markets continue to see the 3% neutral area as the bottom of current cycle. Highly negative growth/labour market news is needed for a break below that level. The 2-y yield in the run-up to yesterday’s Fed meeting moved to the top of the 3.40/3.65% trading range. Despite the Fed Chair (and the dots) signaling a high bar for further easing, a topside break was still was rejected. At 3.51% the 2-y yield now again trades perfectly in the middle of that range, awaiting upcoming data evidence to help markets make up there mind on the pace at which the Fed might return to that 3% neutral level. In this respect, jobless claims jumped to 236k from an extremely low 192k the previous week. The biggest move since the start of the pandemic is probably affected by statistical noise due to Thanksgiving. Whatever, US yields for now easily maintain/extend yesterday’s decline with changes between -5 bps (5-y) and -3.5 bps (30-y & 2-y). EMU yields are taking a breather after the recent sharp rise. German yields are changing less than 2 bp across the curve. European equity markets initially failed to join yesterday’s positive reaction in the US post-Fed. Disappointing Oracle sales and high capital spending rekindled investor concerns on AI-related valuations. However, some dip-buying soon kicked in. The Eurostoxx 50 gains about 0.6% and trades less than 1.5% from its al time record. The S&P 500 opens 0.35% in red, but futures are well of the intraday lows.
Most significant follow-through price action post-Fed occurs in the dollar. After a setback yesterday, DXY (at 98.33) dropped below first minor support at 98.76/98.57 (recent low/Oct 28 low). EUR/USD in a similar move finally captures the 1.17 big figure. USD/JPY drops to 155.15 area (from 156), in a pure dollar move. EUR/JPY (182.15) holds near the all-time top. The Aussie dollar this time lags the rally in non-USD currencies, after a strong RBA driven rally of late and weaker than expected labour market data published this morning.'
News & Views
The Hungarian forint trades volatile today with Hungarian bonds dropping (bear steepening up to +7 bps at 10-yr) on reports that PM Orban is playing with the idea of becoming President. Hungarian parliament yesterday approved a law making it harder for lawmakers to remove a president from the post in the future. In the run-up to pivotal April parliamentary elections, which Fidesz risks losing for the first time since returning to power in 2010, parliament could exploit its supermajority to turn the current ceremonial presidential role into something way more powerful. The current presidential term only expires in 2029 but president Sulyok is a known Fidesz ally.
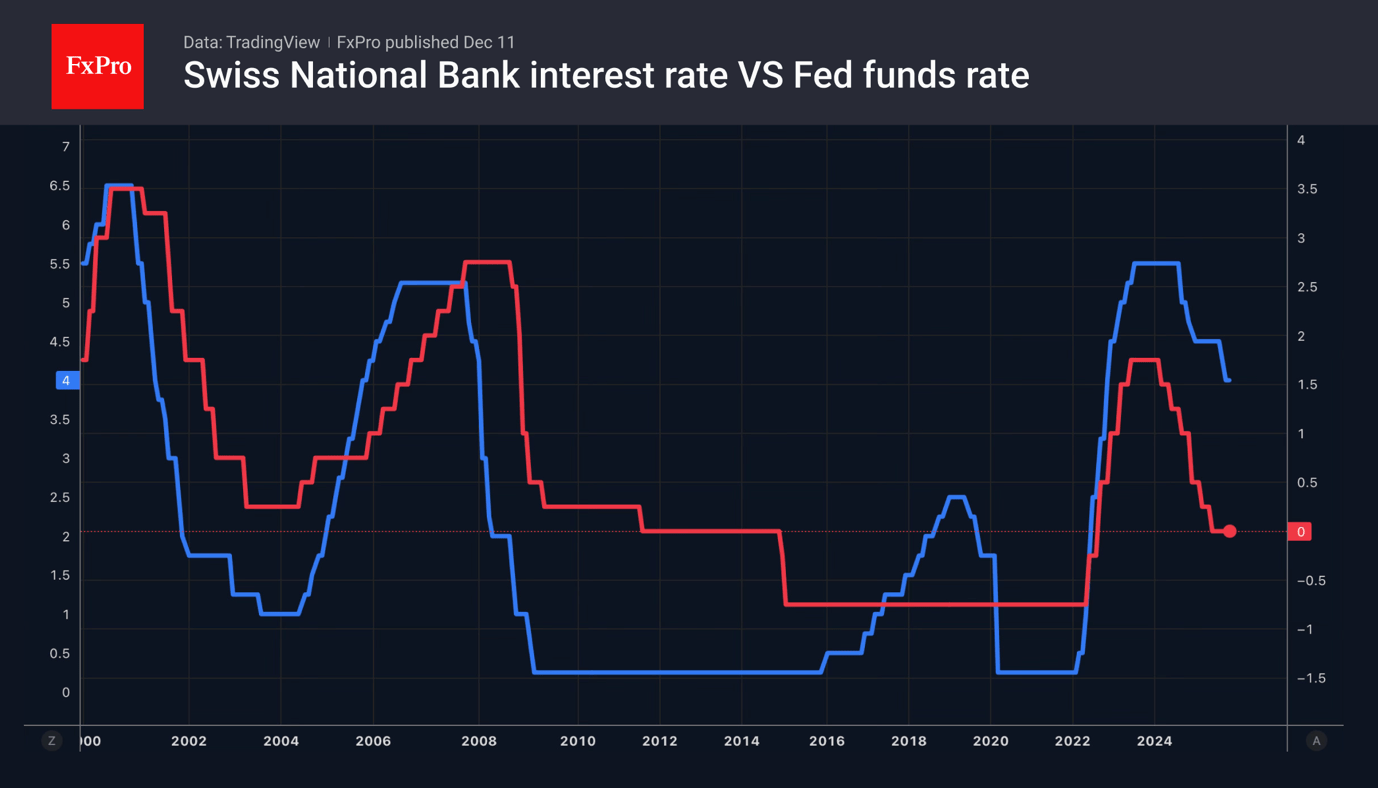
The Swiss National Bank left its policy rate unchanged at 0%. The expansionary policy helps ensure a slow rise in inflation in coming quarters. The central bank’s conditional (stable rates over policy horizon) inflation forecast puts average annual inflation at 0.2% for this year, 0.3% for next and 0.6% for 2027; slightly lower compared with September (0.5% for 2026 & 0.7% for 2027) and within the 0%-2% target zone. Swiss GDP contracted in the third quarter, mainly because of the pharmaceuticals industry, which continued to see countermoves following an extremely strong Q1 in anticipation of possible US tariffs. The economic outlook for has improved slightly due to the lower US tariffs and somewhat better developments globally. For 2025 as a whole, SNB expects GDP growth of just under 1.5%. For 2026, they expect growth of around 1%. Unemployment is likely to continue to rise somewhat. As usual, the SNB mentions a willingness to be active in the FX market as necessary. The Swiss franc slightly outperforms today with EUR/CHF trading at 0.9330 from a start at 0.9360.
EUR/USD Mid-Day Outlook
Daily Pivots: (S1) 1.1646; (P) 1.1673; (R1) 1.1724; More….
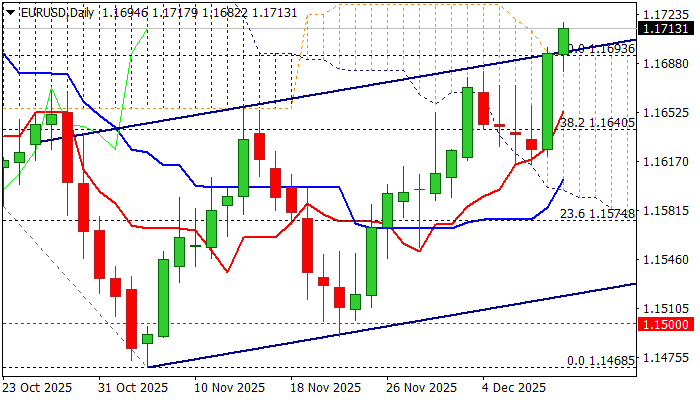
Intraday bias in EUR/USD remains on the upside at this point. The break of 1.1747 resistance should confirm that fall form 1.1917 has completed as a correction to 1.1467. Further rally should be seen to retest 1.1917 high. For now, risk will stay on the upside as long as 1.1614 support holds, in case of retreat.
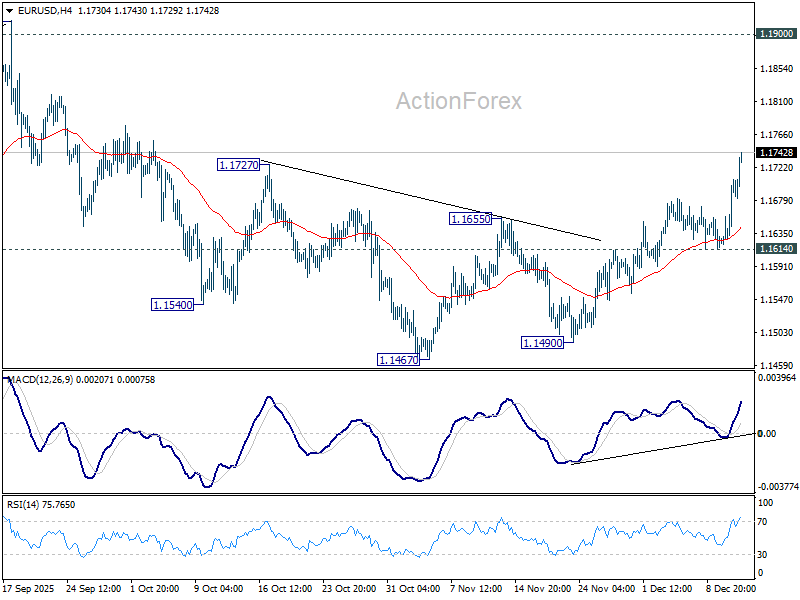
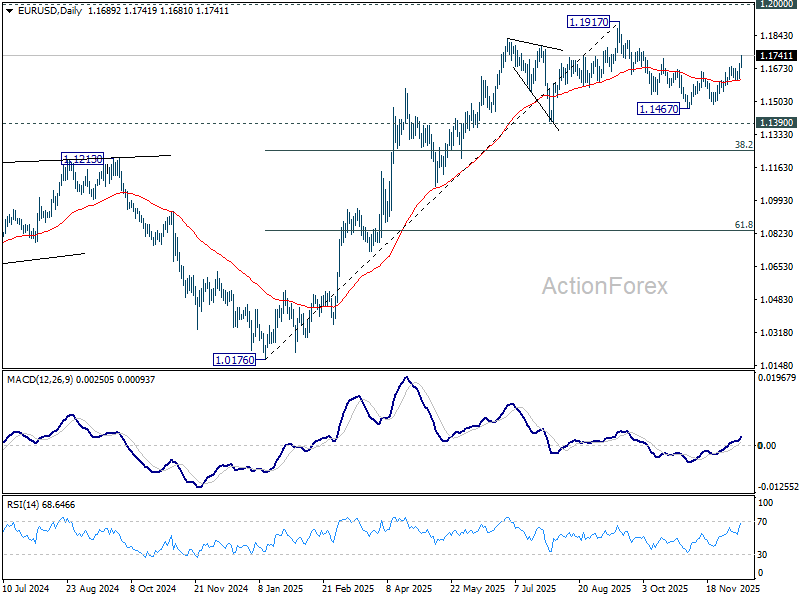
In the bigger picture, as long as 55 W EMA (now at 1.1346) holds, up trend from 0.9534 (2022 low) is still in favor to continue. Decisive break of 1.2 key psychological level will carry larger bullish implication. However, sustained trading below 55 W EMA will argue that rise from 0.9534 has completed as a three wave corrective bounce, and keep long term outlook bearish.
GBP/USD Mid-Day Outlook
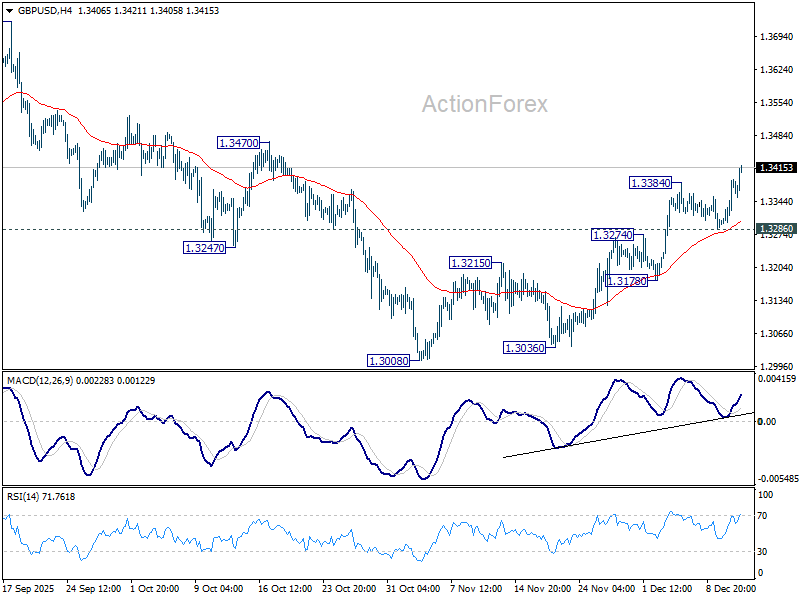
Daily Pivots: (S1) 1.3323; (P) 1.3356; (R1) 1.3416; More...
GBP/USD's rise from 1.3008 resumed by breaking through 1.3384 and intraday bias is back on the upside. As noted before, fall from 1.3787 should have completed as a three-wave correction to 1.3008. Firm break of 1.3470 resistance will pave the way to retest 1.3787 high. Further rally is expected as long as 1.3286 support holds, in case of retreat.
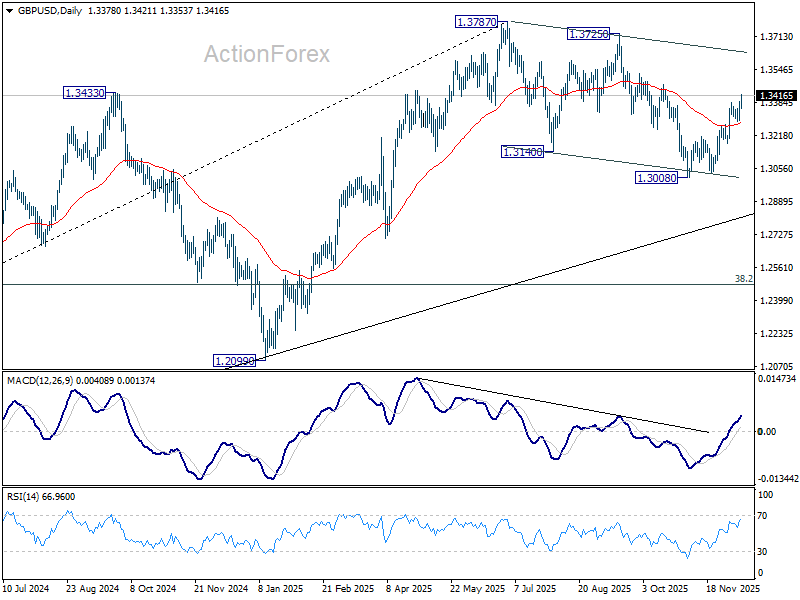
In the bigger picture, current development suggests that fall from 1.3787 is merely a corrective move, and larger rise from 1.0351 (2022 low) is still in progress. Firm break of 1.3787 will target 1.4248 (2021 high) key structural resistance. This will remain the favored case as long as target 38.2% retracement of 1.0351 to 1.3787 at 1.2474 holds, in case of another fall.
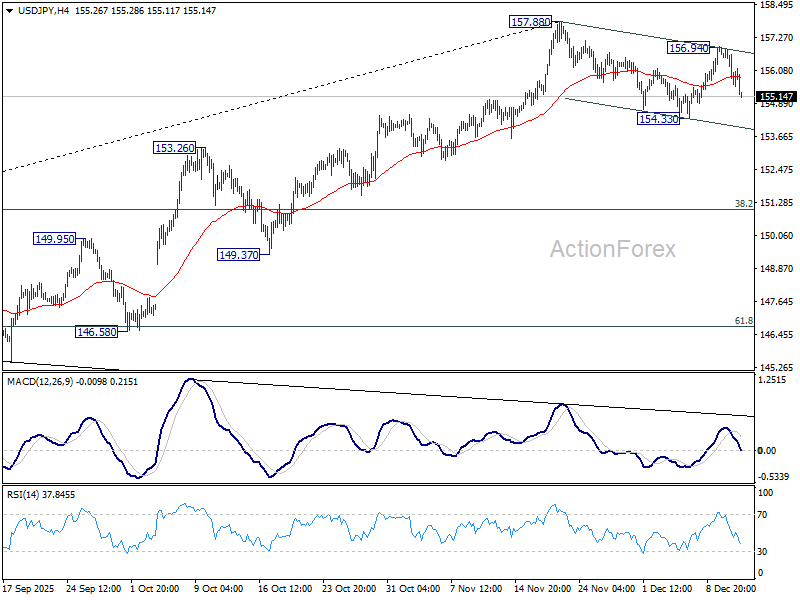
USD/JPY Mid-Day Outlook
Daily Pivots: (S1) 155.58; (P) 156.26; (R1) 156.72; More...
Intraday bias in USD/JPY stays neutral first. Corrective pattern from 157.88 could extend lower. Break of 154.33 will target 55 D EMA (now at 153.51). On the upside, above 156.94 will bring retest of 157.88. Firm break there will resume whole rally from 139.87 to 158.85 key structural resistance
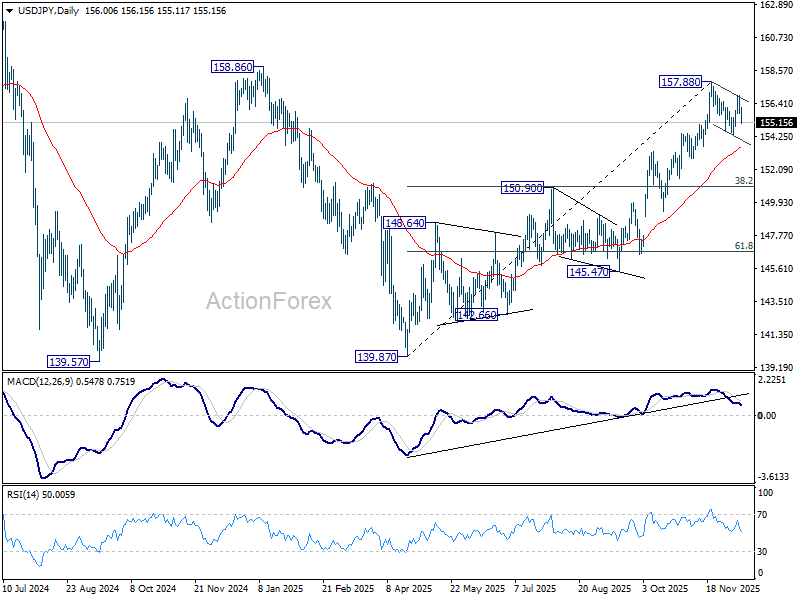
In the bigger picture, corrective pattern from 161.94 (2024 high) could have completed with three waves at 139.87. Larger up trend from 102.58 (2021 low) could be ready to resume through 161.94 high. Decisive break of 158.85 structural resistance will solidify this bullish case and target 161.94 for confirmation. On the downside, break of 150.90 resistance turned support will dampen this bullish view and extend the corrective range pattern with another falling leg.
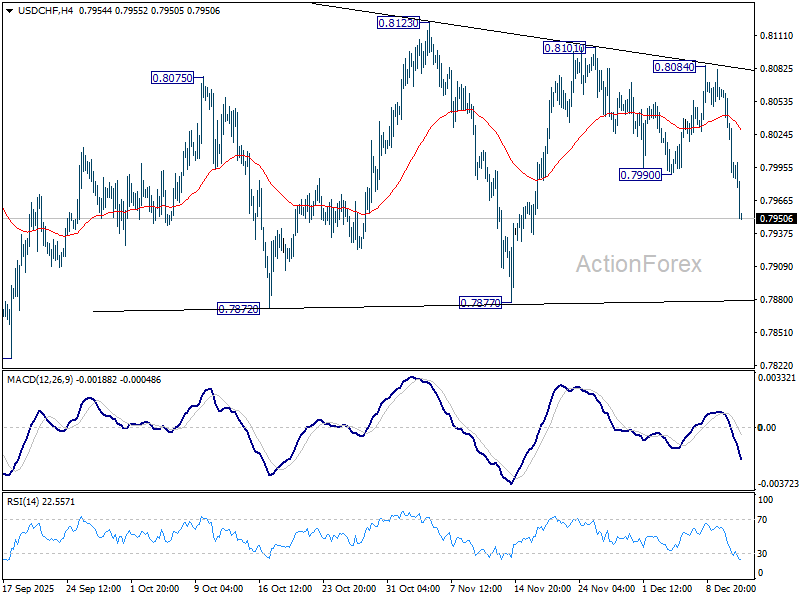
USD/CHF Mid-Day Outlook
Daily Pivots: (S1) 0.7970; (P) 0.8022; (R1) 0.8053; More…
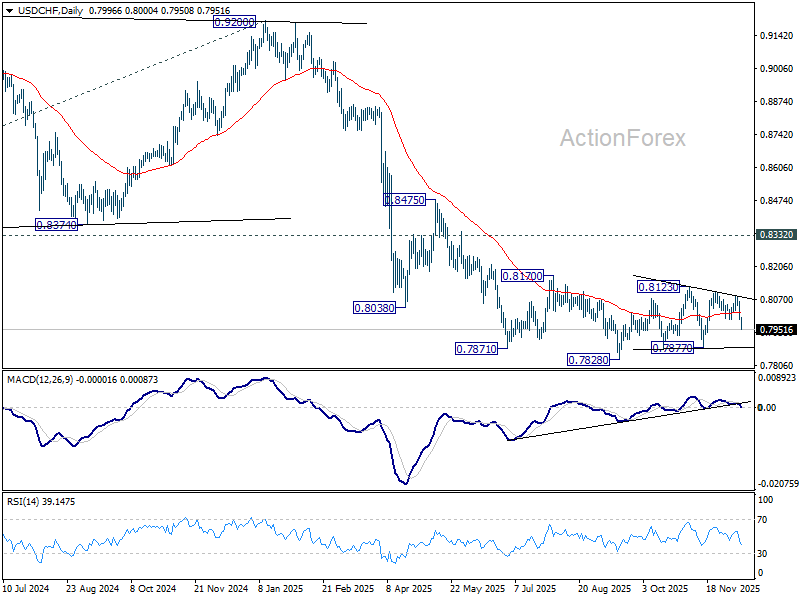
USD/CHF's fall from 0.8101 resumes through 0.7990 and intraday bias is back on the downside. Further fall should be seen to 0.7877 support. Overall, price actions from 0.7828 are seen as a corrective pattern and might extend. Nevertheless, firm break of 0.7877 will argue that larger down trend might be ready to resume through 0.7828 low.

In the bigger picture, outlook will stay bearish as long as 0.8332 support turned resistance holds (2023 low). Long term down trend from 1.0342 (2017 high) is still in progress. Next target is 100% projection of 1.0146 (2022 high) to 0.8332 from 0.9200 at 0.7382.
Dollar Extends Slide After Jobless Claims Jump; SNB Lift Helps Franc Outperform
Dollar came under renewed selling pressure today after a sharp upside surprise in US weekly jobless claims. The surge in initial claims reminded investors that last week’s notably low reading was likely a statistical outlier rather than a sign of renewed labor-market strength. While the data does not yet move the needle on the probability of a Fed cut in Q1, it does inject an additional caution into assessments of the US economy’s momentum.
For now, futures pricing still shows little urgency for a Q1 move, but confidence in the labor market’s resilience has diminished. The narrative of a “soft landing” remains intact, but today’s figures point to less optimism around hiring conditions as the economy enters year-end.
In contrast, Swiss Franc extended its near-term rebound after SNB kept interest rates unchanged at 0.00%, as widely expected. The statement carried a slightly more positive tone, with the central bank noting that the recent US–Swiss tariff agreement—cutting tariff rates retroactively—had improved Switzerland’s growth outlook.
More importantly, SNB downplayed near-term inflation miss and stressed that medium-term inflation dynamics are “virtually unchanged.” The forecast path remains comfortably within price stability. This stance reduces the likelihood of any return to negative interest rates, at least for now, giving CHF modest support.
Market sentiment, however, turned more cautious as the US session began. The strong post-FOMC equity rally looks exhausted, dragged lower by a heavy selloff in Oracle. The firm’s disappointing results and guidance rattled broader tech sentiment, snapping investors back to concerns about stretched AI-related valuations.
Oracle has long sat at the center of the debate over AI-capex sustainability. Unlike Google, Amazon, and Microsoft, the company lacks the deep cash flows required to support ballooning infrastructure and compute investments. Markets were quick to brush aside the headline earnings beat—which was driven by a one-off asset sale—and instead focused on rising capex and weaker free cash flow.
The result: renewed worries that AI investment is not translating into profits as quickly as optimists hoped. The broader tech complex weakened in sympathy, raising the risk that Wednesday’s FOMC-driven stock surge proves short-lived.
In FX for the week so far, Dollar is the worst performer as it extends its post-FOMC decline. Yen follows as second-weakest, with Loonie in third. At the top end, Swiss Franc is the strongest, followed by Kiwi and then Euro. Sterling and Aussie sit in the middle of the pack.
In Europe, at the time of writing, FTSE is up 0.08%. DAX is up 0.27%. CAC is up 0.55%. UK 10-year yield is down -0.029 at 4.480. Germany 10-year yield is down -0.002 at 2.853. Earlier in Asia, Nikkei fell -0.90%. Hong Kong HSI fell -0.04%. China Shanghai SSE fell -0.70%. Singapore Strait Times rose 0.20. Japan 10-year JGB yield fell -0.033 to 1.931.
US initial jobless claims jump back to 236k
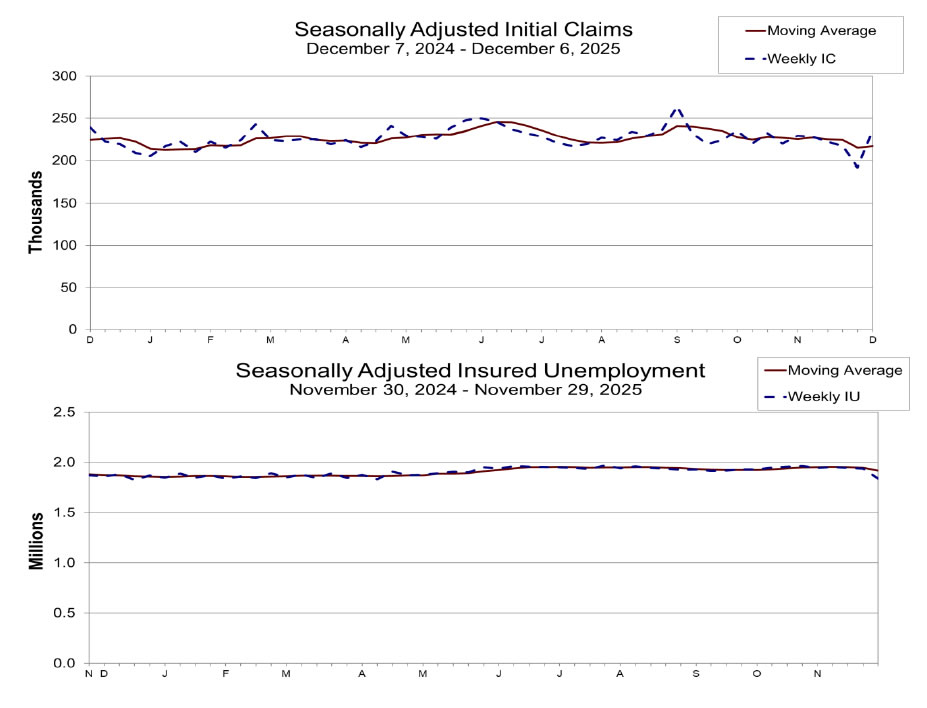
US initial jobless claims rose 44k to 236k in the week ending December 6, above expectation of 205k. Four-week moving average of initial claims rose 2k to 217k. Continuing claims fell -99k to 1838k in the week ending November 29. Four-week moving average of continuing claims fell -17k to 1918k.
SNB holds at 0.00%, medium term inflation outlook virtually unchanged.
SNB left its policy rate unchanged at 0.00%, as widely expected, and reiterated its readiness to intervene in foreign exchange markets if necessary. The hold reflects the bank’s assessment that current conditions do not justify a shift, even as inflation undershot expectations.
In its statement, the SNB noted that inflation has been slightly weaker than anticipated in recent months, but emphasized that medium-term pressures are “virtually unchanged” compared with September. The conditional inflation forecast is marginally lower in the near term but shows little change beyond that. The Bank now sees inflation averaging 0.2% in 2025, 0.3% in 2026 and 0.6% in 2027, based on the assumption of a 0% policy rate throughout the forecast horizon.
The economic outlook for Switzerland has "improved slightly", helped by reduced U.S. tariffs and a modestly better global backdrop. SNB now expects GDP to grow just under 1.5% in 2025 and around 1% in 2026, though it cautioned that unemployment is likely to edge higher.
Australia jobs shock as employment drops -21.3k in November
Australia’s November labor data delivered a downside surprise, with employment falling by -21.3k against expectations for a 20k increase. The weakness was driven by a sharp -56.5k drop in full-time positions, partly offset by a 35.2k rise in part-time roles.
Despite the weaker headline, unemployment rate held at 4.3%, better than the expected uptick to 4.4%. The jobless rate has now been steady at 4.3% in five of the past six months, reflecting a labor market that is loosening but not deteriorating sharply. Participation rate dipped -0.2pts to 66.7%, suggesting some softening in labor-force engagement.
Monthly hours worked were unchanged on the month but still up 1.2% yoy, indicating modest resilience in total labor input despite weaker job creation.
USD/CHF Mid-Day Outlook
Daily Pivots: (S1) 0.7970; (P) 0.8022; (R1) 0.8053; More…
USD/CHF's fall from 0.8101 resumes through 0.7990 and intraday bias is back on the downside. Further fall should be seen to 0.7877 support. Overall, price actions from 0.7828 are seen as a corrective pattern and might extend. Nevertheless, firm break of 0.7877 will argue that larger down trend might be ready to resume through 0.7828 low.
In the bigger picture, outlook will stay bearish as long as 0.8332 support turned resistance holds (2023 low). Long term down trend from 1.0342 (2017 high) is still in progress. Next target is 100% projection of 1.0146 (2022 high) to 0.8332 from 0.9200 at 0.7382.

US initial jobless claims jump back to 236k
US initial jobless claims rose 44k to 236k in the week ending December 6, above expectation of 205k. Four-week moving average of initial claims rose 2k to 217k.
Continuing claims fell -99k to 1838k in the week ending November 29. Four-week moving average of continuing claims fell -17k to 1918k.
EURUSD Advances Further in Extended Post-Fed Rally
The Euro remains firm and rises to the highest in seven weeks on Thursday, in extension of Wednesday’s 0.6% advance, mainly seen in post-Fed acceleration.
The single currency benefited from Fed rate cut and more hawkish than expected monetary policy projections for 2026, which further deflated the US dollar.
Rise above significant barriers at 1.1700 zone (psychological / near 50% retracement of 1.1918/1.1468 / daily Ichimoku cloud top) generated bullish signal which need to be verified on sustained break above these levels and keep bullish structure for attack at 1.1746 (Fibo 61.8%) and potential extension towards 1.1800.
Daily studies in full bullish setup (daily Tenkan/Kijun-sen in steep ascend and diverging after formation of bull-cross /strong bullish momentum, with thick daily cloud underpinning the action) contribute to positive fundamentals and keep the door open for further advance.
Broken top of daily Ichimoku cloud (1.1693, also broken bull-channel upper boundary) reverted to strong support, which should contain dips and keep fresh bulls in play.
Res: 1.1746; 1.1778; 1.1812; 1.1830
Sup: 1.1693; 1.1680; 1.1653; 1.1603
Dollar Delivered a Dovish Surprise
- The Fed lowered rates to 3.50–3.75% and resumed asset purchases.
- The franc is gaining on lower tariffs, while the pound is relying on hawkish BoE.
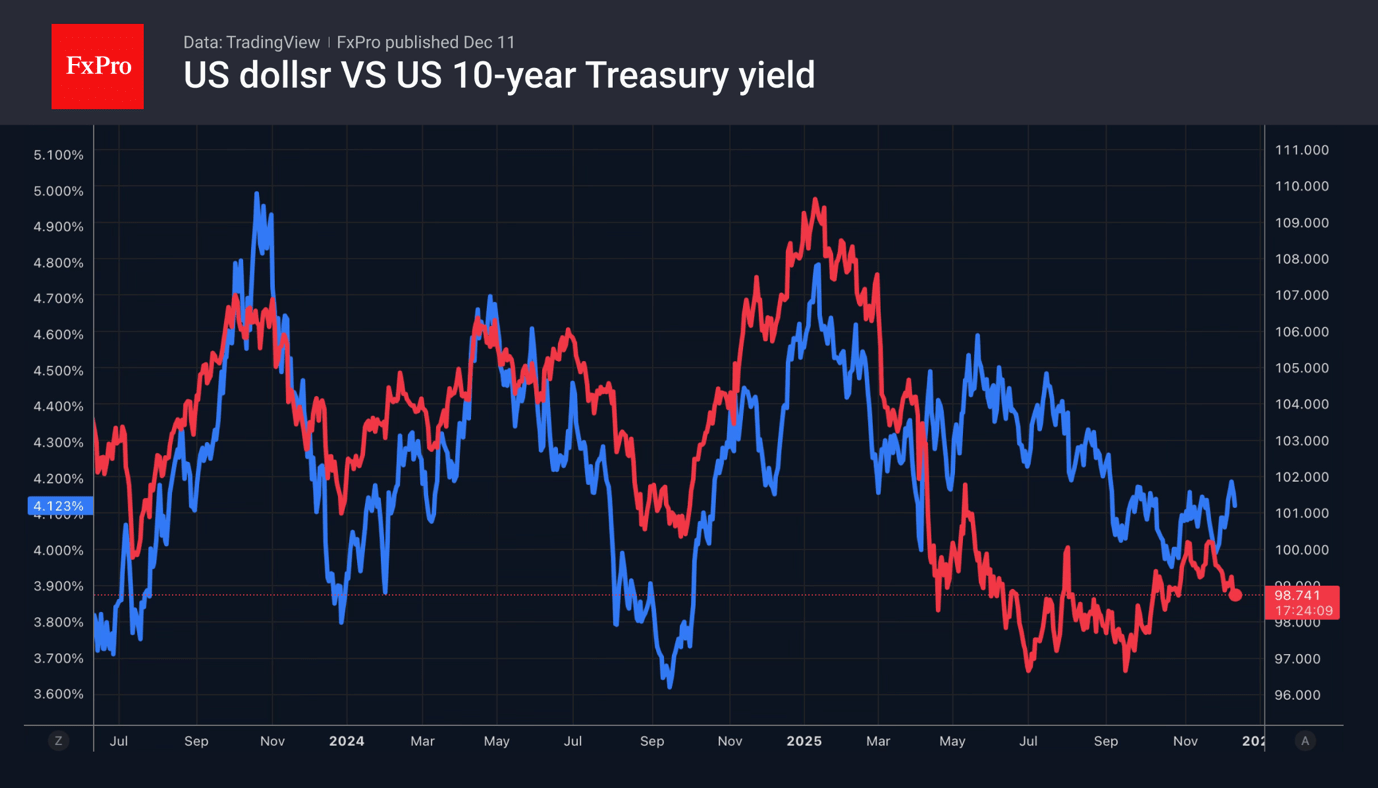
The US dollar experienced its worst day in nearly three months after the Fed cut its key rate and announced a $40 billion asset purchase programme for the upcoming month. The Fed chairman noted that the labour market is cooling and that official employment figures are overstated by about 60k. Coupled with the Fed’s restart of Treasury bond purchases, this lowered yields and triggered a sell-off of the dollar in the market.
At the same time, the Fed’s hawkish stance did materialise. The median FOMC forecast predicts only one rate cut in 2026, and Jerome Powell stated that the rate is in a neutral range, where it neither heats up nor cools down the economy. The Fed feels comfortable in a ‘wait and see’ mode.
The likelihood of a key rate cut in January has decreased from 25% to 20%, and the futures market does not anticipate a cut until April. Consequently, the decline in the dollar appears excessive. Another factor influencing this is the robustness of key competitors. Officials at the ECB and the Reserve Bank of Australia have not ruled out tightening policy as early as 2026, while former Bank of Japan chief economist Hideo Hayakawa mentions the possibility of four rate hikes by the end of 2027.
The main beneficiaries of the dollar’s decline have been the Swiss franc and the British pound. Switzerland announced a retroactive cut in import duties from the US, reducing them from 39% to 15%. This change will take effect from 14 November and is expected to boost exports and the economy. Additionally, signals from the Federal Reserve about pausing rate cuts, along with reversals by other central banks, are dampening concerns of the SNB returning to negative interest rates. This supports bearish sentiment on the USDCHF pair.
The futures market continues to price in a rate cut by the Bank of England on 18 December. However, expectations that the BoE will follow the Fed and tighten policy are generating bullish rumours for the GBPUSD pair. The central bank anticipates that measures outlined by Rachel Reeves in the draft budget will reduce inflation by 0.4-0.5 percentage points annually, starting in the second quarter of 2026.
SNB Hold Rates, SoftBank Falls 7.7%, Gold Slips Post FOMC. DAX Holds Above Psychological 24000 Handle
Asia Market Wrap - Nikkei Struggles, Ends the Day Down 0.9%
The Nikkei finished lower on Thursday, primarily because of a large drop in SoftBank Group shares. SoftBank's decline mirrored the steep fall of the US tech giant Oracle, which disappointed investors by predicting sales and profit below what Wall Street analysts expected.
Although the Nikkei briefly rose by 0.5% earlier in the day, it closed down 0.9% at 50148.82. The broader Topix index also fell by 0.94% after opening at a record high.
SoftBank Group was the biggest drag, plummeting 7.69%. Other Japanese technology companies also lost ground, including Tokyo Electron (down 1.57%), Shin-Etsu Chemical (down 3.94%), and the robot maker Fanuc (down 2.19%).
Even bank stocks, such as Mizuho Financial Group and Sumitomo Mitsui Financial Group, gave up their initial gains and finished lower.
Swiss National Bank Hold Rates at 0%
The Swiss National Bank (SNB) concluded its final meeting of the year by keeping its key interest rate at zero, and it will continue to charge a small fee ($0.25$ percentage point) on bank deposits that exceed a certain limit.
The bank also stated it is prepared to step into the foreign exchange markets if necessary. Inflation in Switzerland is currently very low, falling to 0.0% in November (from 0.2% in August), mainly because of cheaper hotel stays, rent, and clothing.
Looking ahead, the SNB predicts inflation will remain low, gradually increasing to 0.2% in 2025, 0.3% in 2026, and 0.6% in 2027. Globally, economic growth was better than expected in the third quarter of 2024 despite trade conflicts, though risks from US tariffs and uncertain trade policies remain.
Within Switzerland, the economy actually shrank in the third quarter, largely due to a decrease in pharmaceutical exports to the US after an earlier surge, but other sectors like manufacturing and services saw minor improvements.
The SNB expects the country's economy to grow by just under 1.5% in 2025, slowing to about 1% in 2026, which may lead to a slight rise in unemployment as the economy cools down.
European Session - European Shares Edge Lower, Delivery Hero Down 5%
European stock markets were relatively quiet on Thursday, seeing a small dip overall. The main reason for the decline was the poor forecast from the American cloud company Oracle, which caused technology stocks to fall. This negative news overshadowed the relief felt after the US Federal Reserve made comments that were less aggressive about future interest rate hikes than investors had anticipated.
The general European STOXX 600 index, along with major markets like London and France, was down by about 0.1% to 0.3%. The technology sector specifically dropped about 0.9%, with the German software company SAP falling 2.5% because Oracle's disappointing sales and profit predictions, combined with increased spending plans, brought back worries about the high valuations and returns on investments in artificial intelligence.
Although the Federal Reserve indicated that it might not cut interest rates immediately until the job market stabilizes, which was a positive signal for investors, it wasn't enough to counteract the tech sector's decline.
In other company news, Delivery Hero shares dropped 5% after a downgrade from Citigroup, while Drax in London rose 2.2% after predicting higher-than-expected yearly profits, and RS Group was the top performer on the STOXX 600, gaining 3% after an analyst upgrade.
On the FX front, the US dollar received some support on Thursday because there was a general avoidance of risk across the markets.
However, it couldn't fully recover the ground it lost the previous day against other major currencies like the euro, yen, and sterling, mainly because the Federal Reserve's recent announcement was not as aggressive as some investors had anticipated.
The euro remained stable at 1.1704 (a two-month high) after a significant gain on Wednesday, and the British pound held steady at 1.13374 following a similar rise. The dollar also continued to weaken against the Japanese yen, dipping 0.14% to 155.8 yen.
Meanwhile, the Swiss franc reached its strongest level against the dollar in nearly a month, trading at 0.7992 per dollar.
The Australian dollar suffered from the same risk-aversion trend, falling 0.5% to 0.6644. Reflecting the broad drop in risk appetite,
Bitcoin briefly fell below the 90,000 mark, and Ether dropped more than 4% to 3,200..
Currency Power Balance
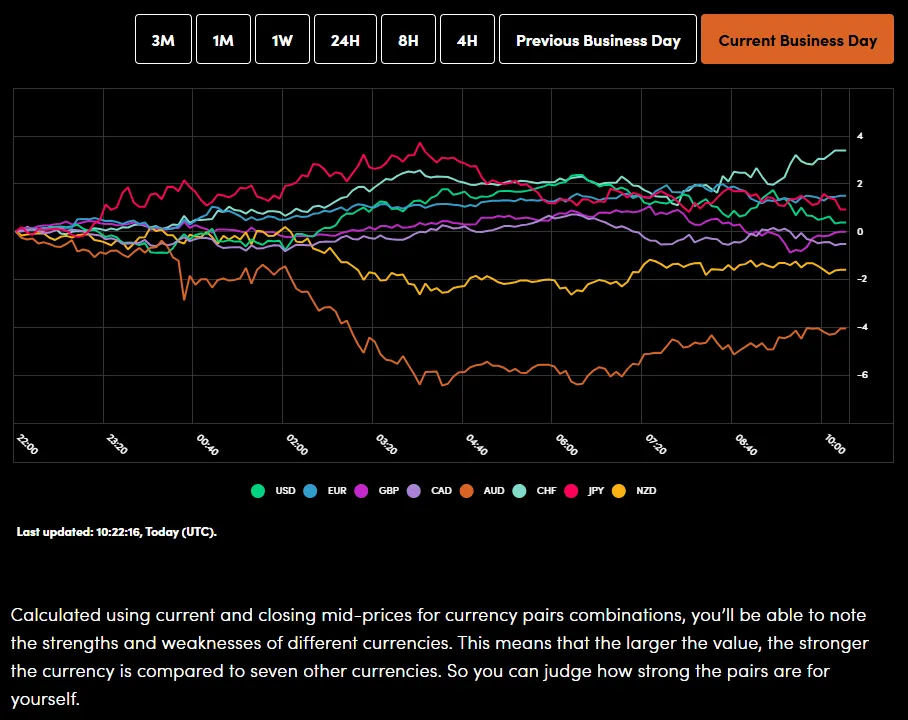
Source: OANDA Labs
Oil prices declined on Thursday as investors redirected their attention toward two main events: the ongoing peace negotiations between Russia and Ukraine and the potential consequences of the US seizing an oil tanker that had been sanctioned off the Venezuelan coast.
These factors led to a decrease in prices. Specifically, Brent crude futures dropped by 81 cents, or 1.3%, settling at 61.40/barrel, and US West Texas Intermediate crude also fell by 78 cents, or 1.3%, to 57.68/barrel.
Gold prices dropped slightly on Thursday, moving away from a high point reached earlier in the week. This dip occurred because the US Federal Reserve's recent interest rate cut was not unanimously supported, leaving investors uncertain about how quickly the central bank will continue to lower rates next year.
However, in contrast, silver hit a new record high. Specifically, spot gold fell 0.4% to 4,210.88/oz, though it had briefly reached its highest price since December 5th earlier in the trading session.
Meanwhile, US gold futures for February delivery saw a small increase of 0.3% to 4,238.10/oz.
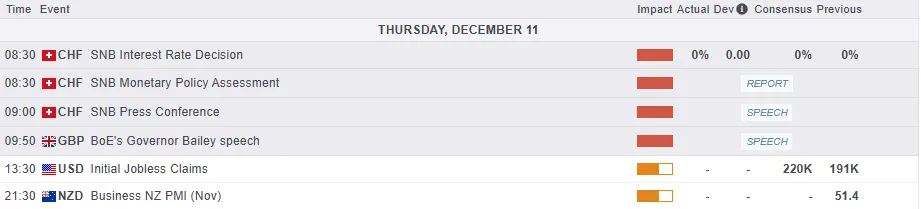
Economic Calendar and Final Thoughts
The European session will be quiet from a data perspective. There are Turkish interest rates and the OPEC monthly report which will be released and could stoke some volatility.
The US session will be busier though with Canadian and US trade balance data, Initial jobless claims and the NVIDIA senate bill coming into focus.
None of the above are expected to be massive market moving events and attention will now turn to inputs from the November jobs data next Tuesday.
The Federal Open Market Committee (FOMC) meeting yesterday was likely the most significant event that could positively impact the markets before the end of the year. Since that event has now passed, the US dollar might start to experience its typical seasonal weakness as the year concludes. This could cause the US Dollar Index (DXY) to gradually fall toward the 98.00 level.
For all market-moving economic releases and events, see the MarketPulse Economic
Chart of the Day - DAX Index
From a technical standpoint, the DAX Index has held above the key confluence level at 24000 for the last four trading days.
This could be seen as both positive and potentially slightly concerning. The failure to push higher means bulls are hesitant to push on and a lot of this is likely down to the FOMC meeting.
The post FOMC reaction has been rather tentative and not had a major impact on the DAX for now.
The period-14 RSI is eyeing a retest of the neutral 50 level. A bounce off this level could give bulls some optimism as it does hint that bullish momentum remains intact for now.
Immediate resistance rests at 24200 before the swing high just above the 24400 handle comes into focus.
Immediate support rests at 24000 before the swing high at 23880 and the 20-day MA at 23667 come into focus.
DAX Index Index Daily Chart, December 11, 2025
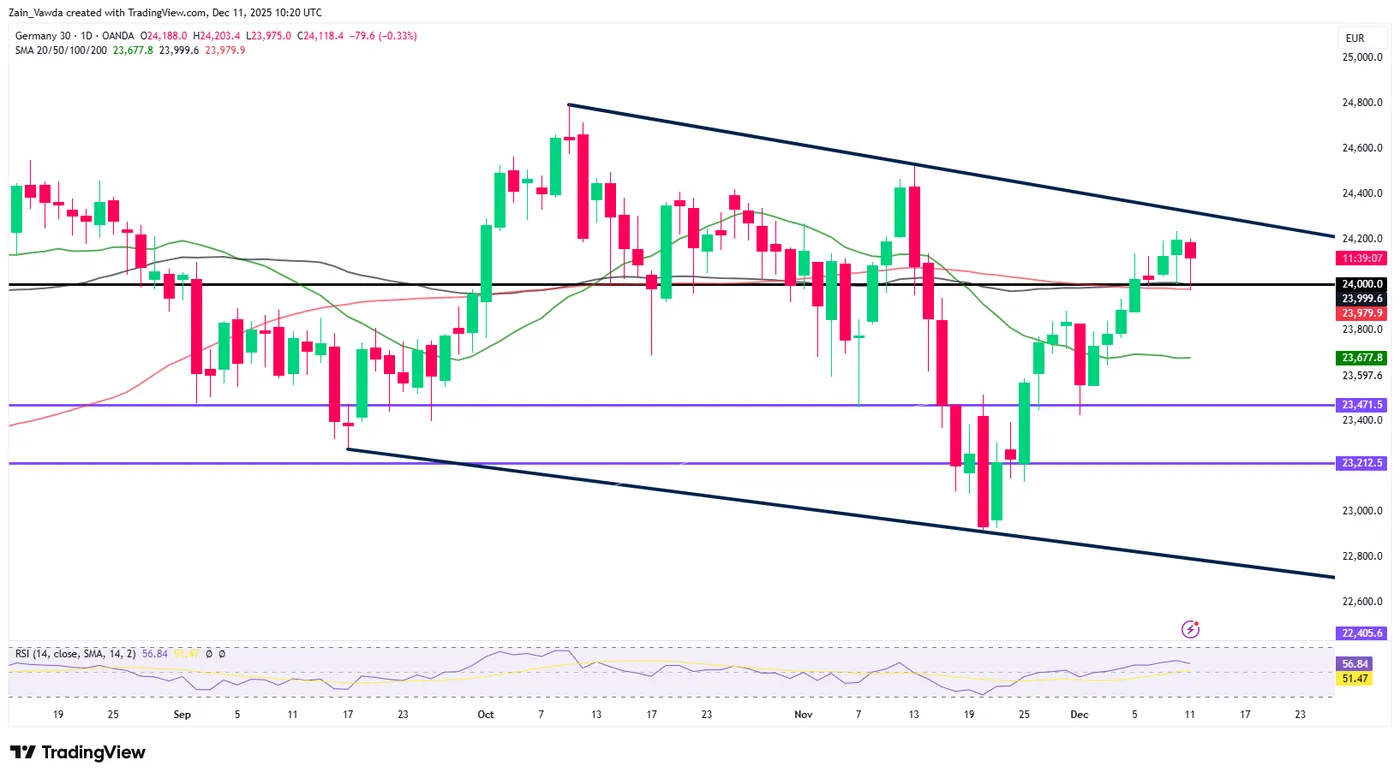
Source: TradingView.com (click to enlarge)