Sample Category Title
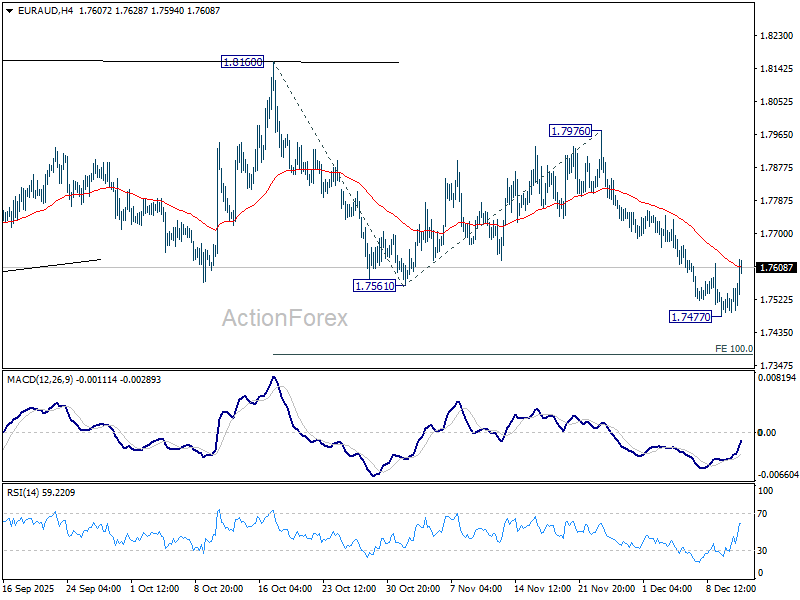
EUR/AUD Daily Outlook
Daily Pivots: (S1) 1.7486; (P) 1.7525; (R1) 1.7557; More...
Intraday bias in EUR/AUD is turned neutral with current recovery, and some consolidations could be seen first. Outlook is unchanged that fall from 1.8160 is seen as the third leg of the pattern from 1.8554. Below 1.7477 will target 100% projection of 1.8160 to 1.7561 from 1.7976 at 1.7377. This will remain the favored case as long as 55 D EMA (now at 1.7731) holds.
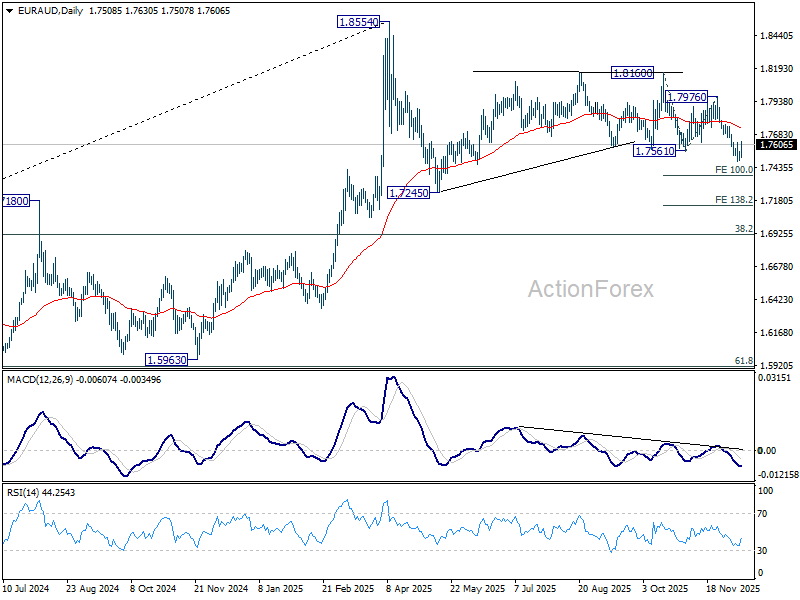
In the bigger picture, as long as 55 W EMA (now at 1.7456) holds, price actions from 1.8554 could still be a correction to rise from 1.5963 only. However, sustained break of the EMA will argue that it's already correcting the whole up trend from 1.4281 (2022 low). In this case, deeper decline would be seen to 38.2% retracement of 1.4281 to 1.8554 at 1.6922.
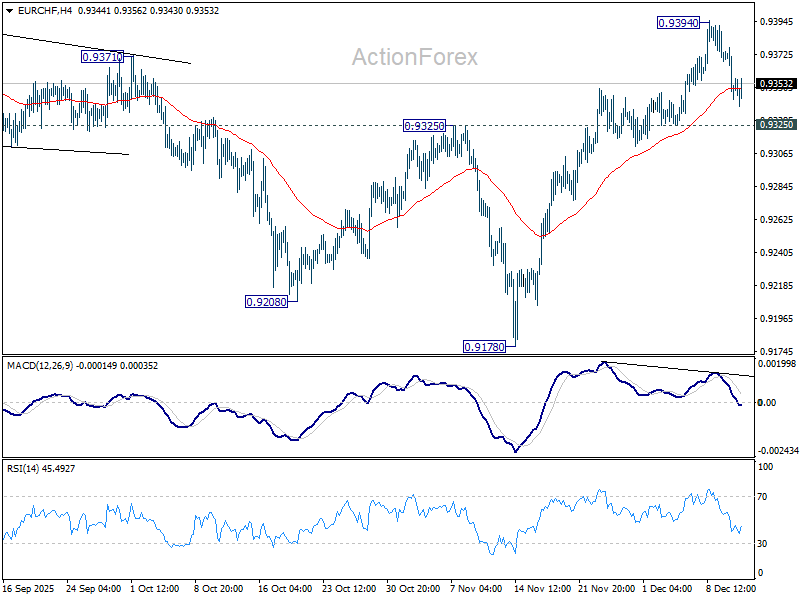
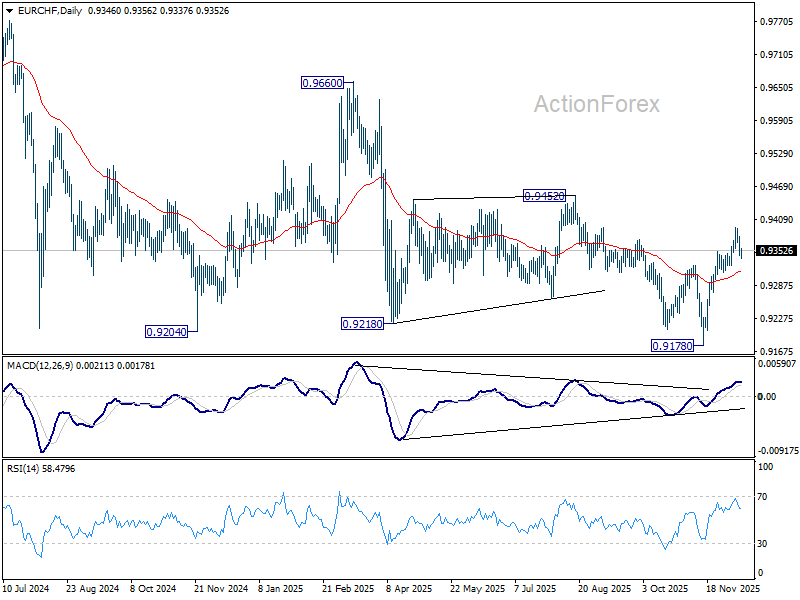
EUR/CHF Daily Outlook
Daily Pivots: (S1) 0.9339; (P) 0.9362; (R1) 0.9380; More....
Intraday bias in EUR/CHF remains neutral for the moment, and further rise is expected with 0.9325 support intact. On the upside, above 0.9394 will resume the rebound from 0.9178 to 0.9452 key structural resistance. Decisive break there will carry larger bullish implications. Nevertheless, firm break of 0.9325 will bring deeper fall to 55 D EMA (now at 0.9313) and below.
In the bigger picture, EUR/CHF has breached long term falling channel resistance as the rebound from 0.9278 extends. Considering bullish convergence condition in W MACD, sustained trading above 55 W EMA (now at 0.9372) will indicate medium term bottoming, and suggests that it's already in larger scale rebound. Further break of 0.9452 resistance will bring stronger medium term rally towards 0.9228 resistance next. Nevertheless, rejection by 55 W EMA will retain bearishness for another fall through 0.9278 at a later stage.
Part of Powell’s Analysis Allows Market to Consider a Less Hawkish Interpretation
Markets
The Fed cut its policy rate for the third consecutive meeting by 25 bps yesterday to 3.5%-3.75%. The Fed still has to balance a weakening labour market against somewhat elevated inflation. There was again no consensus within the FOMC on how to address these opposing factors, as one member (Stephen Miran) voted for a 50 bps cut, but two others (Schmid and Goolsbee) wanted to keep the policy rate unchanged. The dots even showed a total of 6 out of 19 members in favour of the status quo. The median Federal Funds Rate projection for 2026 and 2027 remained unchanged at respectively 3.25%-3.5% and 3%-3.25%. Fed chair Powell indicated that the policy rate now is “within the range of plausible neutral estimates”, allowing the Fed to assess incoming data, with a January rate cut seen as rather unlikely. However, part of Powell’s analysis allowed the market to consider a less hawkish interpretation. PCE inflation forecasts for this (2.9% from 3%) and next (2.4% from 2.6%) faced downward revisions. Powell’s working hypothesis is still that most of the current elevated inflation was temporary due to higher goods prices driven by tariffs. Services inflation has been cooling. In addition, the Fed chair pointed at ongoing downside risks to the labour market, especially as current estimates on employment growth probably present an over-estimation. Markets responded to the “dovish” opening created by the labour market remarks. The US curve bull steepened, with yields declining between 7.7 bps (2-y) and -2.1 bps (30-y), assuming that the Fed focus remains slightly more tilted to maximum employment part of its dual mandate. An additional announcement to start buying T-bills (and other short-term Treasury securities) from next week on at a $40bn pace to maintain a situation of ample reserves added to the bull steepening move. By nearing neutral interest rate levels, the bar for additional rate cuts in early 2026 has been raised. Nevertheless, in case of weak (labour) market data next week and/or January, the debate on an additional precautionary rate cut might rapidly resurface. On other markets, equities rebounded yesterday with the Fed upwardly revising its growth forecasts, especially for next year (2.3% from 1.8% in September) and the Fed chair elaborating on ongoing high productivity gains supported. The combination of losing interest rate support and a risk rebound weighed on the dollar. DXY eased further from the 99.2 area early in the session to close at 98.79. EUR/USD closed just below the 1.17 big figure (1.1695).
Today’s eco calendar is thin, apart from weekly jobless claims. The Swiss national bank is expected to keep its policy rate unchanged at 0%. Even as Powell indicated that the Fed is now in a position to wait, we assume that both US yields and the dollar remain more sensitive to weaker than expected (labour market) data.
News & Views
The Bank of Canada as expected kept the policy rate unchanged at 2.5%. Economic growth at a 2.6% annualized clip in Q2 was surprisingly strong, it said, but that was the result of a steep drop in imports. The BoC anticipates a weak Q4 number with the import normalizing hanging in the balance with a grow in domestic demand. Growth is forecast to pick up in 2026, although uncertainty remains high. The labour market is a similar “on the one hand, but on the other” narrative. after solid employment gains over the last three months. Inflation, 2.2% in October, should remain close to the 2% target with the BoC willing to look through some choppiness in the coming months. Underlying gauges hover around 2.5%. The central bank concludes that “the current policy rate at about the right level to keep inflation close to 2% while helping the economy through this period of structural adjustment.” Canadian swap yields fell up to 5 bps at the front. USD/CAD ended lower below 1.38 but that was mainly a US dollar move.
Brazil’s central bank left the policy rate at 15% and kept their view of an economy cooling while inflation, though still above the 3% target, is improving. They lowered CPI forecasts to hit 3.2% in 2027Q2 (from 3.3%), which is their relevant policy horizon for now. Risks remain symmetrical. The 15% level is considered “appropriate” to bring inflation to target, considered a slight dovish change compared to November’s “will be enough”. The Brazilian real’s strengthening over much of 2025 probably helps explain the downwardly adjusted CPI forecasts. But its recent weakening to a two month low of USD/BRL 5.47 warrants ongoing caution, meaning the 15% level may be the reference for the time being..
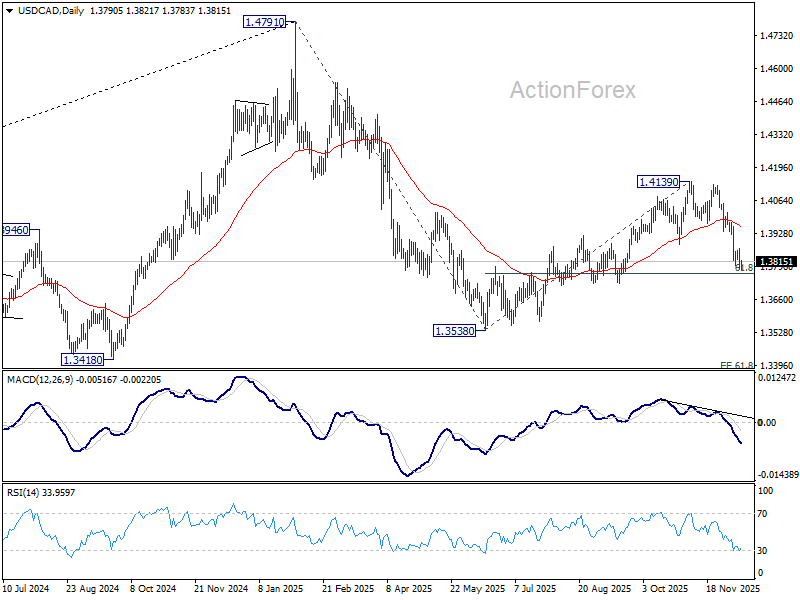
USD/CAD Daily Outlook
Daily Pivots: (S1) 1.3761; (P) 1.3816; (R1) 1.3849; More...
Intraday bias in USD/CAD is back on the downside with breach of 1.3798 temporary low. Sustained break of 61.8% retracement of 1.3538 to 1.4139 at 1.3768 will extend the fall from 1.4391 towards 1.3538 low. On the upside, above 1.3870 minor resistance will turn intraday bias neutral again first.
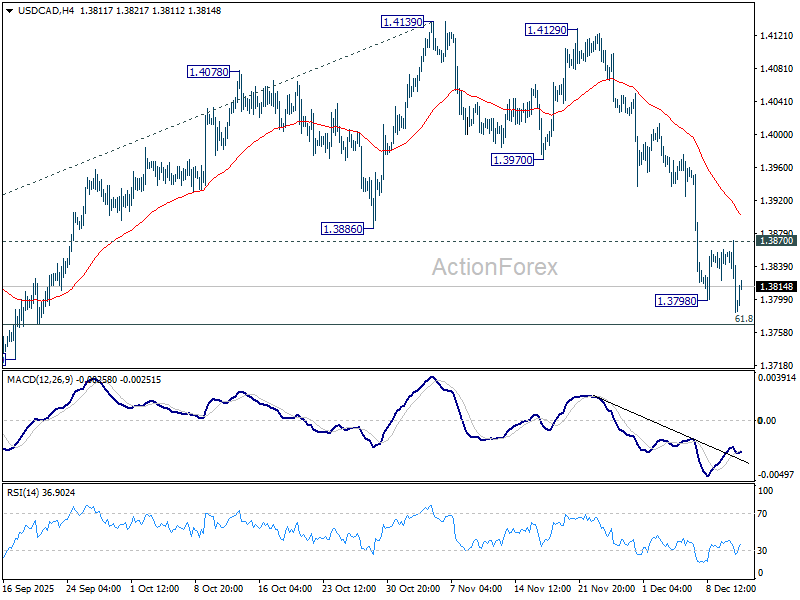
In the bigger picture, current development suggests that price actions from 1.4791 is developing into a deeper, larger scale correction. In the less bearish case, it's just correcting the rise from 1.2005 (2021 low). But even so, break of 1.3538 will pave the way to 61.8% projection of 1.4791 to 1.3538 from 1.4139 at 1.3365. This will remain the favored case as long as 1.4139 resistance holds, in case of rebound.
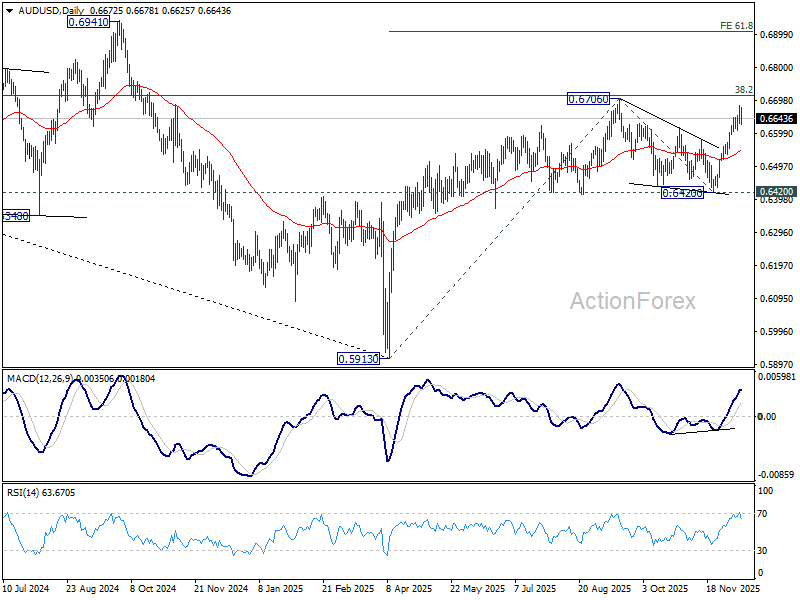
AUD/USD Daily Report
Daily Pivots: (S1) 0.6641; (P) 0.6664; (R1) 0.0.6698; More...
Intraday bias in AUD/USD is turned neutral with current retreat, and some consolidations would be seen. On the upside, above 0.6685 temporary top will target a retest of 0.6706 high. Decisive there will confirm up trend resumption, and target 61.8% projection of 0.5913 to 0.6706 from 0.6420 at 0.6910. However, break of 55 D EMA (now at 0.6544) will extend the corrective pattern from 0.6706 with another falling leg.
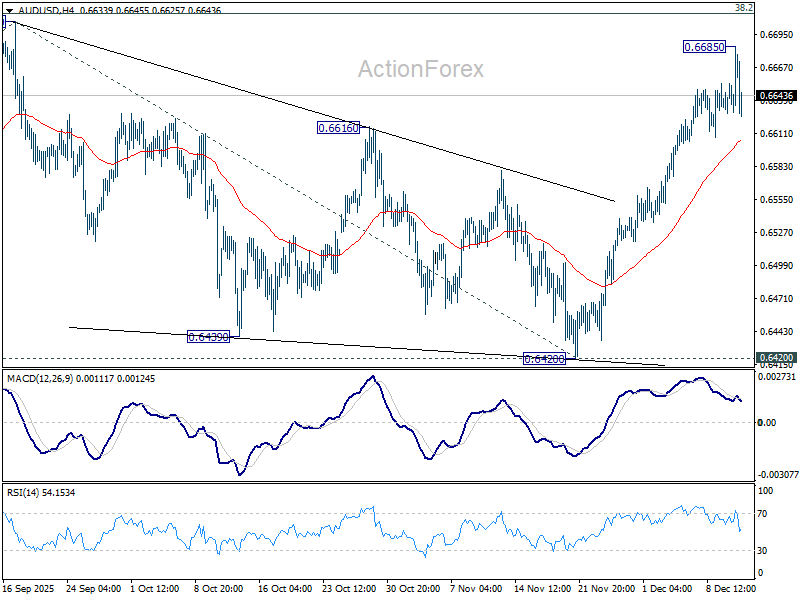
In the bigger picture, the break of multi-year falling trend line resistance suggests that rise from 0.5913 is possibly reversing whole down trend from 08006 (2021 high). Decisive break of 38.2% retracement of 0.8006 to 0.5913 at 0.6713 will solidify this case, and bring further rally to 61.8% retracement at 0.7206. On the downside, however, firm break of 0.6420 support will suggest rejection by 0.6713 and retain medium term bearishness.
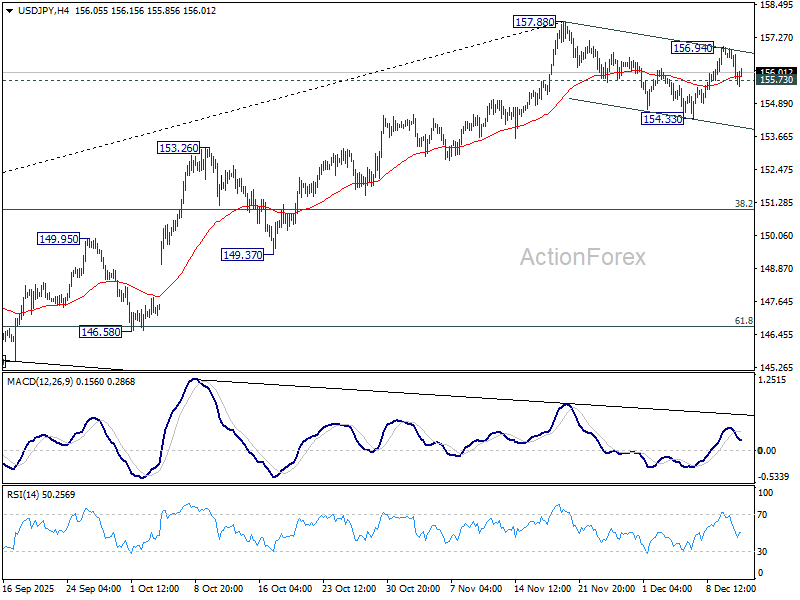
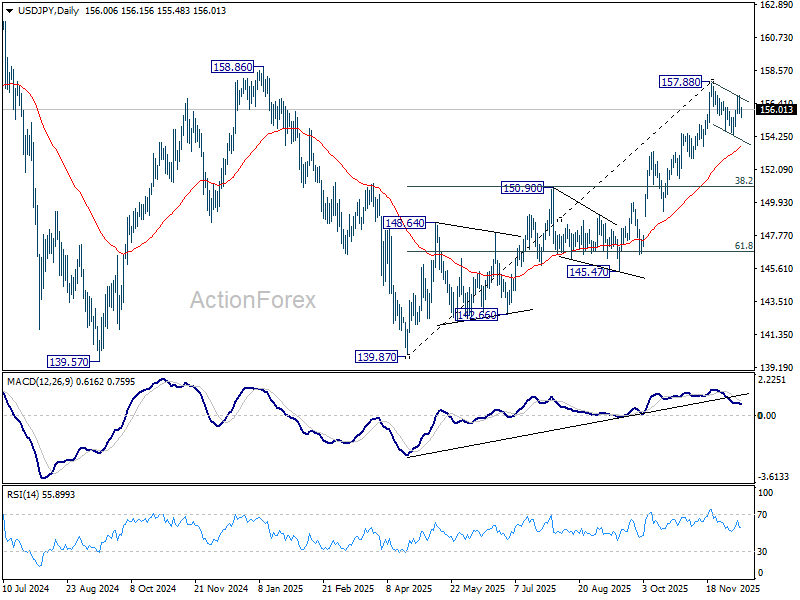
USD/JPY Daily Outlook
Daily Pivots: (S1) 155.58; (P) 156.26; (R1) 156.72; More...
Intraday bias in USD/JPY is turned neutral with breach of 155.73 minor support. Fall from 157.88 should develope into a corrective pattern. Break of 154.33 will bring deeper fall, but downside should be contained by 55 D EMA (now at 153.51). On the upside, above 156.94 will bring retest of 157.88. Firm break there will resume whole rally from 139.87 to 158.85 key structural resistance.
In the bigger picture, corrective pattern from 161.94 (2024 high) could have completed with three waves at 139.87. Larger up trend from 102.58 (2021 low) could be ready to resume through 161.94 high. Decisive break of 158.85 structural resistance will solidify this bullish case and target 161.94 for confirmation. On the downside, break of 150.90 resistance turned support will dampen this bullish view and extend the corrective range pattern with another falling leg.
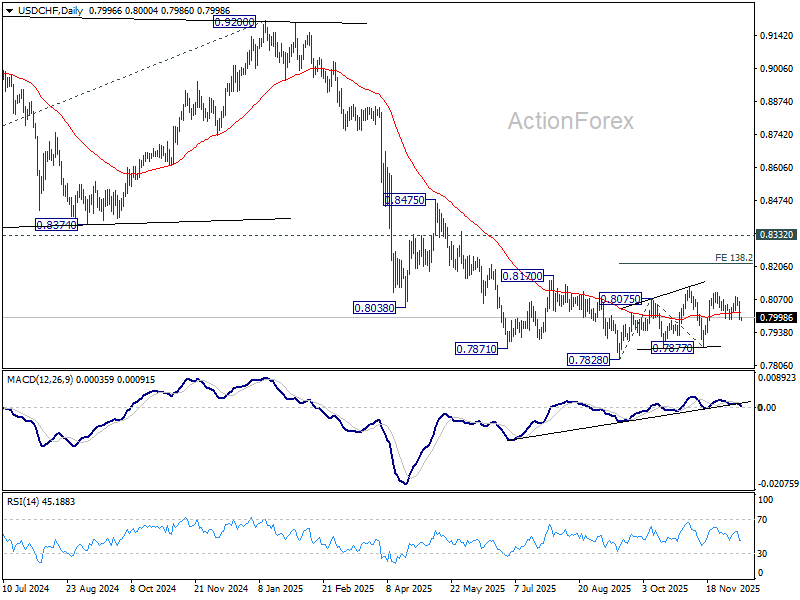
USD/CHF Daily Outlook
Daily Pivots: (S1) 0.7970; (P) 0.8022; (R1) 0.8053; More…
Overall outlook is unchanged in USD/CHF, as correction pattern from 0.7828 could extend further. On the upside, break of 0.8123 will target 138.2% projection of 0.7828 to 0.8075 from 0.7877 at 0.7812. However, firm break of 0.7990 support will turn bias back to the downside for 0.7877 support.
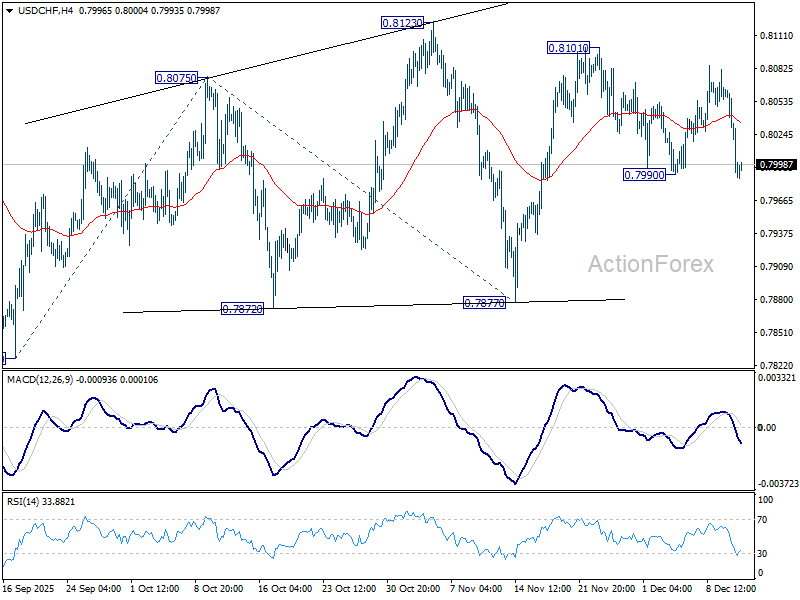
In the bigger picture, outlook will stay bearish as long as 0.8332 support turned resistance holds (2023 low). Long term down trend from 1.0342 (2017 high) is still in progress. Next target is 100% projection of 1.0146 (2022 high) to 0.8332 from 0.9200 at 0.7382.
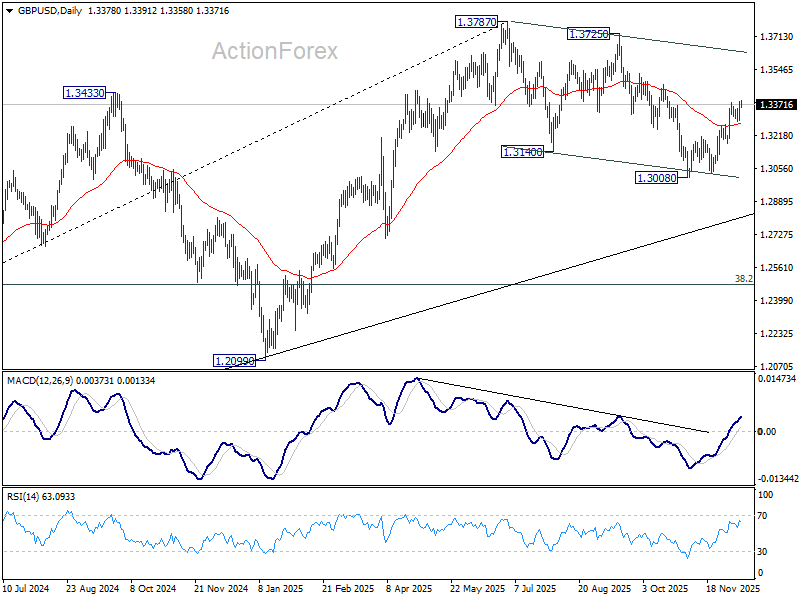
GBP/USD Daily Outlook
Daily Pivots: (S1) 1.3323; (P) 1.3356; (R1) 1.3416; More...
Intraday bias in GBP/USD remains neutral and further rally is expected with 1.3178 support intact. As noted before, fall from 1.3787 should have completed as a three-wave correction to 1.3008. On the upside, above 1.3384 will target 1.3470 resistance. Decisive break there will bring retest of 1.3787 high.
In the bigger picture, current development suggests that fall from 1.3787 is merely a corrective move, and larger rise from 1.0351 (2022 low) is still in progress. Firm break of 1.3787 will target 1.4248 (2021 high) key structural resistance. This will remain the favored case as long as target 38.2% retracement of 1.0351 to 1.3787 at 1.2474 holds, in case of another fall.
Post-Fed Gains Evaporate With Oracle Earnings
Yesterday was one of those days the kneejerk reaction to a Federal Reserve (Fed) decision didn’t make perfect sense. As widely anticipated, the Fed lowered interest rates by 25bp and the dot plot printed that the median expectation for next year was just one rate cut – unchanged from the latest dot plot.
But the median forecast is losing its relevance with the growing opinion – and political – divergence at the heart of the FOMC. Yesterday’s vote already was subject to 3 dissents: 2 voting members preferred keeping rates steady, while Stephan Miran – who was appointed by Trump himself with the mission of ‘cut, cut, cut’ – opted for a 50bp cut. Beyond the official vote, more regional Fed members showed reluctance to cut rates when inflation is just below the 3% level, with looming upside risks. Overall, 6 out of 19 Fed members didn’t agree with the Fed’s decision to cut by 25bp. And most of them preferred keeping rates unchanged – and wait until at least an updated CPI print to guide them. Miran was the only person pushing for a jumbo rate cut (Surprise!)
And oh, Donald Trump said that yesterday’s cut could’ve been higher, and will probably announce his next Fed Chair pick soon enough to inject more dovish members into the mix – to make sure that the Fed cuts, cuts, cuts.
So, the market reaction to such a crowded and undecided Fed was unusually positive. Treasuries and equities rallied. The US 2-year yield fell close to 3.50%, the 10-year yield retreated to 4.12%, the S&P500 gained, but the small-cap index outperformed with a 1.32% rally to a fresh ATH. The US dollar fell below a critical Fibonacci level – the 38.2% retracement on the fall–rebound – and is now back in the medium-term bearish consolidation zone, while gold gained and silver rallied to a fresh record high on softer US dollar and softer yields that reduce the opportunity cost of holding the non-interest-bearing metals.
For next year, the Fed will probably sit and wait for at least 6 months whoever takes the helm from Powell. The next cut from the Fed is not expected before June next year, and money markets continue to price in two rate cuts in 2026. But the divergence of opinion at the heart of the FOMC will probably get worse as politics influence some members’ decisions grandly. Respect and credibility regarding the Fed will be put to a tough test, and some decisions will make more political sense than economic.
This is terrible news. It probably makes sense to continue to reduce exposure to the US dollar.
Now, coming back to the market reaction, I rubbed my eyes a few times with unbelief seeing the positive reaction of equity markets to the Fed decision. I think there was little to cheer in that chaos. Consequently, it didn’t take much for the post-Fed optimism to evaporate with Oracle earnings.
Oracle announced a higher-than-expected EPS growth – but that was due to a one-time income from the sale of a subsidiary. Cloud sales increased 34% – but were lower than expected. Revenue from its infrastructure business grew 68% – also lower than expected by analysts. And more dramatically, the company continued to burn cash last quarter: its free cash flow reached a negative $10 billion. To make matters worse, the company said that it expects capex to reach about $50 billion in the fiscal year ending May 2026 – $15 billion more than its September forecast – and investments at Oracle are financed by debt: overall, the company has about $106 billion in debt. Frankly, the report was not dramatically bad, but it came to confirm concerns around heavy AI spending, financed by debt, with an unknown timeline for revenue generation, sending Oracle shares down by more than 11% in after-hours trading.
As such, Asia woke up to a bleak day. SoftBank lost more than 7% – the kind of moves that we’re now used to seeing in its stock price – while the tech-heavy Korean Kospi is under pressure, as national chip champion SK Hynix gives back more than 2.50% after the country’s main exchange issued a warning that the stock price had gone too high – following a nearly 300% jump between April and November – suggesting that we could be entering a bubble zone. Perhaps.
US futures are down this morning with Nasdaq leading losses. The Fed outlook looks dodgy. Worries regarding leveraged AI investments are taking centre stage. The FOMO of the AI rally is now turning into a fear of a bubble. Stock valuations are high and market breadth is quite narrow, with most of the gains and appetite relying on AI. It’s reasonable to expect a correction as fundamentals are moving away from the reality on the ground. Capital markets are turning into a big betting ground, and valuations make little sense. But go tell that to investors. The market rally is so sweet that there seems to be a collective understanding that if no one sells, the rally could simply go on. So let’s see whether anything could shake the omertà!
Good news is, the next big news of the week – Broadcom earnings – looks safer from a risk perspective. The company is expected to deliver another strong quarter, with consensus calling for roughly +30–32% year-over-year EPS growth, and ~24% annual revenue growth – driven by robust demand in custom AI silicon and networking products. Guidance on AI-related revenue and future demand trends will probably be solid as well, given that they are involved in the production of Google’s TPUs – which are expected to become a new hot commodity for those looking for cheaper alternatives to Nvidia’s GPUs for running AI applications, especially inference – expected to make up a big chunk of future AI computation.
And given how markets are willing to pull Santa into year-end – despite political, geopolitical and economic worries – good news from Broadcom could easily turn sentiment positive.
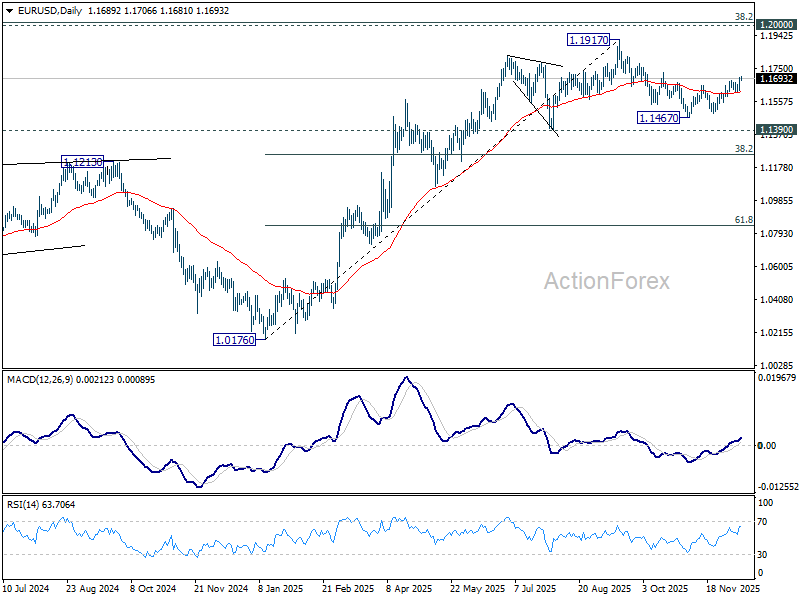
EUR/USD Daily Outlook
Daily Pivots: (S1) 1.1646; (P) 1.1673; (R1) 1.1724; More….
EUR/USD's rise from 1.1467 resumed by breaking through 1.1681 temporary top and intraday bias is back on the upside. As noted before, corrective fall form 1.1917 should have completed at 1.1467. Firm break of 1.1727 resistance will solidify this case and bring retest of 1.1917 high. However, break of 1.1614 support will revive near term bearishness, and bring retest of 1.1467 low.
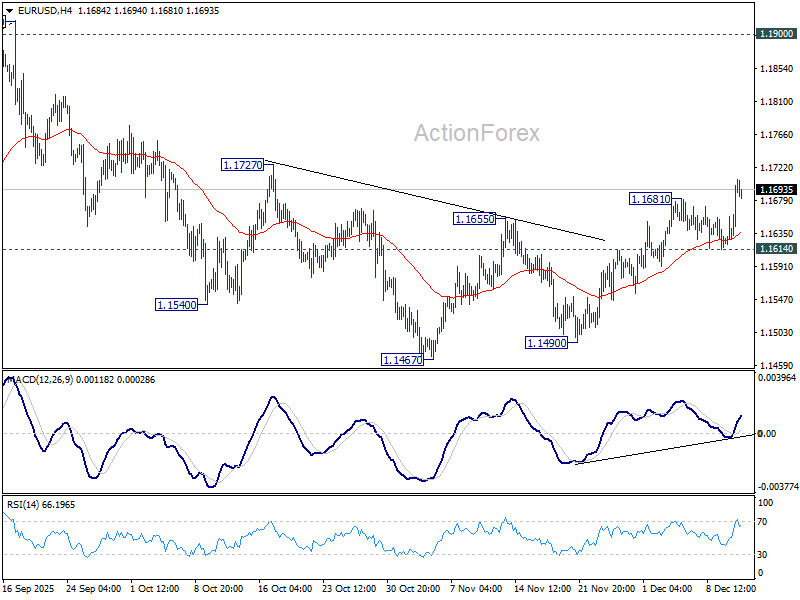
In the bigger picture, as long as 55 W EMA (now at 1.1346) holds, up trend from 0.9534 (2022 low) is still in favor to continue. Decisive break of 1.2 key psychological level will carry larger bullish implication. However, sustained trading below 55 W EMA will argue that rise from 0.9534 has completed as a three wave corrective bounce, and keep long term outlook bearish.