Sample Category Title
Dollar Falls as Markets Reject “Hawkish Cut” Narrative; Aussie Falls Hard After Labour Miss
US stocks advanced solidly overnight after the Fed’s expected 25bps rate cut was greeted warmly by markets. Even though some economists labeled the decision a “hawkish cut,” the risk-on response in equities and the sell in Dollar suggested investors heard nothing hawkish enough to derail near-term sentiment.
The three-way vote split offered little surprise. Trump-backed Governor Stephen Miran once again pushed for a deeper 50bps reduction, while known hawks Austan Goolsbee and Jeffrey Schmid preferred to hold policy steady. The distribution fit comfortably with prior expectations and did little to shift the market narrative.
The Fed’s economic projections retained their key feature: one rate cut each in 2026 and 2027, reinforcing a shallow and deliberate easing path. Meanwhile, neither Chair Jerome Powell nor the statement signaled that the Committee is ready to commit to a pause. That ambiguity reflects both internal differences and the timing: November CPI and NFP—critical data points—are due next week, making it premature for Powell to any declare direction.
Market pricing barely budged. Fed fund futures now imply about a 48% chance of a 25bps cut in March, versus 52% for a hold—almost identical to pre-FOMC levels. With the market’s base case broadly intact and no hawkish surprise from Powell, the stock-market rally remains on track, keeping hopes for a Santa rally alive for now.
Attention now turns to the Swiss National Bank. SNB is expected to hold at 0.00%. Chair Schlegel has made clear that returning to negative rates would require a very high bar. Officials are expected to repeat their standard line: vigilant, but in no rush to move.
A positive development for Switzerland came with the confirmation on Wednesday that the US–Swiss tariff agreement will apply retroactively to November 14. The deal cuts Trump’s previously imposed 39% tariff down to a ceiling of 15%. The Swiss government noted this would reduce trade-weighted US tariff levels by roughly 10%, materially improving access for Swiss exporters.
In currency markets, Yen remains entrenched at the bottom of the weekly performance table. Aussie slipped to second-worst after today’s poor labor data reminded markets that RBA hike speculation for 2026 is still premature. Dollar sits as the third weakest following its post-FOMC slide.
At the top of the leaderboard, Swiss Franc has rebounded and is now the strongest performer—though recent weak Swiss CPI data raises the risk of a slight dovish tilt today, leaving CHF exposed. Euro follows as the second strongest, benefiting from Dollar weakness. Kiwi ranks third-best, supported by relative strength against the soft Aussie. Sterling and Loonie sit in the middle of the pack.
In Asia, Nikkei fell -0.90%. Hong Kong HSI is down -0.15%. China Shanghai SSE is down -0.92%. Singapore Strait Times is up 0.26%. Japan 10-year JGB yield fell -0.034 to 1.930. Overnight, DOW rose 1.05%. S&P 500 rose 0.67%. NASDAQ rose 0.33%. 10-year yield fell -0.022 to 4.164.
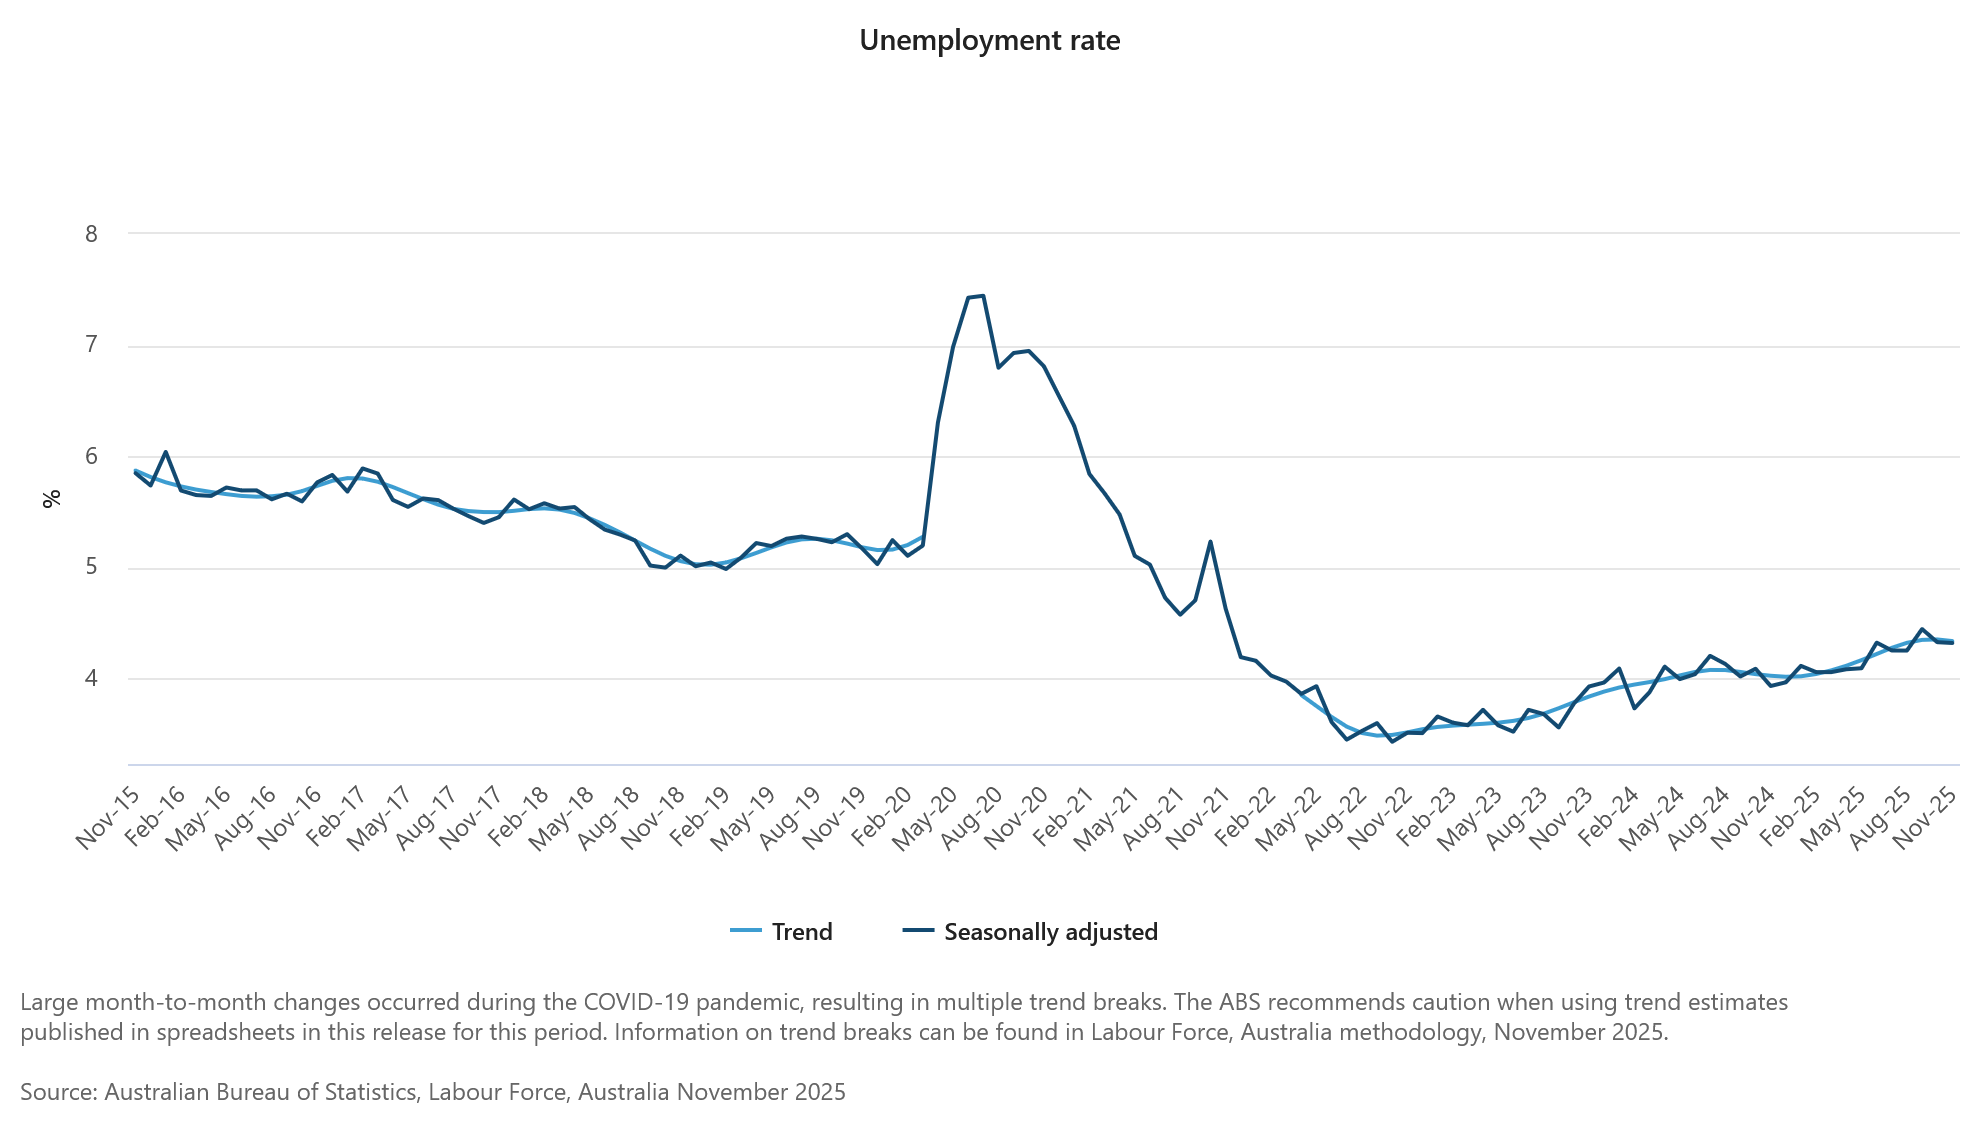
Australia jobs shock as employment drops -21.3k in November
Australia’s November labor data delivered a downside surprise, with employment falling by -21.3k against expectations for a 20k increase. The weakness was driven by a sharp -56.5k drop in full-time positions, partly offset by a 35.2k rise in part-time roles.
Despite the weaker headline, unemployment rate held at 4.3%, better than the expected uptick to 4.4%. The jobless rate has now been steady at 4.3% in five of the past six months, reflecting a labor market that is loosening but not deteriorating sharply. Participation rate dipped -0.2pts to 66.7%, suggesting some softening in labor-force engagement.
Monthly hours worked were unchanged on the month but still up 1.2% yoy, indicating modest resilience in total labor input despite weaker job creation.
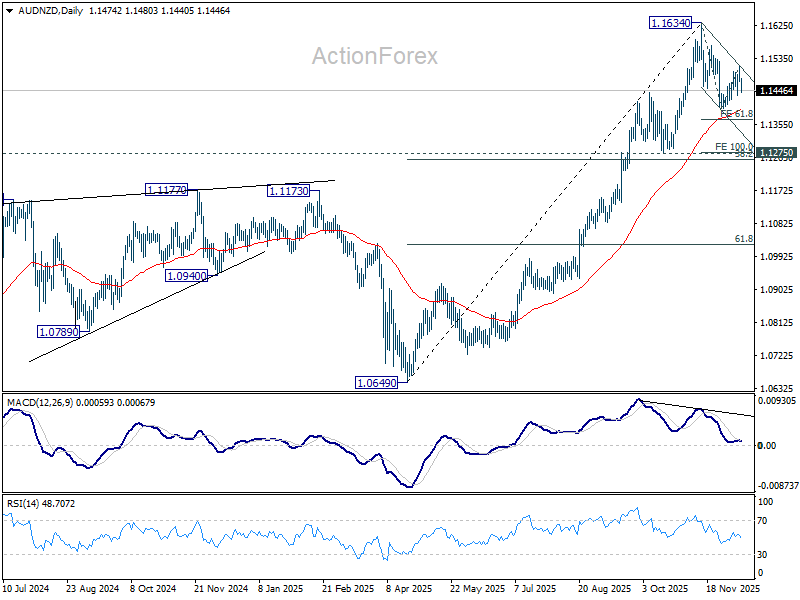
AUD/NZD to extend correction through 1.14 after data blow to RBA hike hopes
Australian Dollar weakened broadly after today’s significantly softer labor-market report, though it continues to show relative resilience against the U.S. Dollar and most majors—with the notable exception of Kiwi. The sharp downside surprise in employment has tilted sentiment in favor of further downside in AUD/NZD as markets reassess the likelihood of near-term RBA tightening.
Speculation of a 2026 RBA rate hike had intensified in recently, particularly after Governor Michele Bullock signaled that cuts were not on the horizon and that the Board had actively discussed scenarios in which rates might need to rise.
However, today’s -21.3k contraction in employment has sharply undercut that momentum. The data suggest that any discussion of a rate hike in the near term is premature. A long pause now appears the more plausible baseline—at least through Q1—while the RBA waits for a fuller run of data to determine whether underlying developments justify movement in either direction.
Technically, AUD/NZD is extending the corrective pattern from 1.1634. Today's dip suggests the recovery from, as the second leg of the correction form 1.1634, might have completed at 1.1514 already. Deeper fall would be seen to 1.1396 first.
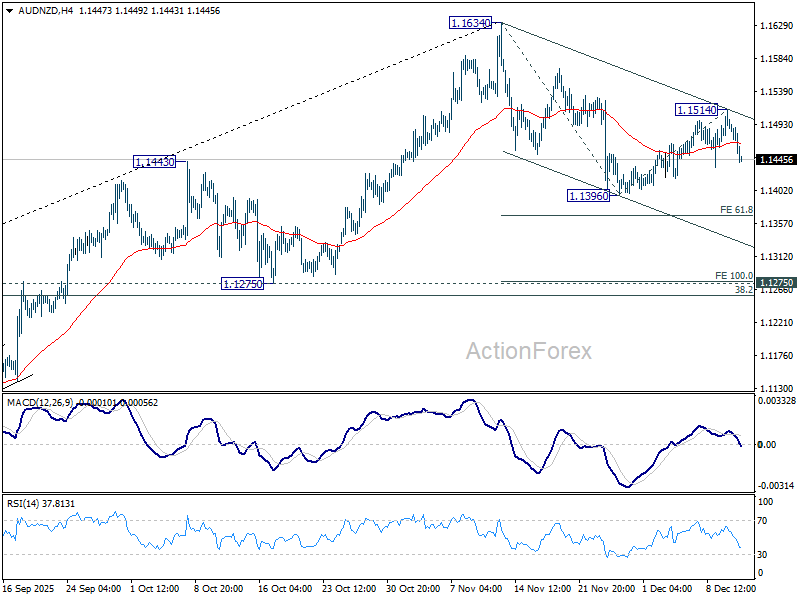
Break there will extend the fall to 61.8% projection of 1.1634 to 1.1396 from 1.1514 at 1.1367, and possibly further to 100% projection at 1.1267. But even in this case, downside should be contained by 1.1275 cluster support, which is slightly below 38.2% retracement of 1.0649 to 1.1634 at 1.1258.
The up trend from 1.0649 is expected to resume through 1.1634 at a later stage. But that will require renewed conviction that the RBA is genuinely preparing for a rate hike in 2026.
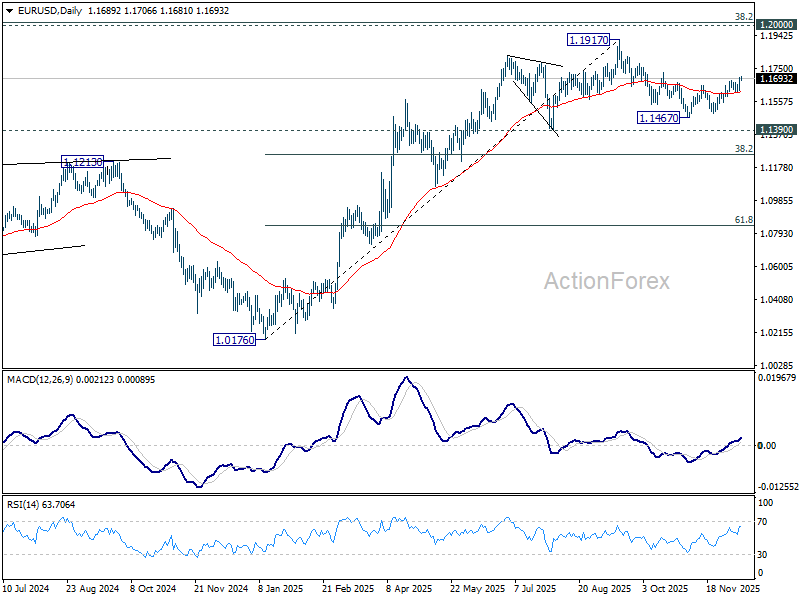
EUR/USD Daily Outlook
Daily Pivots: (S1) 1.1646; (P) 1.1673; (R1) 1.1724; More….
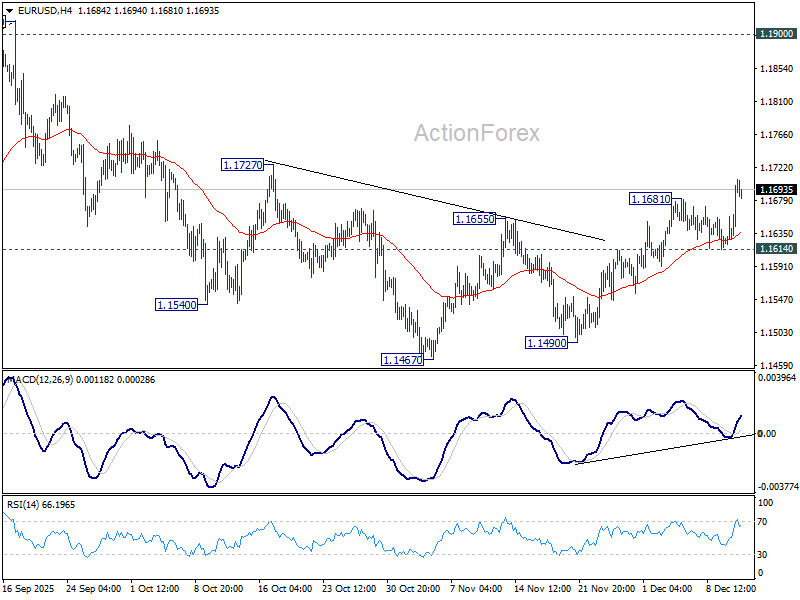
EUR/USD's rise from 1.1467 resumed by breaking through 1.1681 temporary top and intraday bias is back on the upside. As noted before, corrective fall form 1.1917 should have completed at 1.1467. Firm break of 1.1727 resistance will solidify this case and bring retest of 1.1917 high. However, break of 1.1614 support will revive near term bearishness, and bring retest of 1.1467 low.
In the bigger picture, as long as 55 W EMA (now at 1.1346) holds, up trend from 0.9534 (2022 low) is still in favor to continue. Decisive break of 1.2 key psychological level will carry larger bullish implication. However, sustained trading below 55 W EMA will argue that rise from 0.9534 has completed as a three wave corrective bounce, and keep long term outlook bearish.
A Not-So-Hawkish Fed Cut – We Maintain Our Call
In focus today
In Norway, the Regional Survey is due for release. We expect it to confirm that growth continues to rise at a moderate pace, with capacity utilization largely unchanged and indicate that the level of activity is somewhat below normal. Specifically, we expect that respondents in the survey will expect 0.3-0.4% growth next quarter, that capacity utilization will be unchanged at 35% and that the number of companies experiencing labour shortages will fall from 25% to 24%.
In Sweden, the final figures for November inflation are being published. The preliminary figures surprised to the downside, with CPI at 0.3% y/y, CPIF 2.3% y/y, and CPIF ex. energy 2.4% y/y. As preliminary estimates are generally reliable, significant revisions are unlikely. It will be interesting to analyse the details to understand the factors behind the surprise. Specifically, whether the low outcome is linked to seasonal variations or other underlying causes.
In central bank space, attention turns to the Swiss National Bank, where we forecast the rate to remain unchanged at 0.00%. The Central Bank of Turkey is also set to release its rate decision.
Economic and market news
What happened yesterday
In the US, the Federal Reserve cut its policy rate target by 25bp to 3.50-3.75% last night, as widely anticipated. Miran voted for a larger 50bp cut, while Schmid and Goolsbee dissented in favour of a hold, also in line with our expectations. We (and the markets) had expected Powell to push back against market pricing further rate cuts for 2026. However, his avoidance of strong forward guidance led to a decline in UST yields and broad USD weakening during the press conference. We maintain our Fed call and expect two final rate cuts in March and June. The Fed also announced reserve management purchases of T-bills starting 12 December at USD 40bn per month, indicating more front-loaded easing to liquidity policies than we anticipated.
Ahead of the meeting, the US Q3 Employment Cost Index signalled slightly slower-than-expected wage growth at 0.8% q/q (prior: 1.0%). This pace is close to ideal for the Fed - supporting consumption without driving inflation - and is positive for overall risk sentiment.
In Sweden, October economic activity data showed a slight decline, with lower production in the business sector as well as declining household consumption. The GDP indicator fell by 0.3% m/m, though its volatility warrants cautious interpretation. Overall, the data aligned with our expectations of slower growth for Q4, reflecting lagged effects of the summer slowdown, and does not alter the positive outlook heading into 2026.
In Norway, November core inflation declined to 3.0% y/y (cons: 3.1%, prior: 3.0%), driven by domestic and imported goods ex. food. Annual growth in household appliances and electronics dropped close to September levels, indicating that volatility was likely influenced by Black week adjustments. The print is marginally lower than Norges Bank's estimate from the September MPR at 3.1%, reinforcing the disinflationary trend. While this is unlikely to affect Norges Bank's rate path next week, it provides scope for signalling a more aggressive cutting cycle, dependent on the Regional Network survey today.
In Canada, the Bank of Canada kept the rate unchanged at 2.25% as widely expected.
In Denmark, November inflation held steady at 2.1% y/y. Food prices declined 0.9% from October, which could potentially have a positive impact on consumer sentiment.
Equities: Equity investors cheered the not-so-hawkish Fed cut yesterday. S&P 500 jumped 1% at the press conference, eventually closing 0.7% higher and small cap Russell 2000 1.3% higher. The rate decision triggered a clear cyclical preference in markets: Value cyclicals like materials, industrials, and consumer discretionary were all ~2% higher. This is interesting. Previously this year we have seen cyclical growth stocks - mag 7, basically - rallying at dovish surprises. This time, it was more of a "run it hot" reaction in markets, where expectations of stronger macro fuelled the move higher rather than lower yields. This fits our narrative very well.
One sector worth highlighting is health care, performing very strong in the risk-on session yesterday. This is a bit odd in a historical context, but health care has been behaving like a cyclical sector in recent trading. This has certainly been a tremendous rally, but we take profits today and neutralize our health care sector call. Reason for this is that the positive health care call has been a valuation call, and this argument has rapidly changed. The relative discount has gone from 20% to 10% vs global markets the last three months, which we think is a fair discount at this part of the cycle. For instance, health care now trades close to the multiple of consumer staples, after a 20% discount at the bottom.
FI and FX: Yesterday's Fed rate cut was a rather balanced one, but given that markets expected a hawkish cut, market reactions were slightly to the soft side. Rates rallied somewhat and the USD weakened a tad with EUR/USD trading at 1.169. Only tiny and transitory, negative reactions in EUR/SEK and EUR/NOK following the FOMC decision. Ahead of the Fed rate decision European rates rose once again, resulting in the fifth consecutive day of higher rates. Potential rate cuts for the ECB have by now been eliminated for 2026. This morning, EUR/SEK is back at 10.84 and EUR/NOK trades at 11.83.
AUD/NZD to extend correction through 1.14 after data blow to RBA hike hopes
Australian Dollar weakened broadly after today’s significantly softer labor-market report, though it continues to show relative resilience against the U.S. Dollar and most majors—with the notable exception of Kiwi. The sharp downside surprise in employment has tilted sentiment in favor of further downside in AUD/NZD as markets reassess the likelihood of near-term RBA tightening.
Speculation of a 2026 RBA rate hike had intensified in recently, particularly after Governor Michele Bullock signaled that cuts were not on the horizon and that the Board had actively discussed scenarios in which rates might need to rise.
However, today’s -21.3k contraction in employment has sharply undercut that momentum. The data suggest that any discussion of a rate hike in the near term is premature. A long pause now appears the more plausible baseline—at least through Q1—while the RBA waits for a fuller run of data to determine whether underlying developments justify movement in either direction.
Technically, AUD/NZD is extending the corrective pattern from 1.1634. Today's dip suggests the recovery from, as the second leg of the correction form 1.1634, might have completed at 1.1514 already. Deeper fall would be seen to 1.1396 first.
Break there will extend the fall to 61.8% projection of 1.1634 to 1.1396 from 1.1514 at 1.1367, and possibly further to 100% projection at 1.1267. But even in this case, downside should be contained by 1.1275 cluster support, which is slightly below 38.2% retracement of 1.0649 to 1.1634 at 1.1258.
The up trend from 1.0649 is expected to resume through 1.1634 at a later stage. But that will require renewed conviction that the RBA is genuinely preparing for a rate hike in 2026.
Australia jobs shock as employment drops -21.3k in November
Australia’s November labor data delivered a downside surprise, with employment falling by -21.3k against expectations for a 20k increase. The weakness was driven by a sharp -56.5k drop in full-time positions, partly offset by a 35.2k rise in part-time roles.
Despite the weaker headline, unemployment rate held at 4.3%, better than the expected uptick to 4.4%. The jobless rate has now been steady at 4.3% in five of the past six months, reflecting a labor market that is loosening but not deteriorating sharply. Participation rate dipped -0.2pts to 66.7%, suggesting some softening in labor-force engagement.
Monthly hours worked were unchanged on the month but still up 1.2% yoy, indicating modest resilience in total labor input despite weaker job creation.
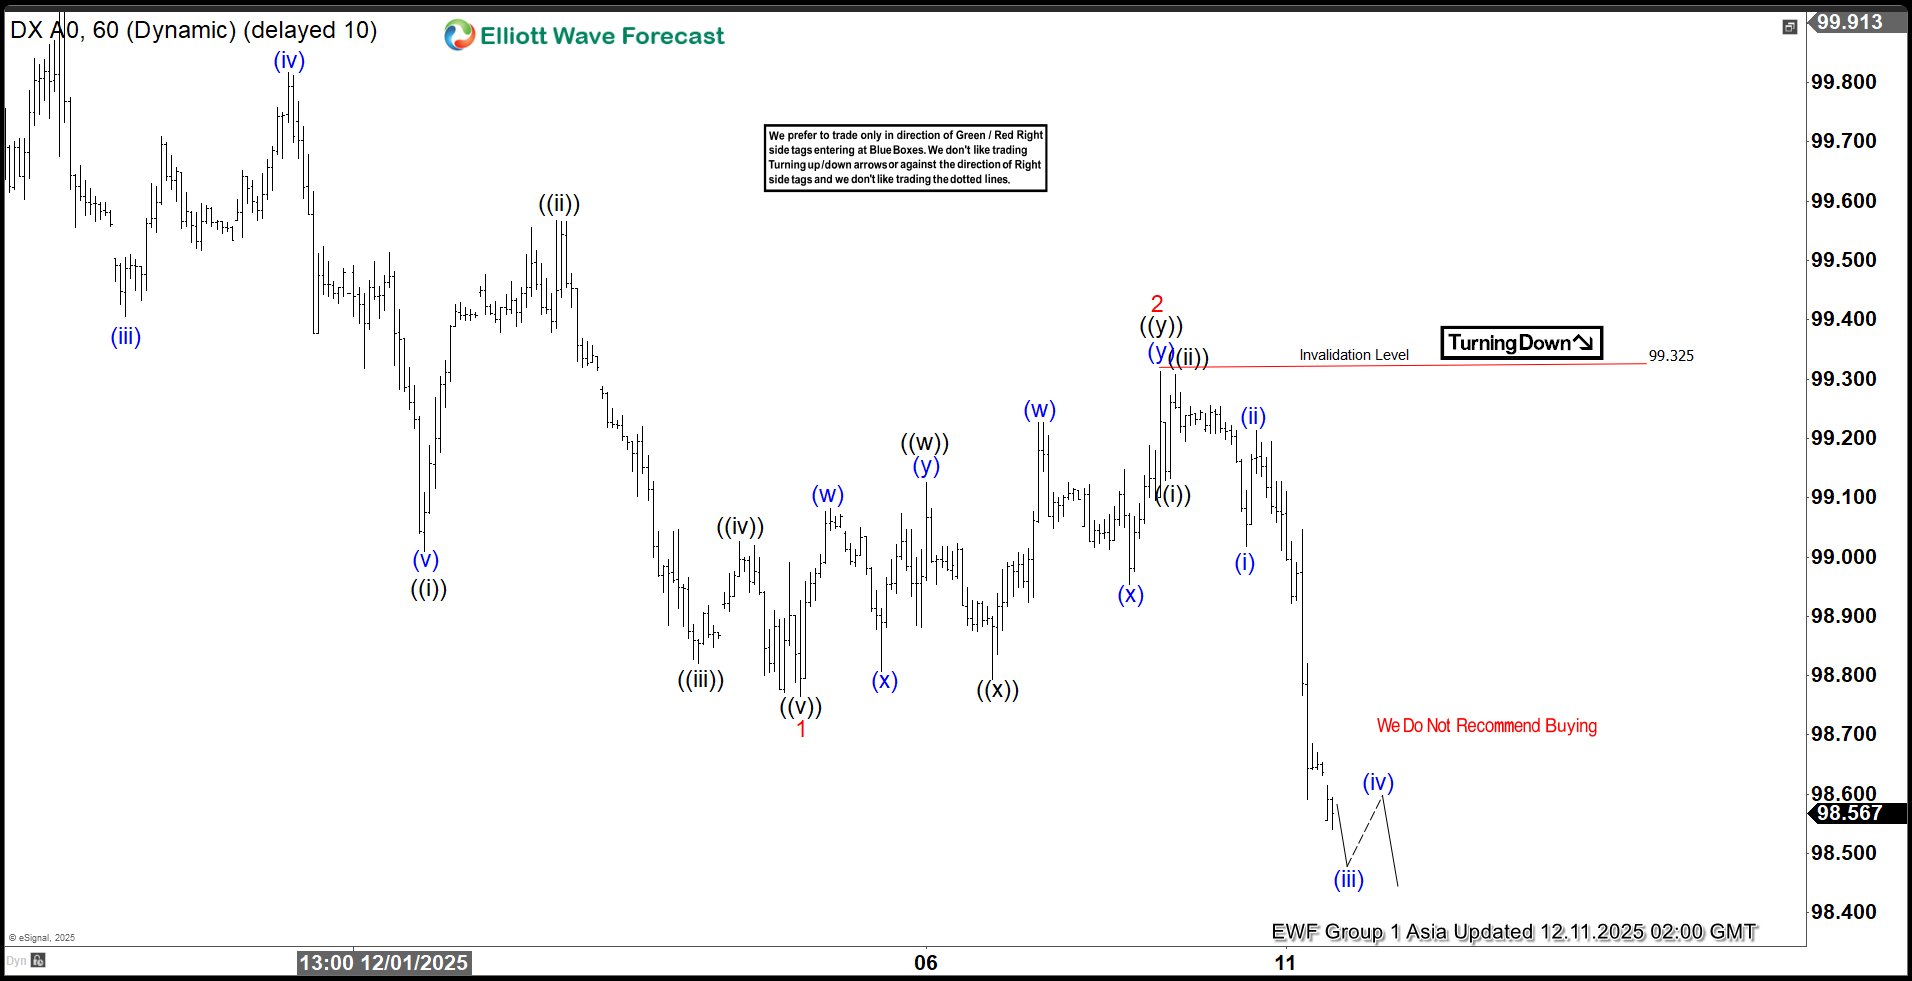
Dollar Index (DXY) Bearish Sequence Targets 97.7
The Dollar Index (DXY) has broken decisively below the December 4 low at 98.76, establishing a clear bearish sequence from the November 21 peak. This structural decline favors continued downside momentum. The immediate target is the 100% Fibonacci extension measured from the November 21 peak, which projects toward 97.7. From that peak, wave ((i)) concluded at 99, followed by a corrective rally in wave ((ii)) that terminated at 99.56. The Index then extended lower in wave ((iii)) toward 98.82, while the subsequent rally in wave ((iv)) ended at 99.02. The final leg, wave ((v)), reached 98.76, thereby completing wave 1 of a higher degree cycle.
Following this initial decline, the Index staged a corrective advance in wave 2, unfolding as a double three Elliott Wave structure. From the termination of wave 1, wave ((w)) ended at 99.12, while the pullback in wave ((x)) concluded at 98.79. A final push higher in wave ((y)) reached 99.32, completing wave 2 in higher degree. With this correction finished, the Index has resumed its downward trajectory in wave 3. From the wave 2 high, wave ((i)) ended at 99.13, and the rally in wave ((ii)) terminated at 99.3. In the near term, as long as the pivot at 99.32 remains intact, rallies are expected to fail. The decline should continue to unfold in sequences of 3, 7, or 11 swings, reinforcing the bearish outlook and favoring further downside pressure toward the projected Fibonacci target.
Dollar Index (DXY) 60-Minute Elliott Wave Chart From 12.11.2025
DXY Elliott Wave Video:
https://www.youtube.com/watch?v=LYOYWjRAiNU
GBP/USD Takes Off After Fed Move—Is More Dollar Weakness Ahead?
Key Highlights
- GBP/USD gained pace for a move above the 1.3350 resistance.
- A key bullish trend line is forming with support at 1.3325 on the 4-hour chart.
- EUR/USD rallied above 1.1650 and 1.1680.
- USD/JPY saw a bearish reaction after the Fed rate cut of 0.25%.
GBP/USD Technical Analysis
The British Pound started a strong increase above 1.3320 against the US Dollar. GBP/USD even cleared the 1.3350 barrier to enter a positive zone.
Looking at the 4-hour chart, the pair settled above the 1.3350 level, the 100 simple moving average (red, 4-hour), and the 200 simple moving average (green, 4-hour). A high was formed at 1.3392, and the pair is now consolidating gains.
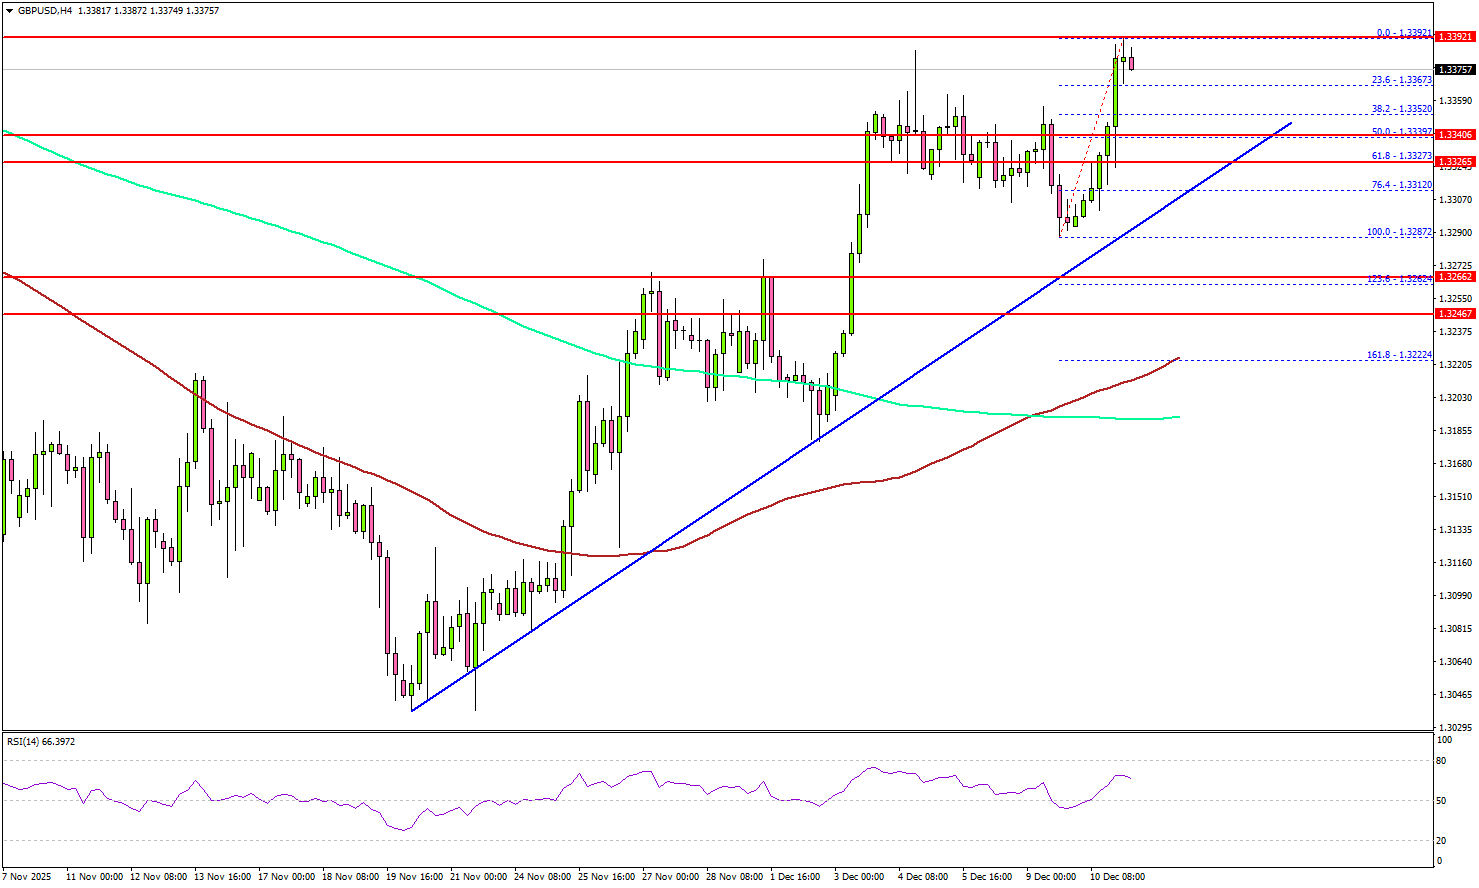
There is also a key bullish trend line forming with support at 1.3325. Immediate resistance sits near 1.3390. The first key hurdle is seen near 1.3400.
A close above 1.3400 could open the doors for a move toward 1.3450. Any more gains could set the pace for a steady increase toward 1.3500. On the downside, there is key support at 1.3340 and the 50% Fib retracement level of the upward move from the 1.3287 swing low to the 1.3392 high.
The next support is 1.3325 and the trend line. A close below 1.3325 could open the doors for a test of 1.3280. The main support sits near the confluence zone at 1.3220, and the 100 simple moving average (red, 4-hour).
Looking at EUR/USD, the pair gained pace for a strong increase and was able to clear the 1.1680 resistance zone.
Upcoming Key Economic Events:
- US Initial Jobless Claims - Forecast 220K, versus 191K previous.
FOMC Perceive Their Goals to be Within Reach, But Risks Remain
The FOMC is optimistic on growth and inflation. Westpac sees uncertainty on both fronts.
The FOMC cut the fed funds rate by 25bps to a midpoint of 3.625% at their December meeting as the market had hoped. However, the Committee held to September’s projection of just one more cut in 2026 and another in 2027 to a broadly neutral rate of 3.125% by end-2027 compared to the market’s expectation for a return to neutral policy by end-2026.
Warranting a slow normalisation of policy, the FOMC now expects above-trend growth in 2027 (2.3% from 1.8% in September) and 2028 (2.0% from 1.9%), arguably because of support for consumption from real income growth and as the AI-related infrastructure build out continues. In the press conference, Chair Powell also noted that 0.2ppts of growth had been transferred from 2025 to 2026 because of late-2025’s Government shutdown. The unemployment rate profile is little changed, expected to grind lower to the full employment level of 4.2% in 2028.
The Committee showed little concern over the inflation outlook, with a measured descent in annual core inflation forecast from 3.0% in 2025 to 2.5% in 2026, then 2.1% in 2027 and 2.0% in 2028. In effect, moderately restrictive policy is expected to prove successful over time, allowing the FOMC to meet both sides of its mandate.
Westpac believes the US faces material capacity constraints across power, logistics and other essential services owing to a lack of breadth in business investment and given migration reform. We expect this constraint to hold activity growth around trend, versus the FOMC’s more optimistic view, and to result in greater persistence in inflation and associated risks.
Our forward view for the fed funds rate is consistent with the FOMC’s for 2026, with the cut most likely to come in early-2026 before inflation’s persistence becomes a concern. But thereafter we expect the Committee to remain on hold at 3.375% and for inflation risks to bias up long-term yields, along with growing fiscal uncertainty.
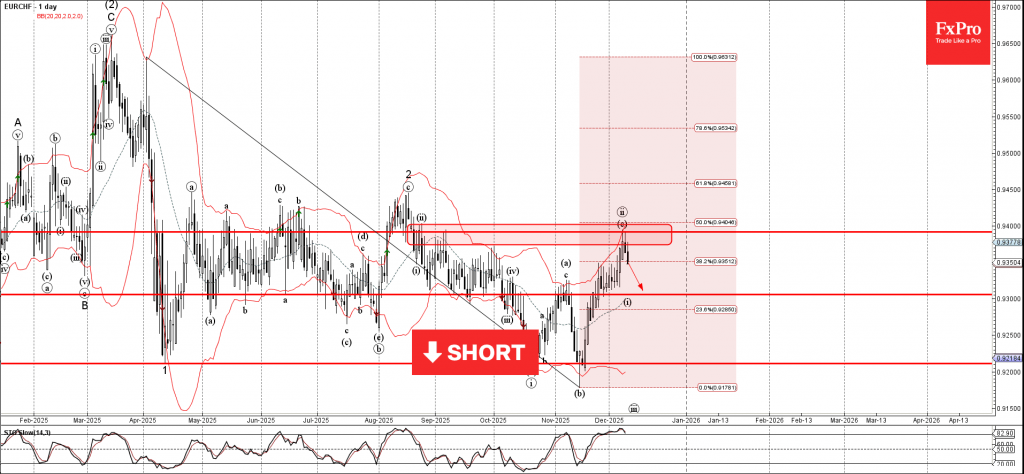
EURCHF Wave Analysis
EURCHF: ⬇️ Sell
- EURCHF reversed from resistance area
- Likely to fall to support level 0.9300
EURCHF currency pair recently reversed up from the resistance area between the resistance level 0.9390 (former monthly high from September), upper daily Bollinger Band and the 50% Fibonacci correction of the downward impulse from April.
The downward reversal from this resistance zone stopped the previous minor ABC correction ii from November.
Given the overbought daily Stochastic and clear daily downtrend, EURCHF currency pair can be expected to fall to the next support level 0.9300.
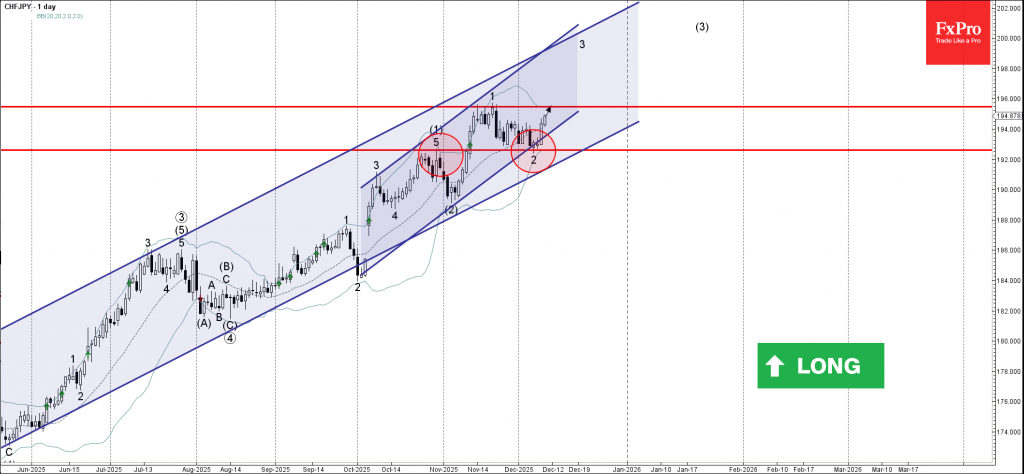
CHFJPY Wave Analysis
CHFJPY: ⬆️ Buy
- CHFJPY reversed from pivotal support level 192.60
- Likely to rise to resistance level 195.50
CHFJPY currency pair recently reversed up from the support zone between the pivotal support level 192.60 (former monthly high from October) and the support trendline of the daily up channel from October.
The upward reversal from this support zone started the active impulse wave 3 of the intermediate impulse wave (3) from the start of November.
Given the overriding uptrend on the daily charts, CHFJPY currency pair can be expected to rise to the next resistance level 195.50 (which stopped wave 1).