Sample Category Title
USD/JPY Pauses as Yen Resists Downward Pressure
The USD/JPY pair is consolidating near 156.57 on Wednesday, pausing after three consecutive days of gains. This stability comes despite a notable shift in rhetoric from Bank of Japan (BoJ) Governor Kazuo Ueda, who stated the central bank is drawing closer to sustainably achieving its 2% inflation target – a strong signal that a policy tightening move could be imminent.
The market is now actively pricing in the possibility of a rate hike as early as next week’s BoJ meeting. Investors’ primary focus will be on Governor Ueda’s post-meeting comments, which are expected to shape the policy outlook for 2025.
The yen’s broader weakness is being fuelled by growing concerns over Japan’s public finances, exacerbated by expanded fiscal spending under Prime Minister Sanae Takaichi’s administration. Furthermore, the yawning interest rate differential between Japan and other major economies continues to incentivise short positions against the yen, which remains one of the world’s lowest-yielding currencies.
Technical Analysis: USD/JPY
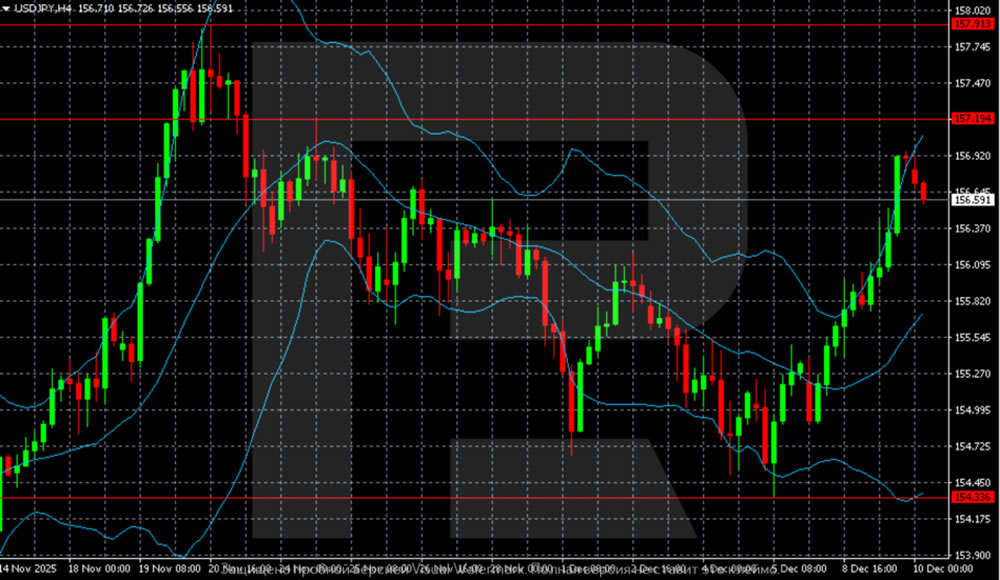
H4 Chart:
On the H4 chart, USD/JPY maintains its bullish structure following a strong impulse that propelled the price from 154.30 to the key resistance zone of 157.20–157.90. The pair is currently consolidating just below the 157.20 level, where selling pressure has previously emerged.
The price holding above the middle Bollinger Band confirms buyers retain overall control. The expansion of the upper band indicates elevated volatility and suggests the market is gathering strength for another attempt to breach resistance.
A decisive breakout and consolidation above 157.20 would open the path towards the 157.90–158.00 area. Should a correction unfold, the nearest significant support sits at 155.60. A break below this level would signal a deeper pullback, potentially targeting the major demand zone and the lower Bollinger Band near 154.30.
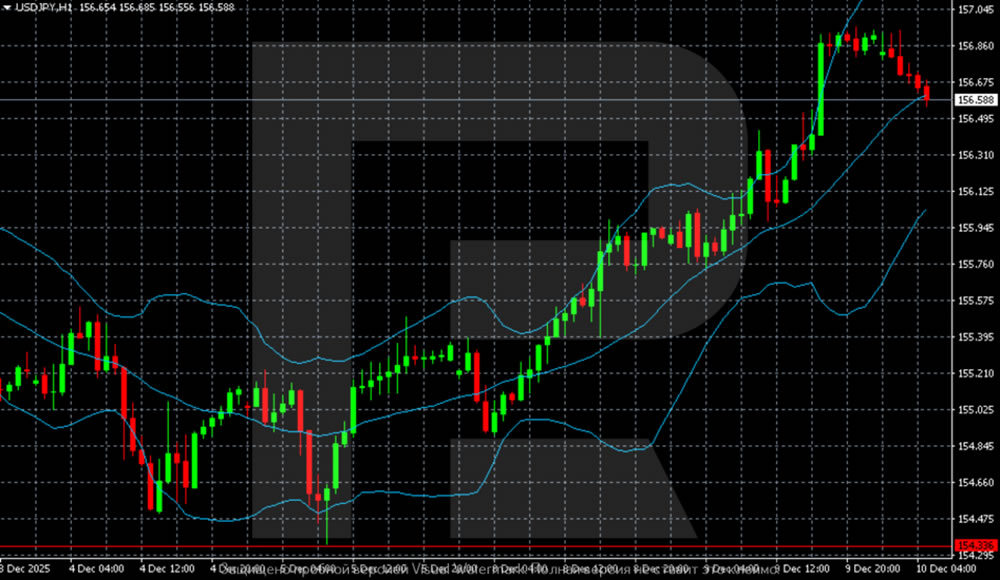
H1 Chart:
On the H1 chart, USD/JPY is undergoing a pullback after its recent surge to 157.20. The decline has found tentative support near the middle Bollinger Band, with the pair attempting to stabilise around 156.50.
The near-term structure remains bullish, supported by the price’s position above the middle Bollinger Band. Dynamic support is forming in the 156.00–156.10 zone, aligned with the indicator’s lower band. The Stochastic oscillator has turned down from overbought territory, confirming the current short-term corrective phase.
For the uptrend to resume, buyers must reclaim the 157.20 level, which would pave the way for a test of 157.90. Conversely, a sustained break below 156.00 would be the first clear sign of bullish exhaustion, increasing the probability of a deeper decline towards 155.60.
Conclusion
USD/JPY is at a critical juncture, caught between bullish technical momentum and a shifting fundamental backdrop for the yen. While the pair’s uptrend remains technically intact, the impending BoJ decision introduces significant event risk. A hawkish shift from the central bank could catalyse a sharp correction. In the near term, the 157.20 resistance and 156.00 support levels are pivotal; a breakout from this range will determine the next directional move.
S&P 500 Index: Chart Analysis Ahead of Fed News
On 2 December, we noted that the final month of the year is traditionally favourable for the S&P 500 index (US SPX 500 mini on FXOpen), as:
→ since around the 1950s, December has been positive in more than 70% of cases;
→ the average monthly gain is approximately +1.0%.
Today, with traders worldwide focused on the Federal Reserve’s interest rate decision and Chair Powell’s subsequent press conference, there is reason to highlight another statistic. According to media reports, in 20 out of 20 instances when equity markets were near record highs and the Fed cut rates, the S&P 500 rose over the following 12 months.
Given the current backdrop — proximity to all-time highs and expectations of rate cuts — it is possible that this could become the 21st such case.
An analysis of price action on the 4-hour chart of the S&P 500 (US SPX 500 mini on FXOpen) suggests that the stock market is reflecting nervous anticipation of the news, as the index is trading at roughly the same levels as at the start of December.
Technical Analysis of the S&P 500 Chart
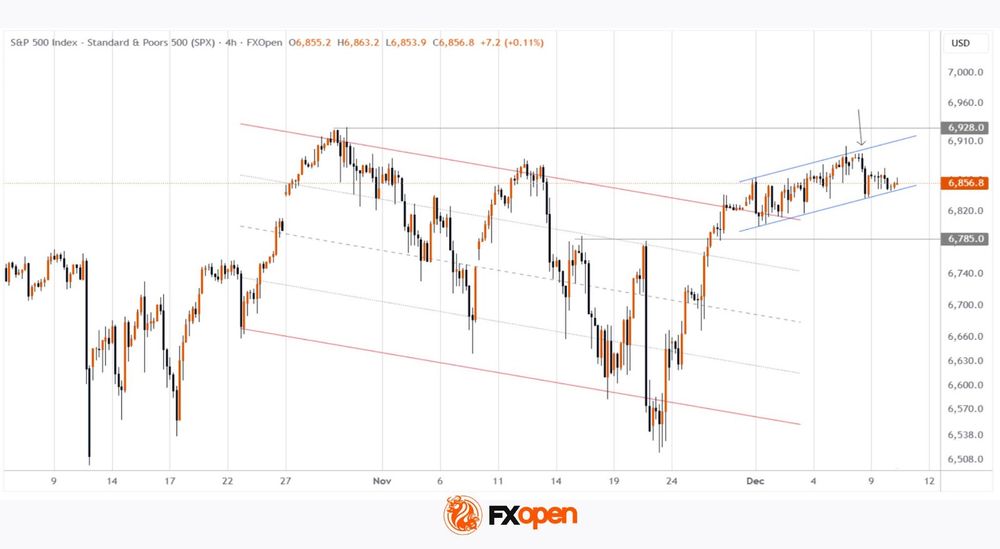
From the demand side:
→ the price has managed to hold firmly above the 6785 level (which may act as support going forward) and has broken above a previously formed descending channel (shown in red);
→ an ascending channel formed in early December, which can be interpreted as cautious optimism ahead of the news.
From the supply side:
→ the late-October record high may act as psychological resistance;
→ yesterday’s decline (indicated by the arrow) suggests that bears are ready to act more aggressively if given a catalyst.
Overall, taking the above into account, it is reasonable to suggest that the S&P 500 market (US SPX 500 mini on FXOpen) is in a “calm before the storm” phase. Be prepared for volatility spikes later today, starting from 22:00 GMT+3.
Trade global index CFDs with zero commission and tight spreads. Open your FXOpen account now or learn more about trading index CFDs with FXOpen.
This article represents the opinion of the Companies operating under the FXOpen brand only. It is not to be construed as an offer, solicitation, or recommendation with respect to products and services provided by the Companies operating under the FXOpen brand, nor is it to be considered financial advice.
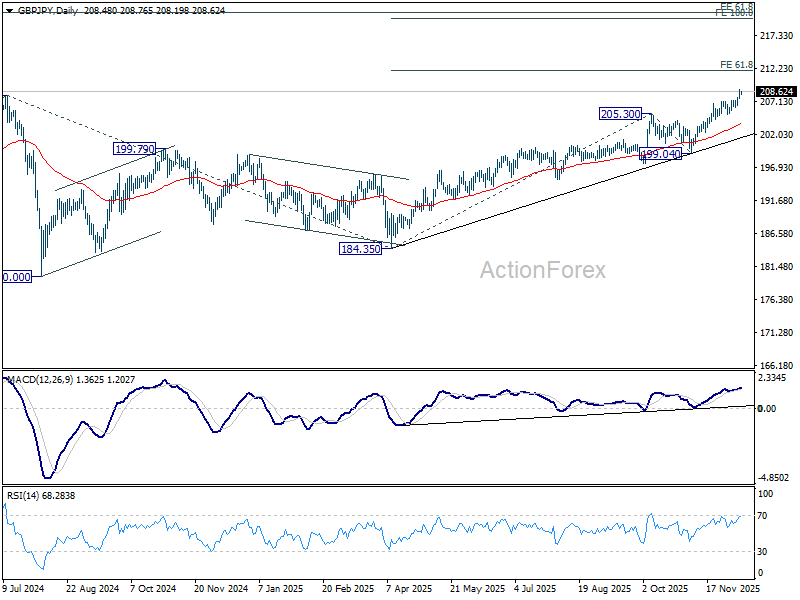
GBP/JPY Daily Outlook
Daily Pivots: (S1) 207.84; (P) 208.39; (R1) 209.20; More...
GBP/JPY's break of 208.09 high confirms long term up trend resumption. Intraday bias stays on the upside for next near term target at 61.8% projection of 184.35 to 205.30 from 199.04 at 211.98. Outlook will stay bullish as long as 205.17 support holds, in case of retreat.
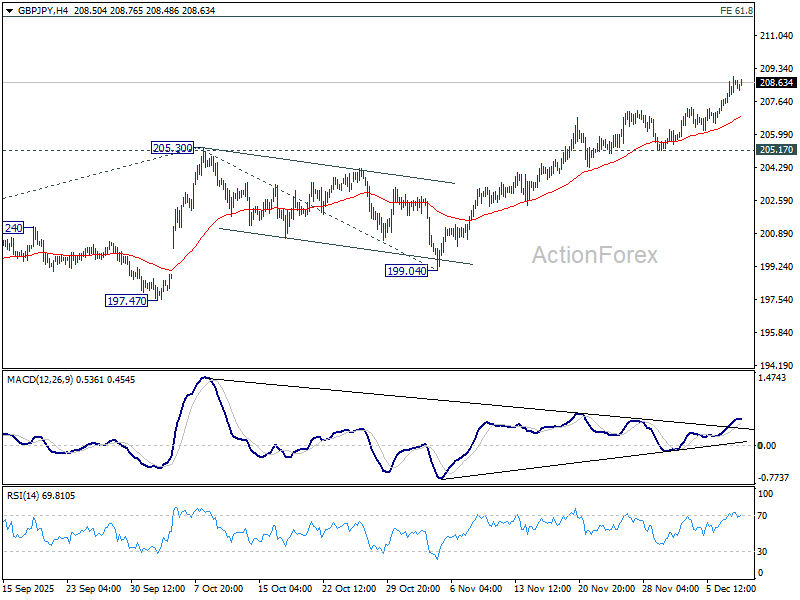
In the bigger picture, up trend from 123.94 (2020 low) is resuming. Next target is 61.8% projection of 148.93 to 208.09 from 184.35 at 220.90. On the downside, break of 199.04 support is needed to be the first sign of medium term topping. Otherwise, outlook will stay bullish even in case of deep pullback.
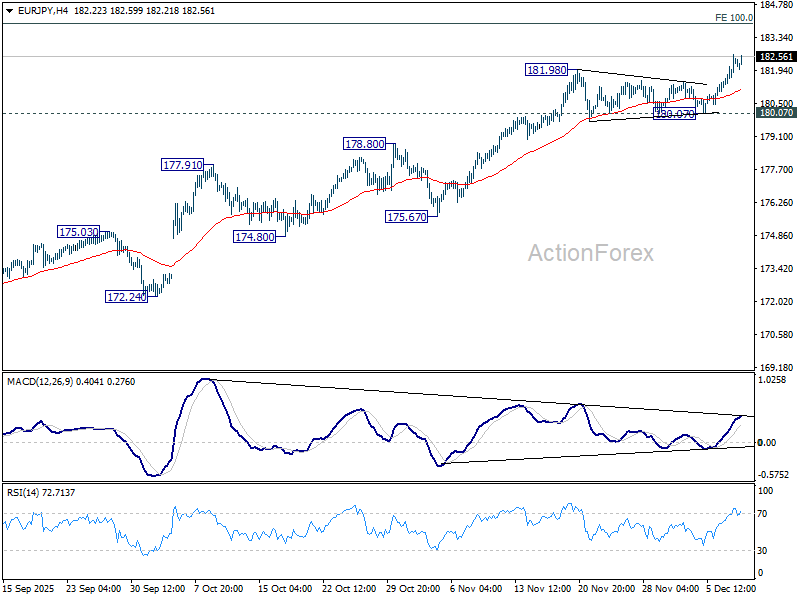
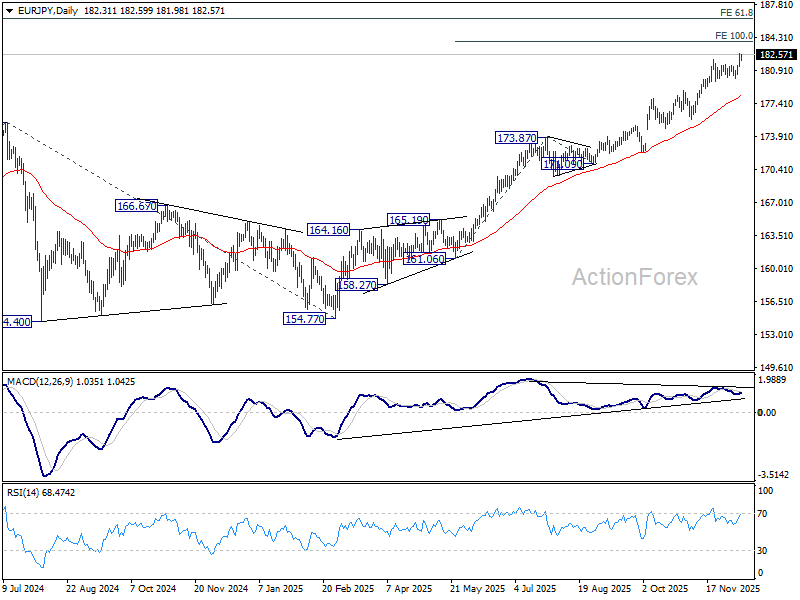
EUR/JPY Daily Outlook
Daily Pivots: (S1) 181.54; (P) 182.10; (R1) 182.96; More...
EUR/JPY's up trend resumed by breaking through 181.98 and intraday bias is back on the upside. Next target is 100% projection of 161.06 to 173.87 from 171.09 at 183.90. For now, outlook will remain bullish as long as 180.07 support holds, in case of retreat.
In the bigger picture, up trend from 114.42 (2020 low) is in progress and should target 61.8% projection of 124.37 to 175.41 from 154.77 at 186.31. However, considering bearish divergence condition in D MACD, upside should be capped by 186.31 on first attempt. Outlook will continue to stay bullish as long as 55 W EMA (now at 170.25) holds, even in case of deep pullback.
EUR/GBP Daily Outlook
Daily Pivots: (S1) 0.8725; (P) 0.8737; (R1) 0.8753; More…
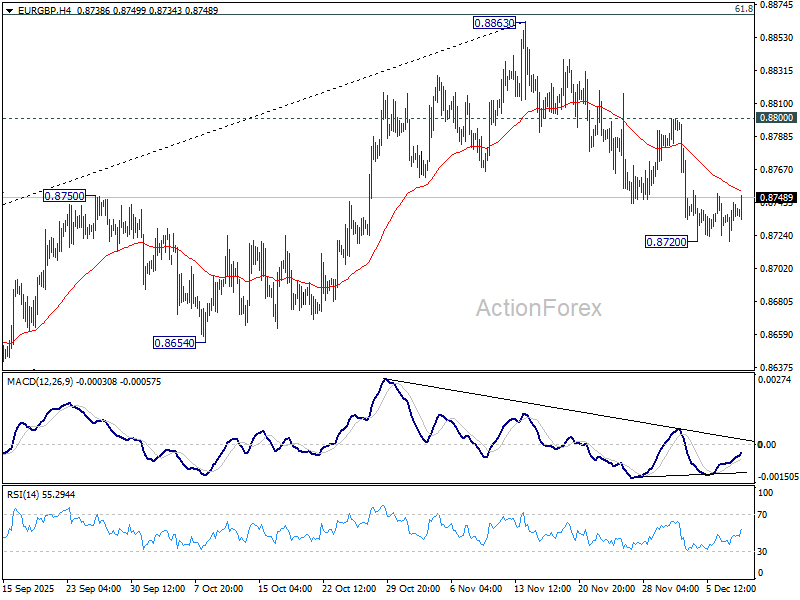
EUR/GBP is staying in consolidations above 0.8720 temporary low and intraday bias stays neutral. Further decline is expected with 0.8800 resistance intact. Fall from 0.8863 should at least be a correction to the up trend from 0.8221, with risk of bearish reversal. Below 0.8720 will target 0.8631 cluster (38.2% retracement of 0.8221 to 0.8663 at 0.8618).
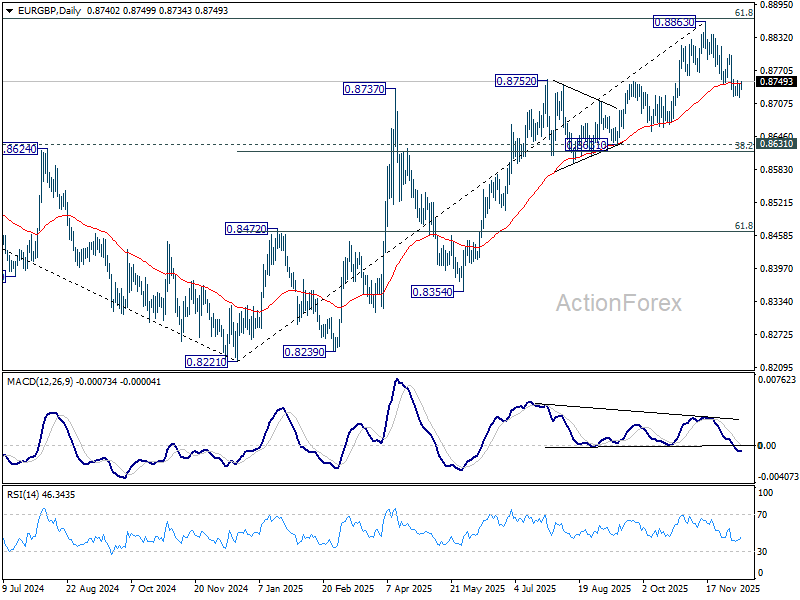
In the bigger picture, rise from 0.8221 medium term bottom is still seen as a corrective move. Upside should be limited by 61.8% retracement of 0.9267 to 0.8221 at 0.8867. Sustained trading below 55 W EMA (now at 0.8600) should confirm that this corrective bounce has completed. However, decisive break of 0.8867 will suggest that EUR/GBP is already reversing whole decline from 0.9267 (2022 high). That should pave the way back to 0.9267.
EUR/AUD Daily Outlook
Daily Pivots: (S1) 1.7499; (P) 1.7565; (R1) 1.7599; More...
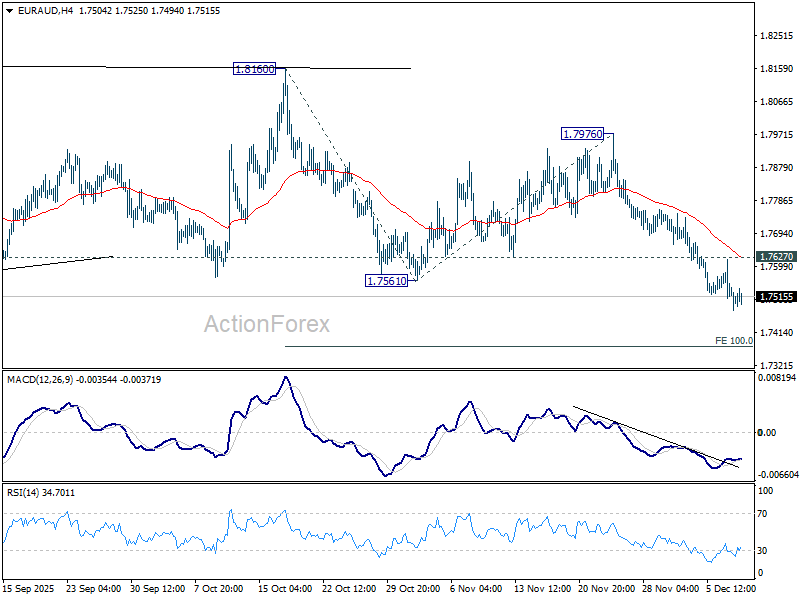
Intraday bias in EUR/AUD remains mildly on the downside for the moment. Fall from 1.8160 is seen as the third leg of the pattern from 1.8554. Deeper decline should be seen to 100% projection of 1.8160 to 1.7561 from 1.7976 at 1.7377. Firm break there will pave the way to 138.2% projection at 17148. On the upside, above 1.7627 minor resistance will turn intraday bias neutral and bring consolidations first, before staging another fall.
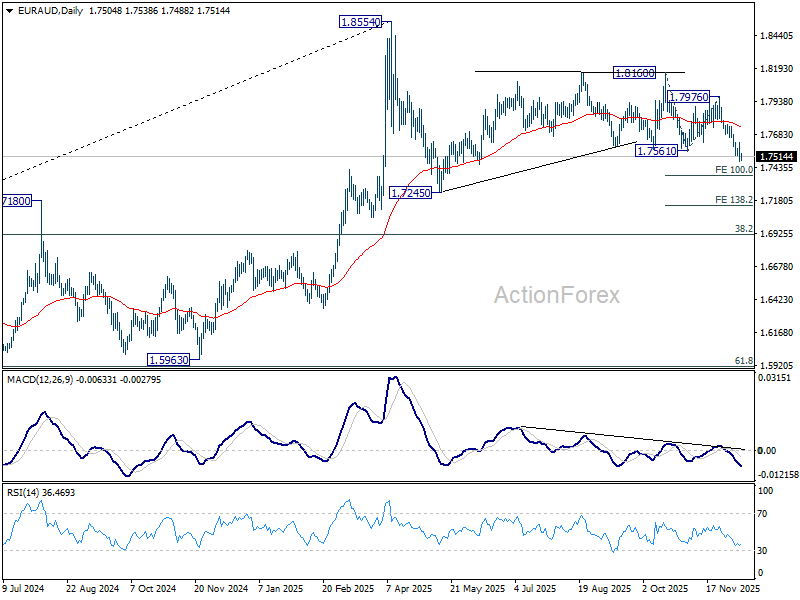
In the bigger picture, as long as 55 W EMA (now at 1.7456) holds, price actions from 1.8554 could still be a correction to rise from 1.5963 only. However, sustained break of the EMA will argue that it's already correcting the whole up trend from 1.4281 (2022 low). In this case, deeper decline would be seen to 38.2% retracement of 1.4281 to 1.8554 at 1.6922.
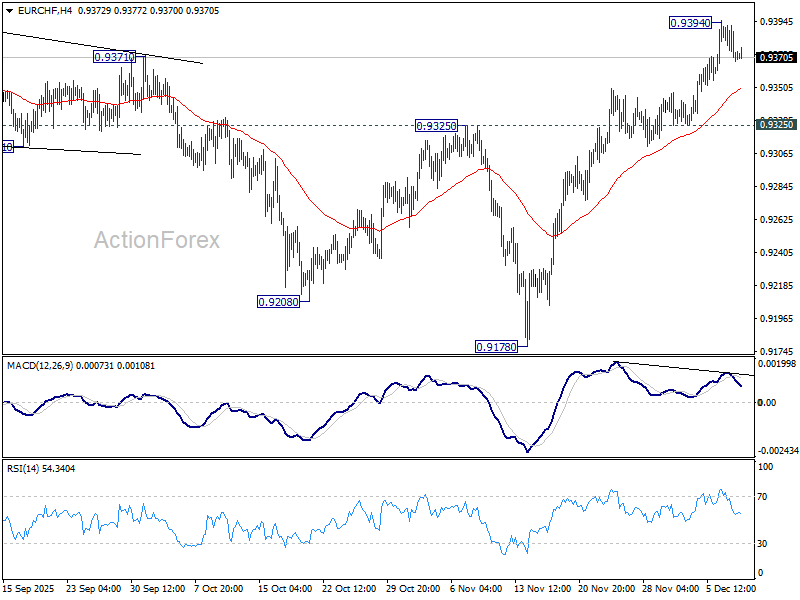
EUR/CHF Daily Outlook
Daily Pivots: (S1) 0.9362; (P) 0.9380; (R1) 0.9390; More....
Intraday bias in EUR/CHF is turned neutral with current retreat and some consolidations could be seen below 0.9394 temporary top. Further rise is expected as long as 0.9325 support holds. Above 0.9394 will resume the rebound from 0.9178 to 0.9452 key structural resistance. Decisive break there will carry larger bullish implications.
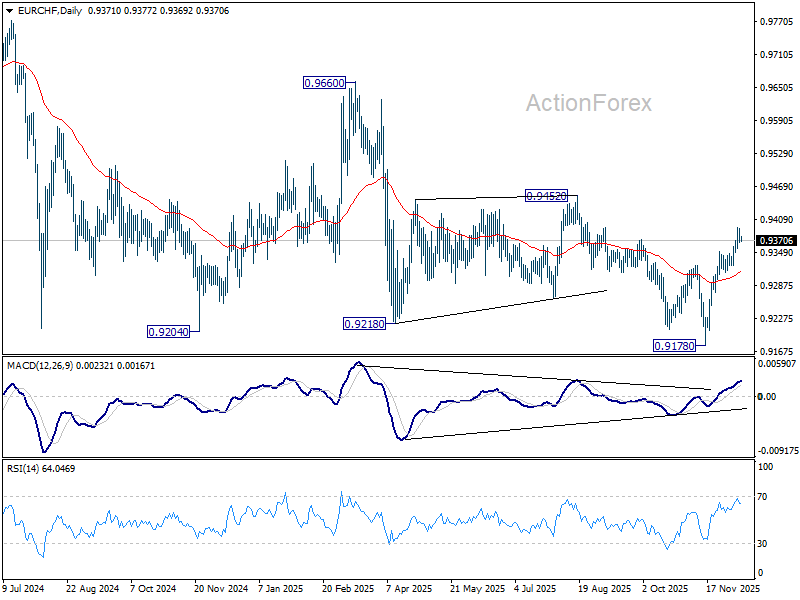
In the bigger picture, EUR/CHF has breached long term falling channel resistance as the rebound from 0.9278 extends. Considering bullish convergence condition in W MACD, sustained trading above 55 W EMA (now at 0.9372) will indicate medium term bottoming, and suggests that it's already in larger scale rebound. Further break of 0.9452 resistance will bring stronger medium term rally towards 0.9228 resistance next. Nevertheless, rejection by 55 W EMA will retain bearishness for another fall through 0.9278 at a later stage.
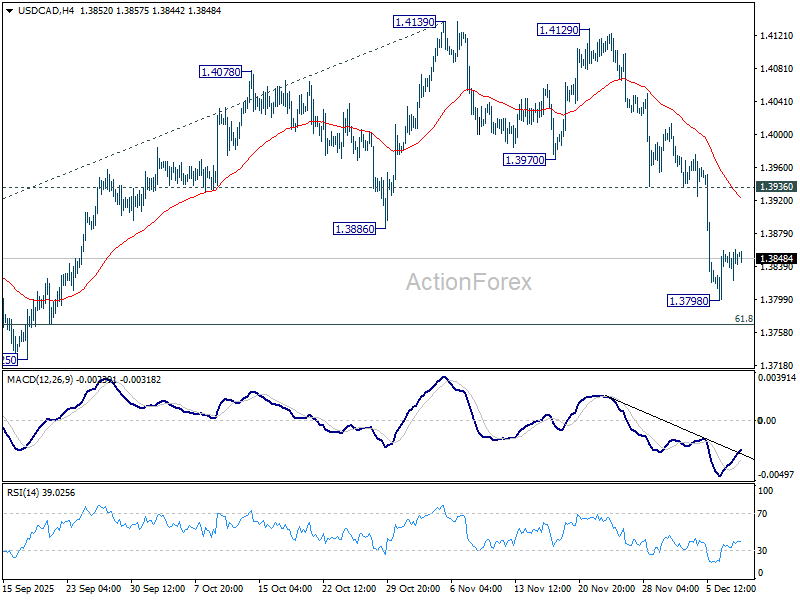
USD/CAD Daily Outlook
Daily Pivots: (S1) 1.3826; (P) 1.3844; (R1) 1.3863; More...
Intraday bias in USD/CAD stays neutral and more consolidations would be seen above 1.3798 temporary low. Upside of recovery should be limited below 1.3936 support turned resistance. on the downside, break of 1.3798 will resume the fall from 1.4139 to 61.8% retracement of 1.3538 to 1.4139 at 1.3768. Firm break there will argue that whole decline form 1.4791 might be ready to resume through 1.3538 low.
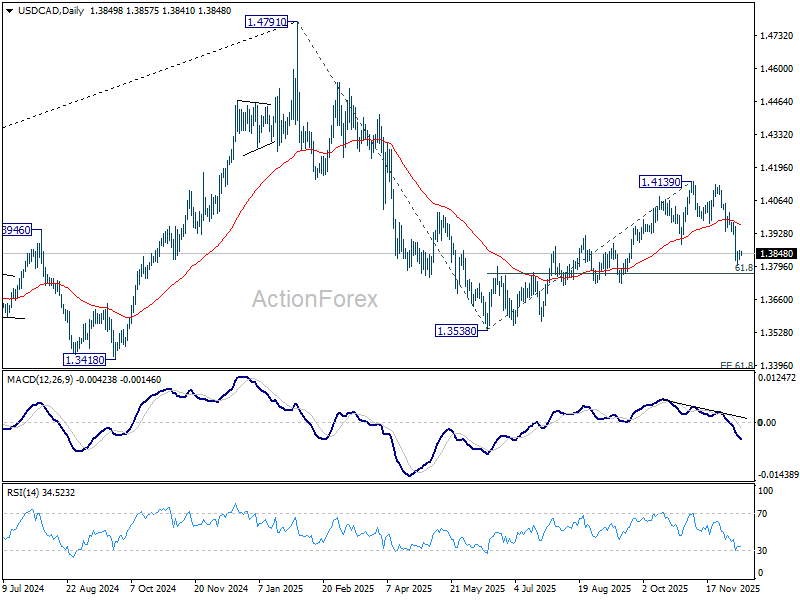
In the bigger picture, current development suggests that price actions from 1.4791 is developing into a deeper, larger scale correction. In the less bearish case, it's just correcting the rise from 1.2005 (2021 low). But even so, break of 1.3538 will pave the way to 61.8% projection of 1.4791 to 1.3538 from 1.4139 at 1.3365. This will remain the favored case as long as 1.4139 resistance holds, in case of rebound.
AUD/USD Daily Report
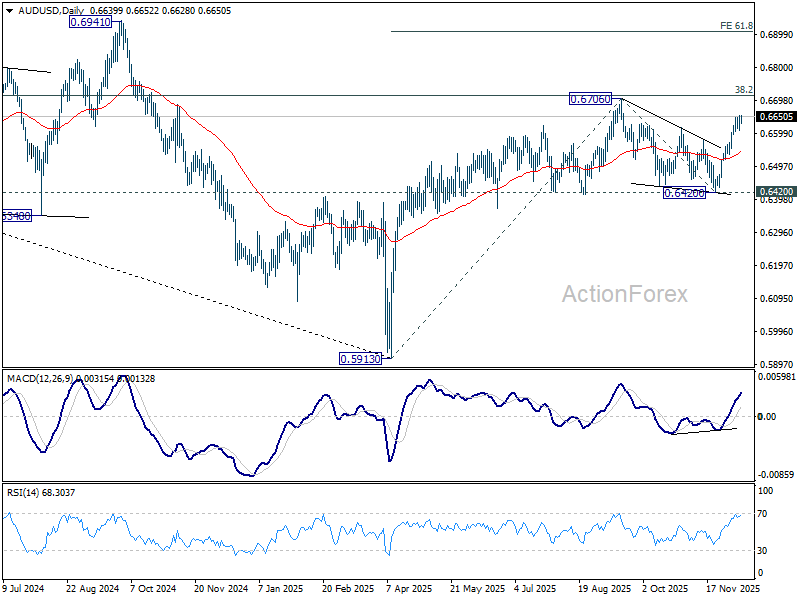
Daily Pivots: (S1) 0.6616; (P) 0.6635; (R1) 0.0.6661; More...
AUD/USD's rise from 0.6420 is in progress and intraday bias stays on the upside for retesting 0.6705 high. Decisive break there will confirm and target 61.8% projection of 0.5913 to 0.6706 from 0.6420 at 0.6910. On the downside, below 0.6607 minor support will turn intraday bias neutral and bring consolidations, before staging another rise.
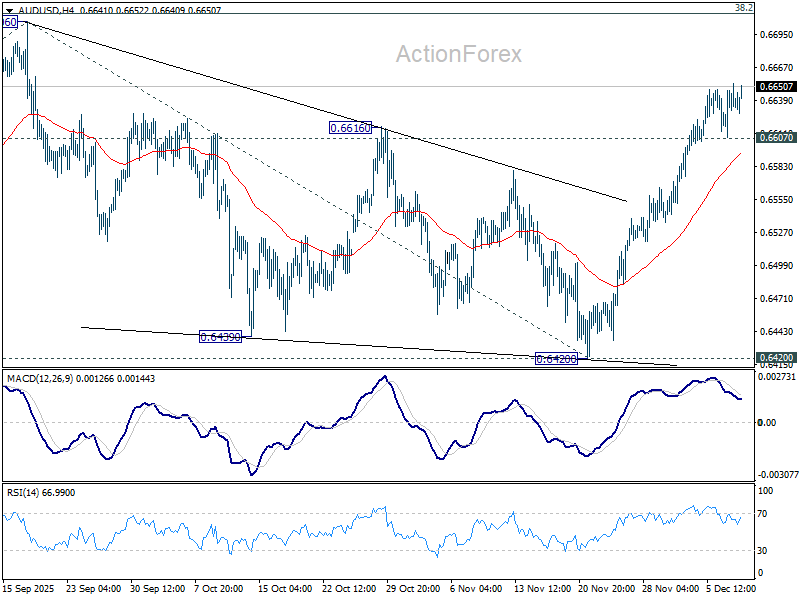
In the bigger picture, the break of multi-year falling trend line resistance suggests that rise from 0.5913 is possibly reversing whole down trend from 08006 (2021 high). Decisive break of 38.2% retracement of 0.8006 to 0.5913 at 0.6713 will solidify this case, and bring further rally to 61.8% retracement at 0.7206. On the downside, however, firm break of 0.6420 support will suggest rejection by 0.6713 and retain medium term bearishness.
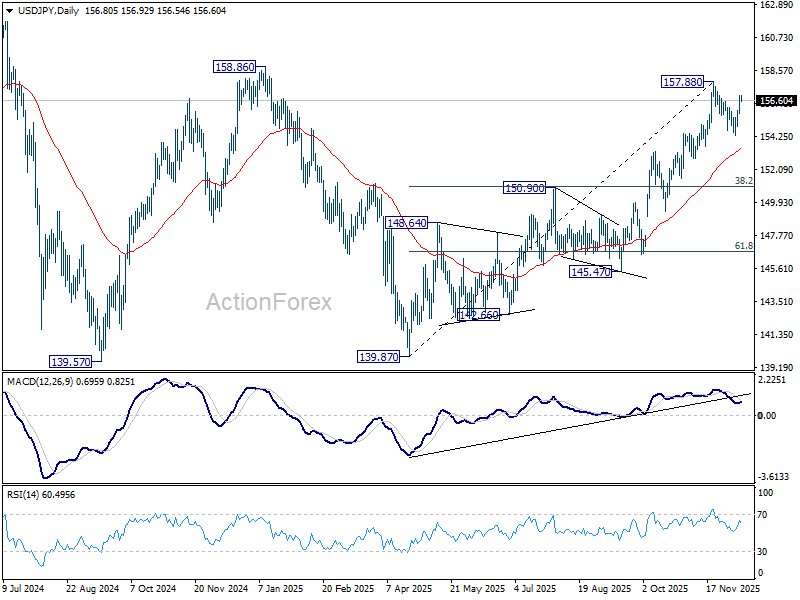
USD/JPY Daily Outlook
Daily Pivots: (S1) 156.11; (P) 156.53; (R1) 157.33; More...
USD/JPY's rise from 154.33 is in progress and intraday bias remains on the upside for 157.88 and above. Firm break of 158.85 structural resistance will be a strong bullish sign, and should target a retest on 161.94 high next. For now, risk will stays mildly on the upside as long as 154.33 support holds, in case of retreat.
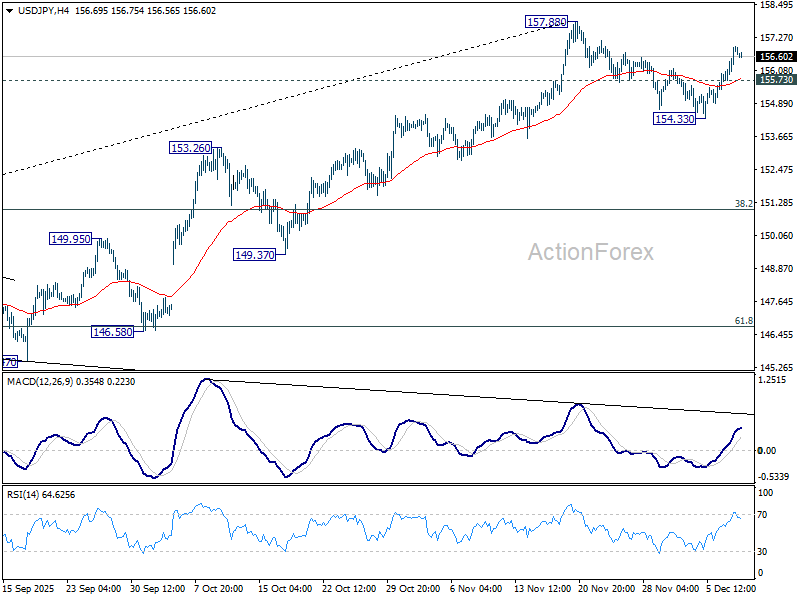
In the bigger picture, corrective pattern from 161.94 (2024 high) could have completed with three waves at 139.87. Larger up trend from 102.58 (2021 low) could be ready to resume through 161.94 high. Decisive break of 158.85 structural resistance will solidify this bullish case and target 161.94 for confirmation. On the downside, break of 150.90 resistance turned support will dampen this bullish view and extend the corrective range pattern with another falling leg.