Sample Category Title
GBP/USD Mid-Day Outlook
Daily Pivots: (S1) 1.3303; (P) 1.3325; (R1) 1.3344; More...
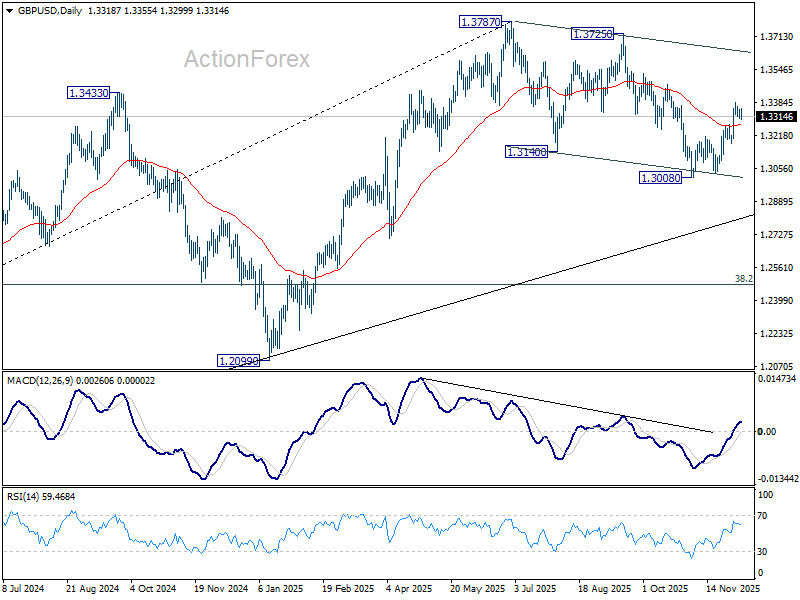
GBP/USD is extending consolidations below 1.3384 temporary top. Intraday bias remains neutral. With 1.3178 support intact, further rally is still expected. As noted before, fall from 1.3787 should have completed as a three-wave correction to 1.3008. On the upside, above 1.3384 will target 1.3470 resistance. Decisive break there will bring retest of 1.3787 high.
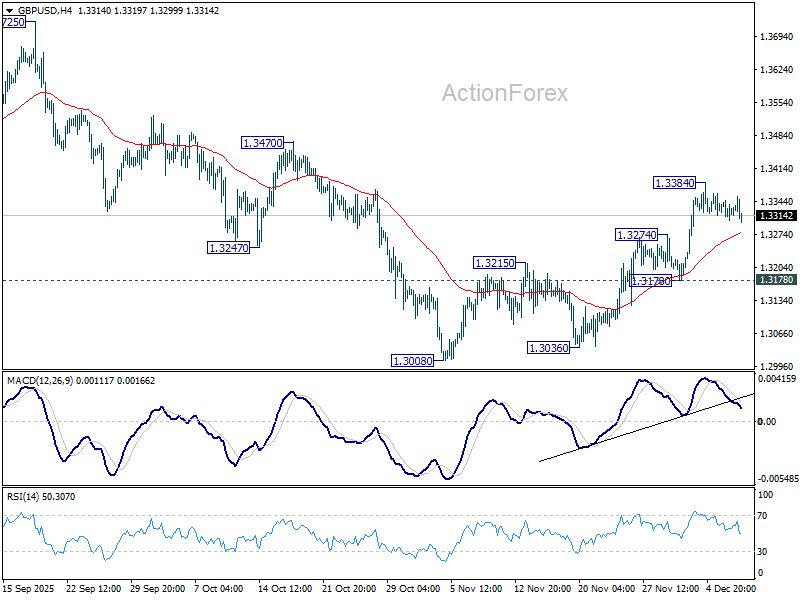
In the bigger picture, current development suggests that fall from 1.3787 is merely a corrective move, and larger rise from 1.0351 (2022 low) is still in progress. Firm break of 1.3787 will target 1.4248 (2021 high) key structural resistance. This will remain the favored case as long as target 38.2% retracement of 1.0351 to 1.3787 at 1.2474 holds, in case of another fall.
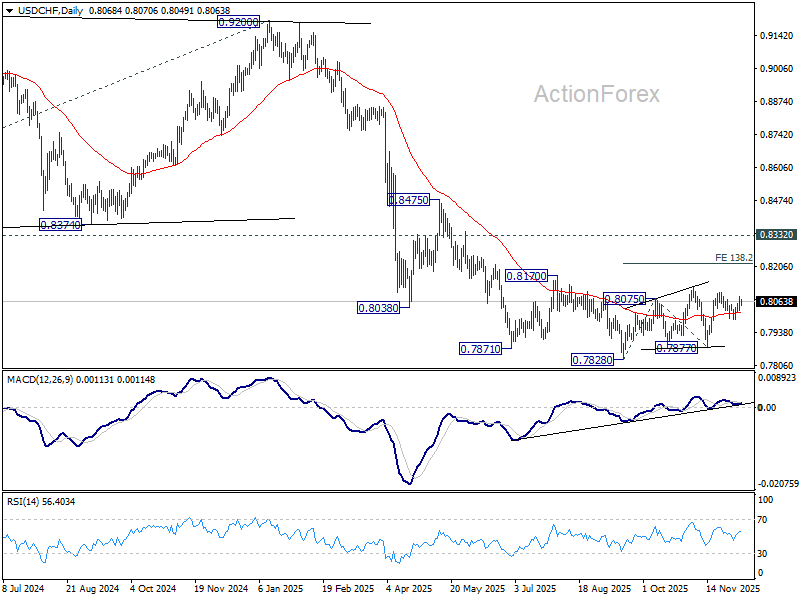
USD/CHF Mid-Day Outlook
Daily Pivots: (S1) 0.8035; (P) 0.8061; (R1) 0.8093; More…
Intraday bias in USD/CHF stays mildly on the upside for 0.8101 and then 0.8123 resistance. As noted before, price actions from 0.7828 are developing into a corrective pattern. Firm break of 0.8123 will target 138.2% projection of 0.7828 to 0.8075 from 0.7877 at 0.7812. For now, risk will stay on the upside as long as 0.7990 support holds, in case of retreat.
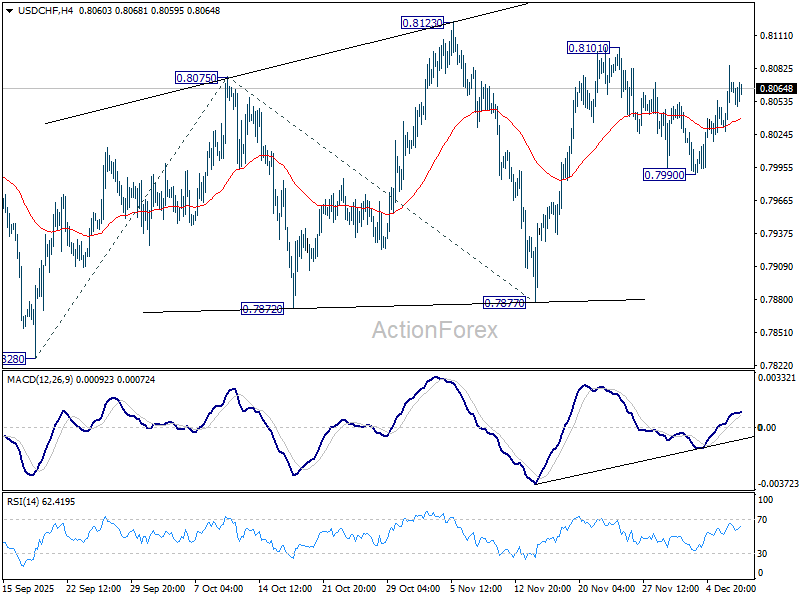
In the bigger picture, outlook will stay bearish as long as 0.8332 support turned resistance holds (2023 low). Long term down trend from 1.0342 (2017 high) is still in progress. Next target is 100% projection of 1.0146 (2022 high) to 0.8332 from 0.9200 at 0.7382.
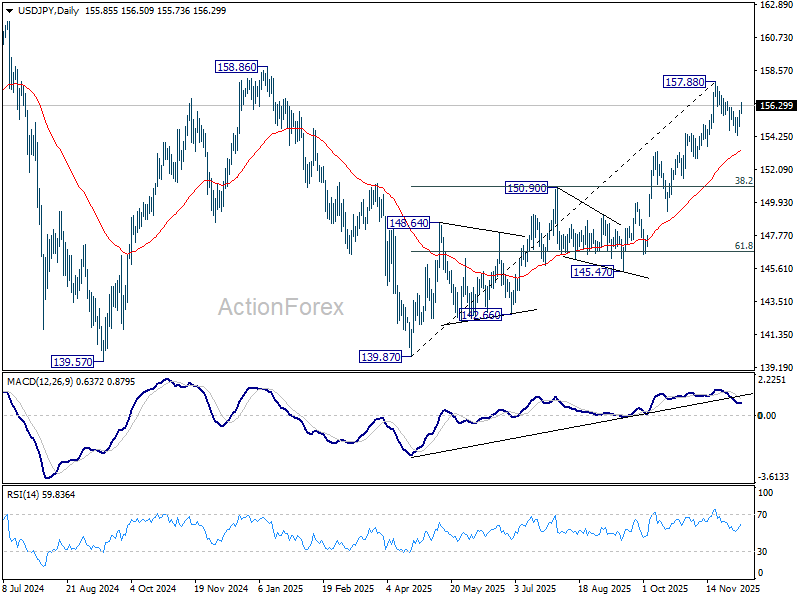
USD/JPY Mid-Day Outlook
Daily Pivots: (S1) 155.22; (P) 155.61; (R1) 156.31; More...
Intraday bias in USD/JPY stays mildly on the upside at this point. Corrective pullback from 157.88 could have completed at 154.33 already. Further rise should be seen to 157.88 and above. Firm break of 158.85 structural resistance will be a strong bullish sign, and should target a retest on 161.94 high next. For now, risk will stays mildly on the upside as long as 154.33 support holds, in case of retreat.
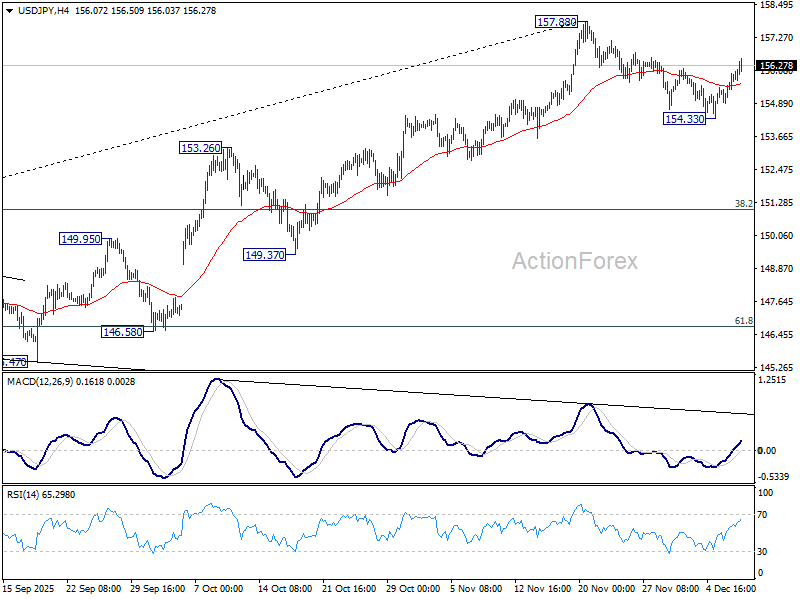
In the bigger picture, corrective pattern from 161.94 (2024 high) could have completed with three waves at 139.87. Larger up trend from 102.58 (2021 low) could be ready to resume through 161.94 high. Decisive break of 158.85 structural resistance will solidify this bullish case and target 161.94 for confirmation. On the downside, break of 150.90 resistance turned support will dampen this bullish view and extend the corrective range pattern with another falling leg.
Trump Remarks, Ueda Interview Add Color as Traders Await Fed
Currency market dynamics have not shifted meaningfully as the session progresses, with the day’s relative performance table largely intact. Aussie remains firmly at the top, supported by the RBA’s hawkish hold earlier today. Governor Michele Bullock effectively shut the door on further easing and made clear that the next move could be a hike if some of recent inflation drivers prove more persistent than expected. Kiwi continues to follow as the second-strongest currency, underpinned by spillover from Aussie's strength while Loonie ranks third.
At the other end of the spectrum, Yen is still the weakest performer, facing renewed selling pressure even after comments from BoJ Governor Kazuo Ueda. Euro sits as the second-softest, while Dollar is the third weakest amid positioning ahead of tomorrow’s FOMC outcome. Sterling and Swiss Franc are holding in the middle of the pack.
The configuration reflects a mild risk-on undertone, though this is not yet translating into directional trades. With FOMC event risk looming, markets appear reluctant to commit. Speculation of a “hawkish cut” has grown, with some investors preparing for the possibility that the Fed signals a lengthy pause after tomorrow’s widely expected 25bps reduction.
One noteworthy development comes from U.S. trade policy. In a Politico interview, President Donald Trump suggested he could make further adjustments to tariffs to ease consumer prices, saying he had already done so in certain categories. “Prices are all coming down,” he said. “Everything is coming down.”
Meanwhile, Ueda told the Financial Times that Japan’s economy has weathered the impact of U.S. tariffs better than many expected. He noted that the “real side of the economy is doing OK,” with underlying inflation “continuing to rise” toward the BoJ’s 2% target.
So far, Ueda said, U.S. corporates have absorbed much of the tariff burden instead of passing costs aggressively to consumers. At the same time, Japanese car exporters have cut prices to absorb their share of tariff costs, helping stabilize auto export volumes and preventing job losses.
In Europe, at the time of writing, FTSE is down -0.09%. DAX is up 0.32%, CAC is down -0.54%. UK 10-year yield is down -0.011 at 4.517. Germany 10-year yield is down -0.006 at 2.856. Earlier in Asia, Nikkei rose 0.14%. Hong Kong HSI fell -1.29%. China Shanghai SSE fell -0.37%. Singapore Strait Times rose 0.14%. Japan 10-year JGB yield fell -0.008 to 1.965.
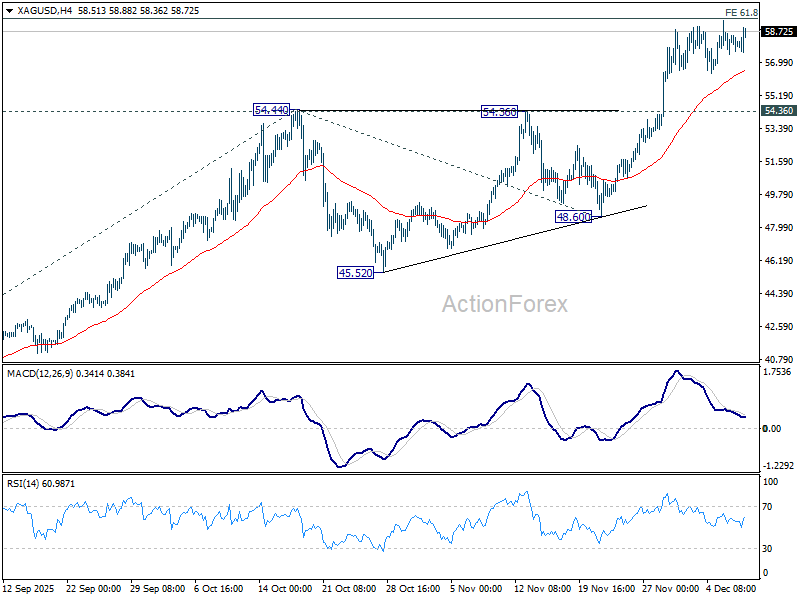
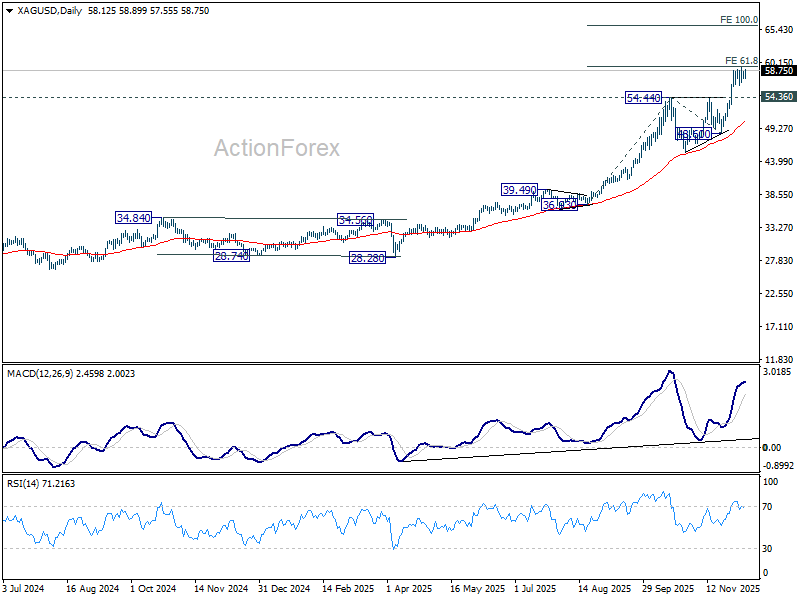
Silver eyes clean break above 60 as shallow pullback indicates underlying strength
Silver’s advance paused below the key projection near 60 psychological level, yet the pullback since has been modest, signaling no damage to the broader uptrend. The metal’s consolidation appears tied to caution ahead of the FOMC decision, with traders weighing talk of a “hawkish cut” and the possibility that the Fed may signal a longer pause after tomorrow’s move. Once the policy risk is cleared, Silver is expected to resume its uptrend.
Fundamentally, the backdrop remains supportive. ETF demand continues to surge, with total holdings rising by close to 590 metric tonnes last week. Inflows have increased in nine of the last eleven months, reflecting a sustained shift toward precious-metal exposure amid global uncertainty. November’s inflow of 15.7 million ounces—the strongest since July—further highlights steady investor engagement.
This pattern of strong ETF accumulation is expected to persist in the coming months. Safe-haven interest is being reinforced by geopolitical risks, while industrial consumption and supply-side tightness continue to bolster the structural case for higher prices.
Technically, outlook remains firmly bullish while 54.36 resistance turned support stays intact. The shallow nature of the recent retreat suggests consolidation rather than exhaustion, and price action remains well-positioned for a clean break above the 60 psychological level on next move. Decisive break of 61.8% projection of 36.93 to 54.44 from 48.60 at 59.42 could prompt upside acceleration got 100% projection at 100% projection at 66.11.
RBA holds at 3.60% as Bullock signals no cuts, open to 2026 hike
RBA kept the cash rate unchanged at 3.60% today, as markets had fully priced. But the tone from Governor Michele Bullock was firmer than expected, pushing back against speculation of early-2026 easing. “Given what’s happening with underlying momentum in the economy … it does look like additional cuts are not needed,” she said, adding that she does not see rate cuts “on the horizon for the foreseeable future.”
While Bullock confirmed the board did not discuss a rate hike as an active policy option today, she stressed members spent “quite a lot” of time examining what conditions might force them to lift rates next year. The discussion centered on the persistence of inflation and how much further the economy needs to cool before the board can be confident price pressures are returning to target.
Asked whether a February rate increase is plausible, Bullock did not rule it out. She said the RBA will monitor whether inflation remains sticky: if inflation fails to move back toward target, “then I think that does raise questions about how tight financial conditions are and the board might have to consider whether or not it’s appropriate to keep interest rates where they are or in fact at some point raise them.” Any decision, she added, will be made “meeting by meeting.”
The accompanying statement echoed this mildly hawkish stance, noting that recent data show inflation risks have “tilted to the upside.” Although the board judges part of the recent lift in underlying inflation as driven by temporary factors, policymakers admit uncertainty about the new monthly CPI series and acknowledge signs of a “more broadly based pick-up” in price pressures that may prove persistent.
Labor market indicators continue to suggest conditions remain “a little tight.” While the Wage Price Index has eased from its peak, broader wage measures are still running strong, and unit labor costs remain high.
For now, the RBA is signaling a steady policy stance, but the barrier to easing has grown significantly while the door to a potential hike in 2026 is now visibly open.
USD/JPY Mid-Day Outlook
Daily Pivots: (S1) 155.22; (P) 155.61; (R1) 156.31; More...
Intraday bias in USD/JPY stays mildly on the upside at this point. Corrective pullback from 157.88 could have completed at 154.33 already. Further rise should be seen to 157.88 and above. Firm break of 158.85 structural resistance will be a strong bullish sign, and should target a retest on 161.94 high next. For now, risk will stays mildly on the upside as long as 154.33 support holds, in case of retreat.
In the bigger picture, corrective pattern from 161.94 (2024 high) could have completed with three waves at 139.87. Larger up trend from 102.58 (2021 low) could be ready to resume through 161.94 high. Decisive break of 158.85 structural resistance will solidify this bullish case and target 161.94 for confirmation. On the downside, break of 150.90 resistance turned support will dampen this bullish view and extend the corrective range pattern with another falling leg.
Silver eyes clean break above 60 as shallow pullback indicates underlying strength
Silver’s advance paused below the key projection near 60 psychological level, yet the pullback since has been modest, signaling no damage to the broader uptrend. The metal’s consolidation appears tied to caution ahead of the FOMC decision, with traders weighing talk of a “hawkish cut” and the possibility that the Fed may signal a longer pause after tomorrow’s move. Once the policy risk is cleared, Silver is expected to resume its uptrend.
Fundamentally, the backdrop remains supportive. ETF demand continues to surge, with total holdings rising by close to 590 metric tonnes last week. Inflows have increased in nine of the last eleven months, reflecting a sustained shift toward precious-metal exposure amid global uncertainty. November’s inflow of 15.7 million ounces—the strongest since July—further highlights steady investor engagement.
This pattern of strong ETF accumulation is expected to persist in the coming months. Safe-haven interest is being reinforced by geopolitical risks, while industrial consumption and supply-side tightness continue to bolster the structural case for higher prices.
Technically, outlook remains firmly bullish while 54.36 resistance turned support stays intact. The shallow nature of the recent retreat suggests consolidation rather than exhaustion, and price action remains well-positioned for a clean break above the 60 psychological level on next move. Decisive break of 61.8% projection of 36.93 to 54.44 from 48.60 at 59.42 could prompt upside acceleration got 100% projection at 100% projection at 66.11.
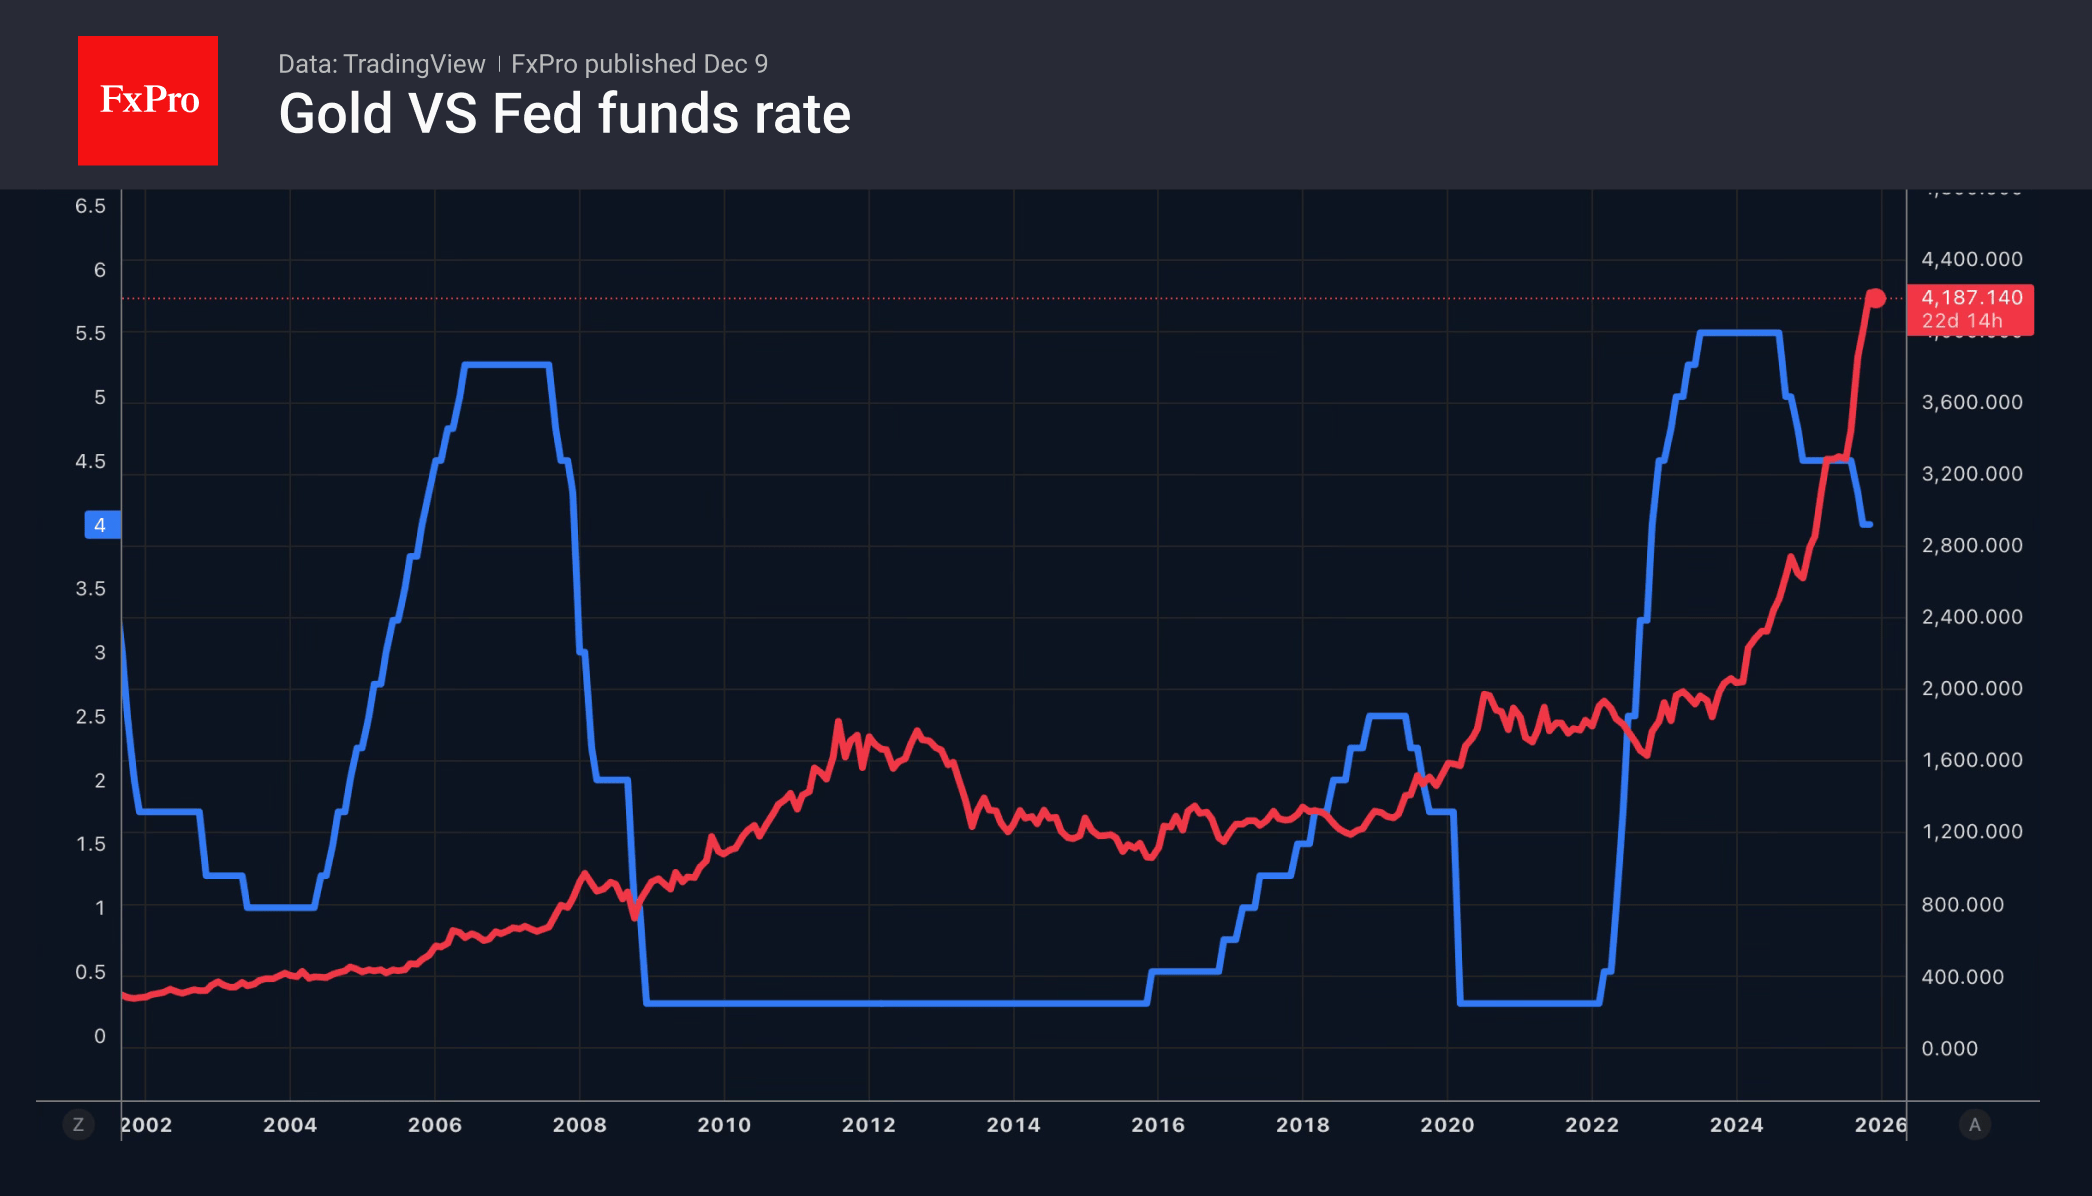
Gold Spooked by Fed’s Hawkish Stance
Gold has retreated from local highs amid concerns about the Fed’s hawkish stance on further rate moves. The futures market does not doubt that policy will be eased following the FOMC meeting on 9–10 December. However, to find a compromise within the Committee, Jerome Powell will most likely opt for hawkish rhetoric during the press conference. Precious metals risk losing their key advantage as the dollar strengthens.
Bears are counting on gold prices falling below $4,000 as the cycle of monetary policy easing begins to lose momentum. Derivatives are expecting two rate cuts in 2026, although a week ago, they were expecting three. According to the Bank for International Settlements, the Fed’s policy easing was the primary contributor to the 60% increase in gold prices in 2025.
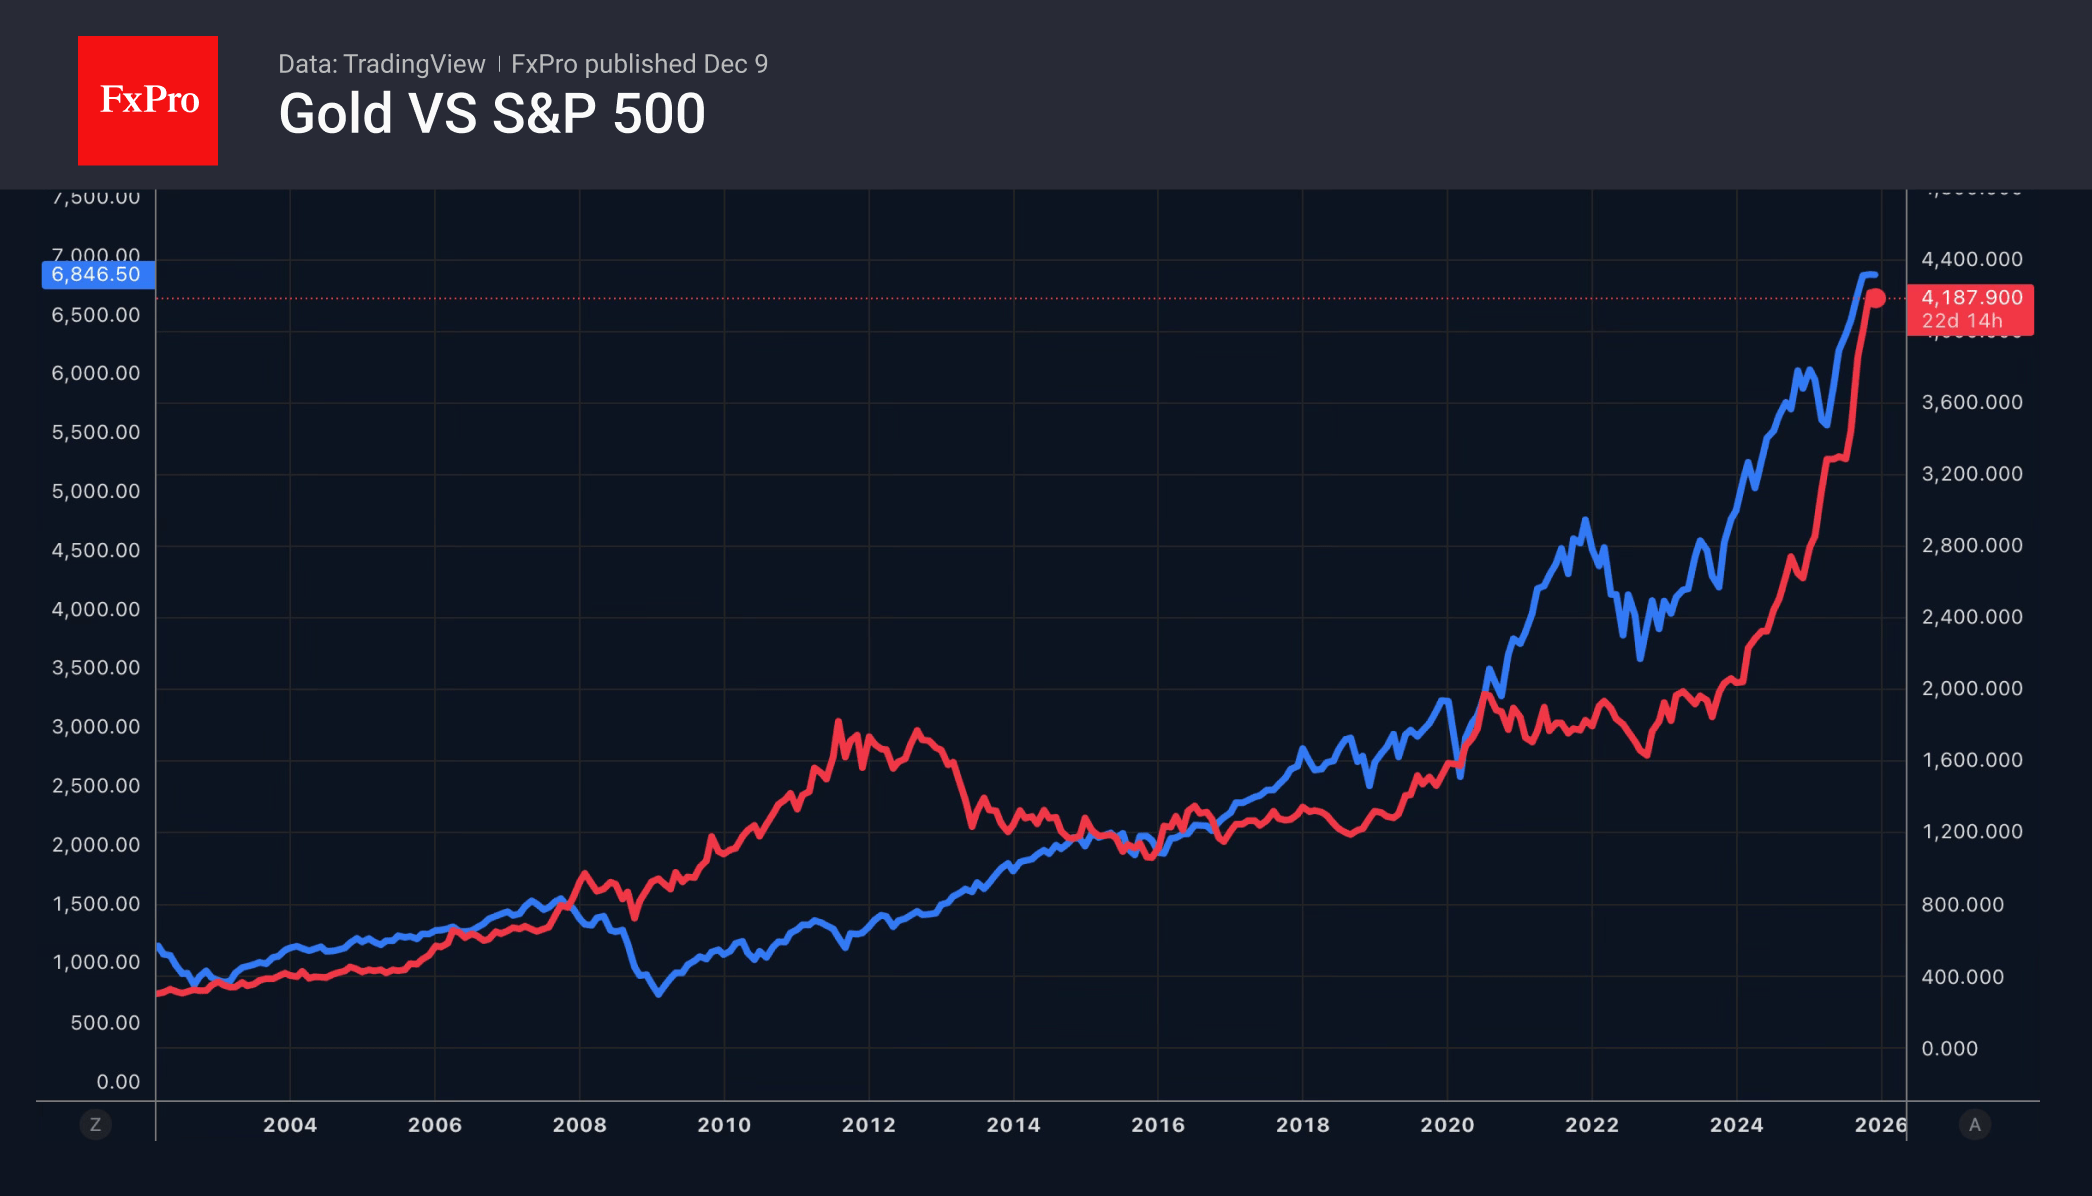
It was initiated by institutional investors who purchased the precious metal as a safe haven, following the US’s imposition of the most extensive tariffs since the 1930s on Independence Day. However, the growing momentum then attracted the interest of retail investors, who drove the rally. This resulted in a direct correlation with stock indices. As a result, the BIS concludes that gold has become more closely associated with a risk asset class.
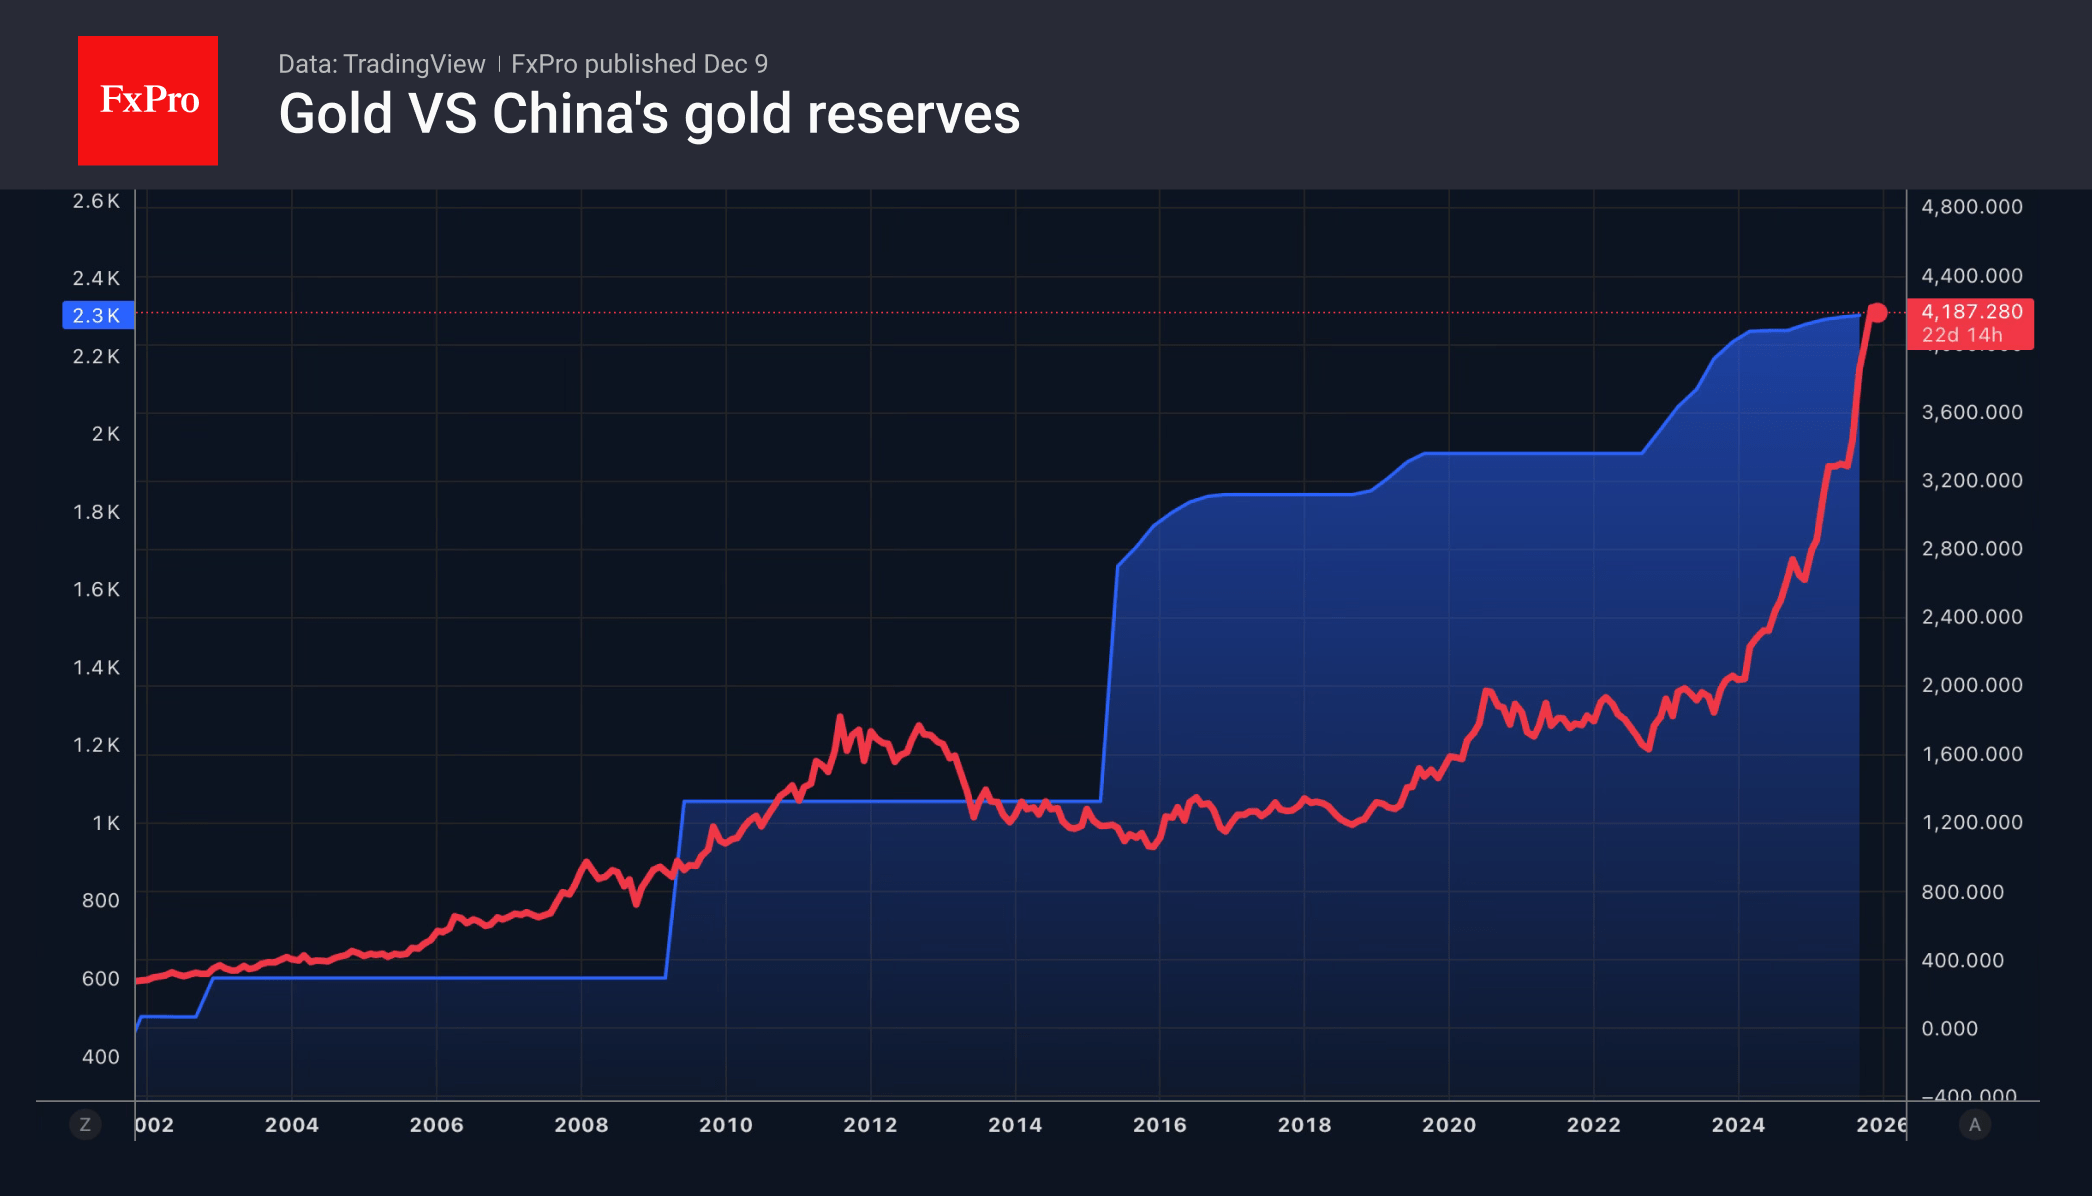
Gold is supported by high demand from ETF enthusiasts, primarily in China and India. According to the World Gold Council, the reserves of specialised exchange-traded funds focused on precious metals reached 3,932 tonnes at the end of November, adding every month except May and increasing reserves by more than 700 tonnes in total in 2025. This is a record in both value and physical terms.
The People’s Bank of China continues to build up its precious metal reserves for the 13th consecutive month. In November, they increased by 30,000 ounces to 74.12 million ounces. The cycle of uninterrupted bullion purchases began in November 2024 and is part of the diversification of gold and foreign exchange reserves, as well as de-dollarisation. However, peace talks in Ukraine could slow down or reverse these processes, putting pressure on the gold market.
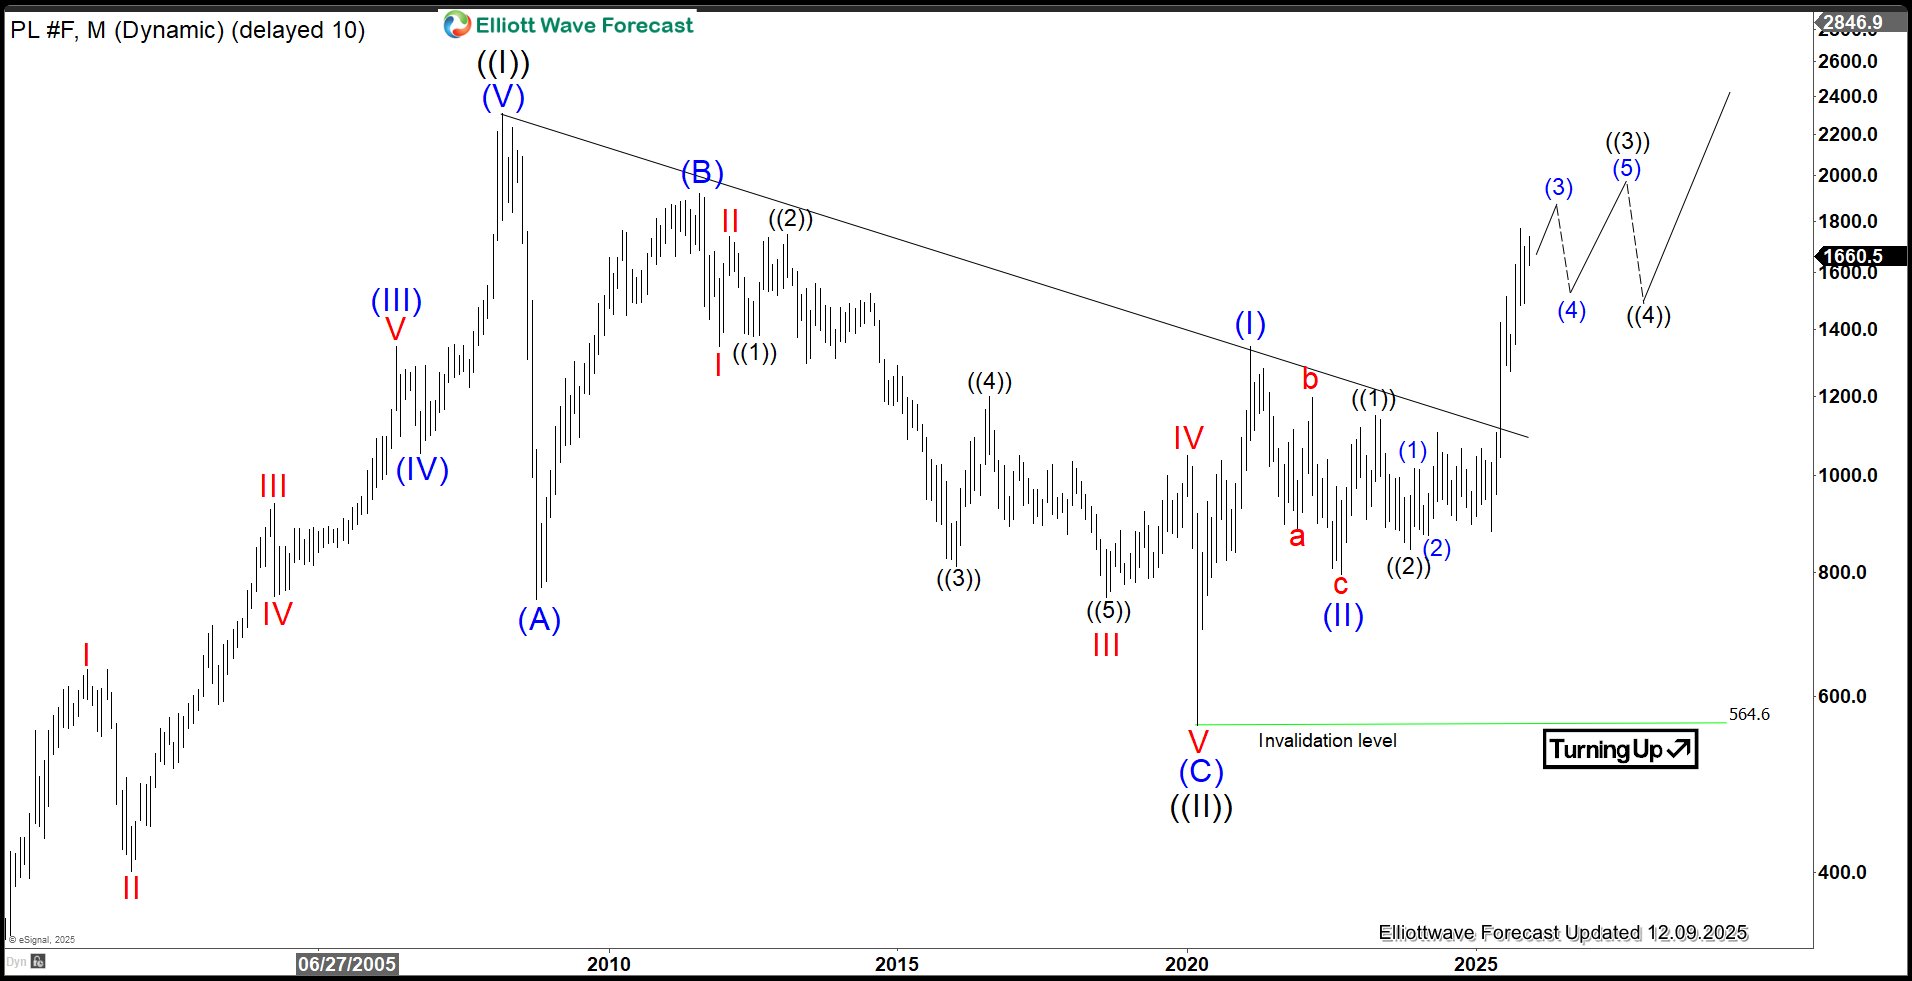
Strong Nesting Impulse Drives Platinum (PL) Higher
Platinum (PL) has developed a strong five‑wave nesting impulse from the March 2020 low, reinforcing the view that the right side of the market remains higher. In this article, we present the latest long‑term Elliott Wave outlook.
Platinum (PL) Monthly Elliott Wave Chart
The monthly Platinum chart highlights a strong nesting impulse that began after the March 2020 low at 564.6. We have identified this low as wave ((II)) of the Grand Super Cycle. From that point, the metal resumed its advance in wave ((III)). Within this structure, wave (I) of ((III)) completed at 1348.2, followed by a corrective pullback in wave (II) that ended at 796.8. Platinum then began nesting higher within wave (III), which is expected to unfold through a sequence of fourth and fifth waves before completion. As long as price remains above 564.6, the broader outlook continues to favor further upside.
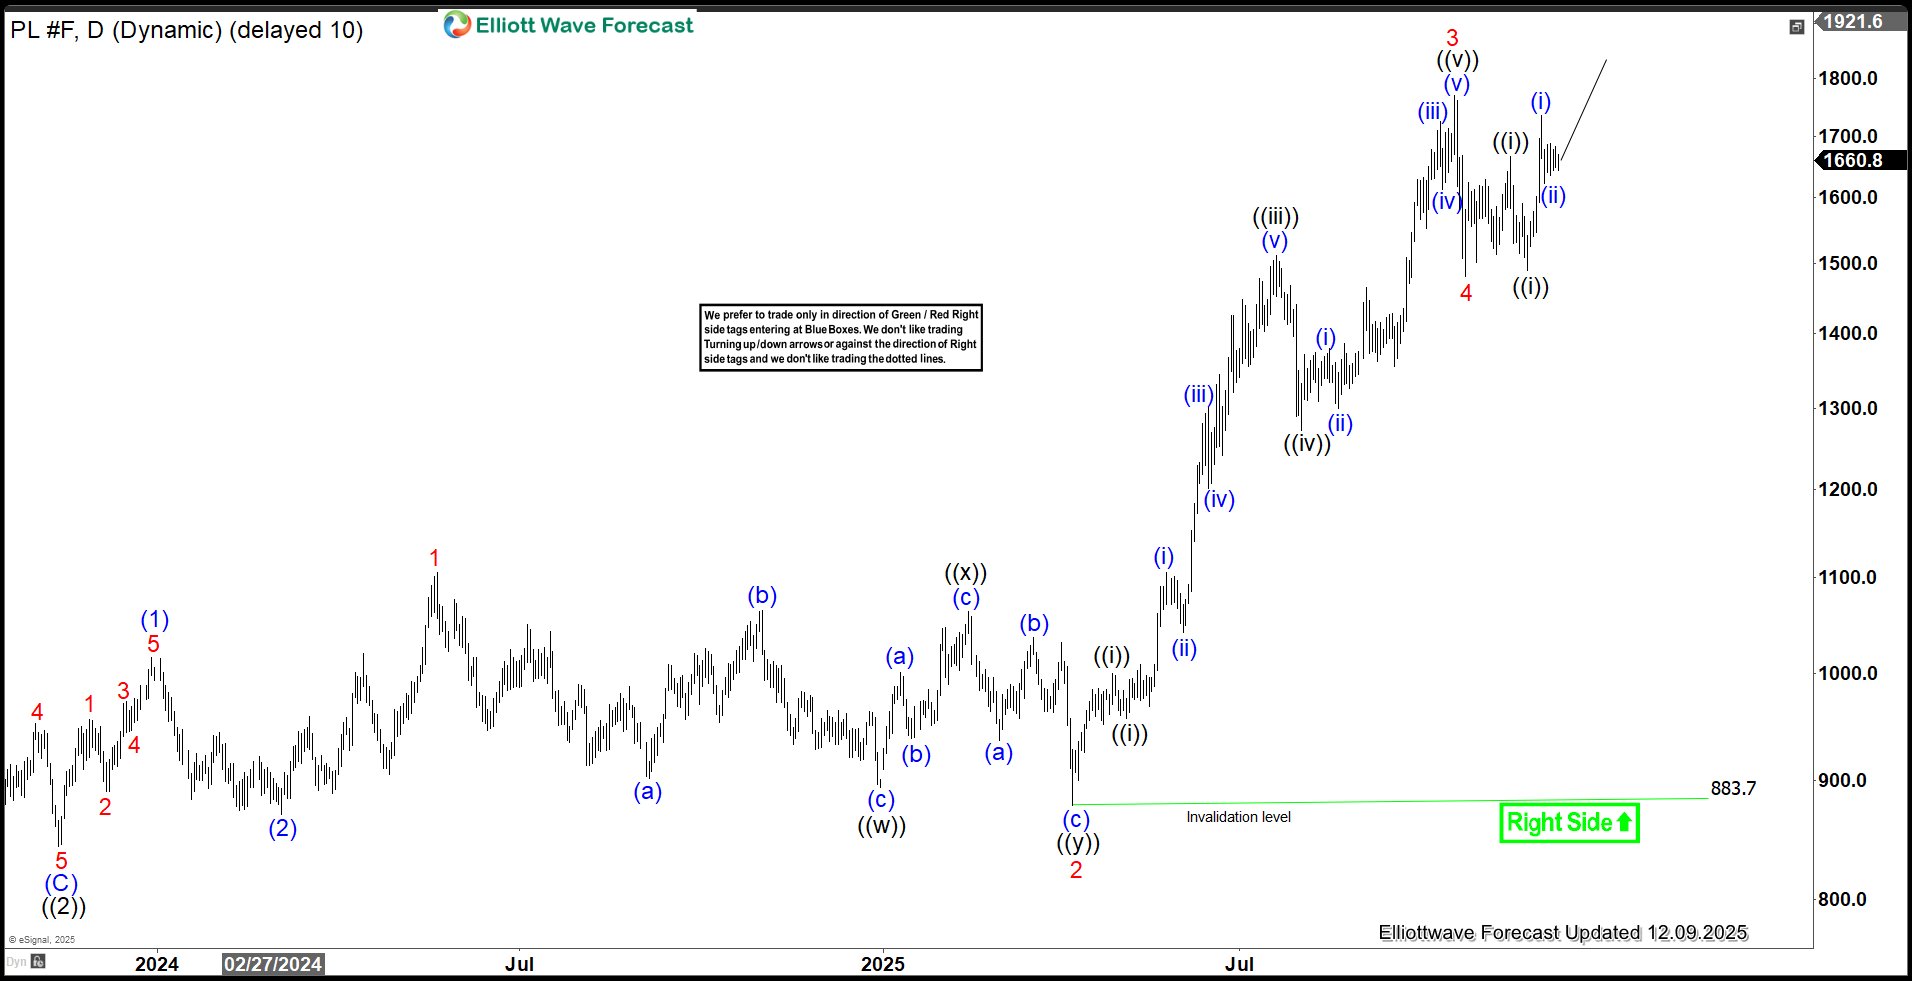
Platinum (PL) Daily Elliott Wave Chart
The daily Platinum chart indicates that the wave ((2)) pullback concluded at 843.1. From this low, the metal began nesting higher. Wave (1) completed at 1105 and the subsequent wave (2) pullback ended at 883.7. The advance continued with wave (3) reaching 1770. A corrective wave (4) followed which settled at 1481.2. In the near term, as long as price action holds above 883.7, any pullback should find support within a 3, 7, or 11-swing sequence, setting the stage for further upside.
USD/CAD Recovers From a 2.5-Month Low
The main driver of the decline was a sharp shift in sentiment and diverging expectations for policy actions in the United States and Canada.
→ Canada: Friday’s employment data came in far stronger than forecast. As a result, traders sharply reduced the likelihood of a Bank of Canada rate cut at the next meeting, judging the economy resilient enough to pause its easing cycle.
→ United States: Markets are pricing in a high probability of a Federal Reserve rate cut at tomorrow’s meeting (22:00 GMT+3).
This contrast pushed USD/CAD to a 2.5-month low. However, the chart shows that the bulls may still have some grounds for optimism.
USD/CAD Technical Analysis
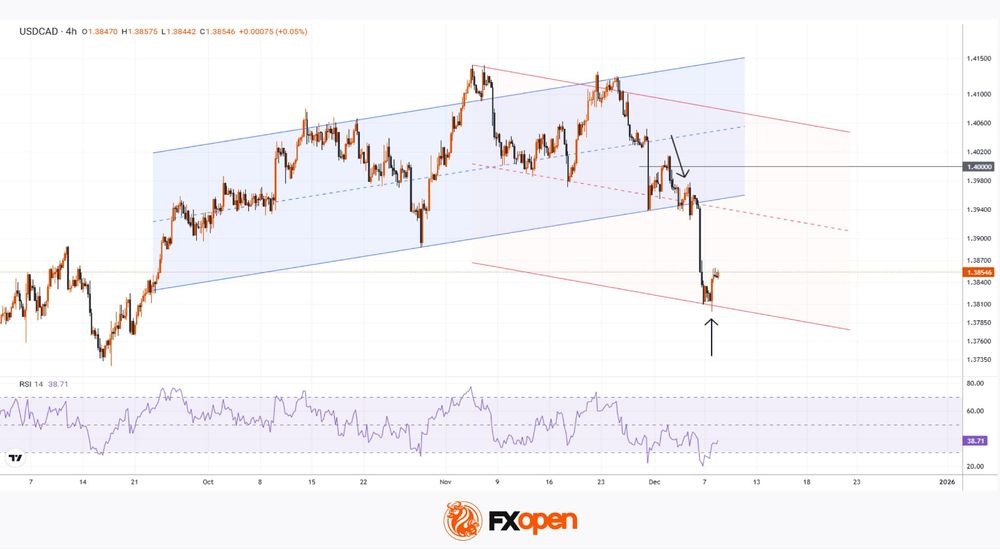
On 1 December we analysed the USD/CAD chart and:
→ drew an ascending channel (shown in blue) and noted several bearish signals;
→ suggested that the 1.4000 level would act as resistance in the near term, with bears likely to attempt to resume the downward move in USD/CAD.
Indeed, as the arrow indicates, the bears managed to restart the downtrend, which led to:
→ a breakout below the lower boundary of the channel;
→ the need to map out a descending trajectory (shown in red), with its median potentially acting as resistance going forward.
In this context, it is reasonable to assume that the bulls have some cause for hope in the short term, as:
→ the price is rebounding from the lower boundary of the red channel, indicating demand;
→ the RSI has risen from extreme oversold levels;
→ the candle highlighted by the second arrow looks bullish – it closed near the top of its range, forming a long lower shadow.
Given the above, traders should not rule out a corrective recovery in USD/CAD until the Federal Reserve releases its decision, which could significantly impact financial markets.
Trade over 50 forex markets 24 hours a day with FXOpen. Take advantage of low commissions, deep liquidity, and spreads from 0.0 pips. Open your FXOpen account now or learn more about trading forex with FXOpen.
This article represents the opinion of the Companies operating under the FXOpen brand only. It is not to be construed as an offer, solicitation, or recommendation with respect to products and services provided by the Companies operating under the FXOpen brand, nor is it to be considered financial advice.
Crypto Market Awaits Final Battle of the Year
Market Overview
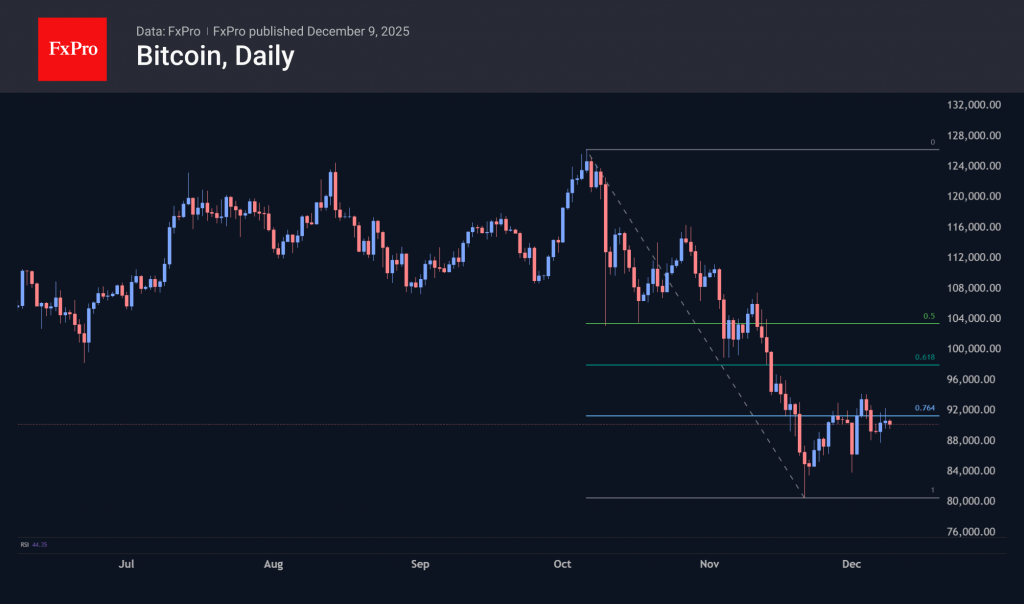
The crypto market lost just over 1% in 24 hours to $3.08T, falling back to the consolidation levels of late November. Attempts to shake up the market at the beginning of this month were unsuccessful for both bulls and bears. Excluding this impulse, the market has been treading water for almost two weeks, hovering around the 23.6% correction rebound line from the October-November decline. Such a shallow rebound could be a sign of a strong bear market, but this will only be confirmed if November’s lows of $2.73T are updated.
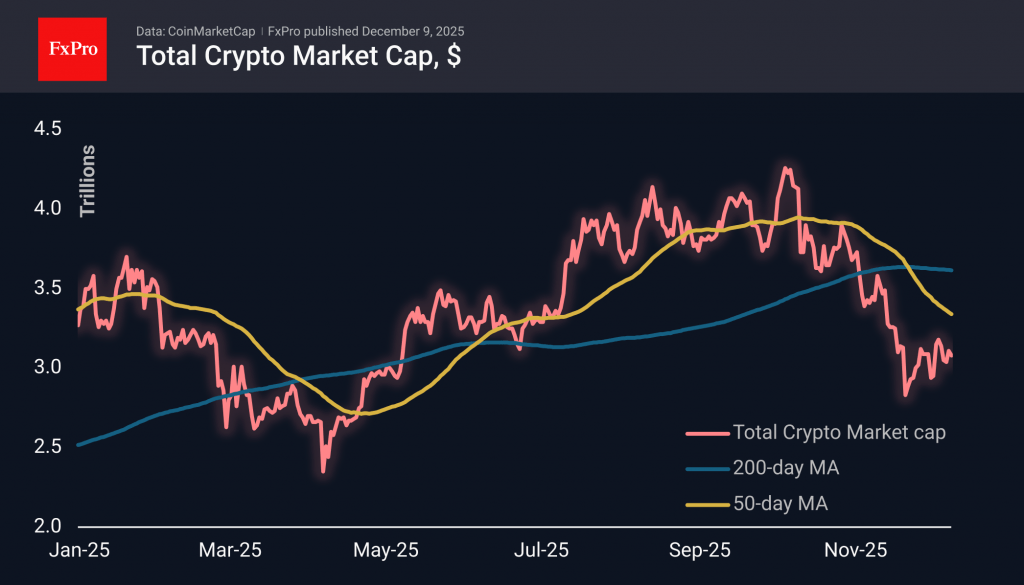
Bitcoin is trading near $90K, having crossed this level for the fifth consecutive day. An upward trend line can be drawn through the lows of late November, but BTC is now trading dangerously close to this line. At the same time, horizontal resistance has formed in the $92K area, bringing the positions of bulls and bears closer together over time and promising a decisive battle by the end of this week. It could not only be the last significant battle of the year but also determine the trend for the coming months.
News Background
Short positions on Bitcoin have recorded their largest outflow since March 2025, when the price of BTC was near its lows. Investors likely believe that the current surge in negative sentiment has bottomed out, according to CoinShares.
According to Glassnode, the reserves of long-term Bitcoin holders fell to a cyclical low in November. This marks the end of the spot sell-offs that have hindered market growth throughout 2025.
Ethereum exchange reserves have fallen to record lows, which could signal an imminent supply crisis, according to CryptoQuant. Since July 2025, the indicator has fallen by about 20%.
The largest American investment company, BlackRock, has applied with the SEC to register an ETF that will allow investors to earn income from staking Ethereum without directly owning the cryptocurrency.
Strategy has increased its weekly Bitcoin purchases to their highest level since July. The company bought 10,624 BTC ($963 million) last week at an average price of $90,615 per coin. Strategy now owns 660,624 BTC, purchased for $49.3 billion at an average price of $74,696 per Bitcoin.
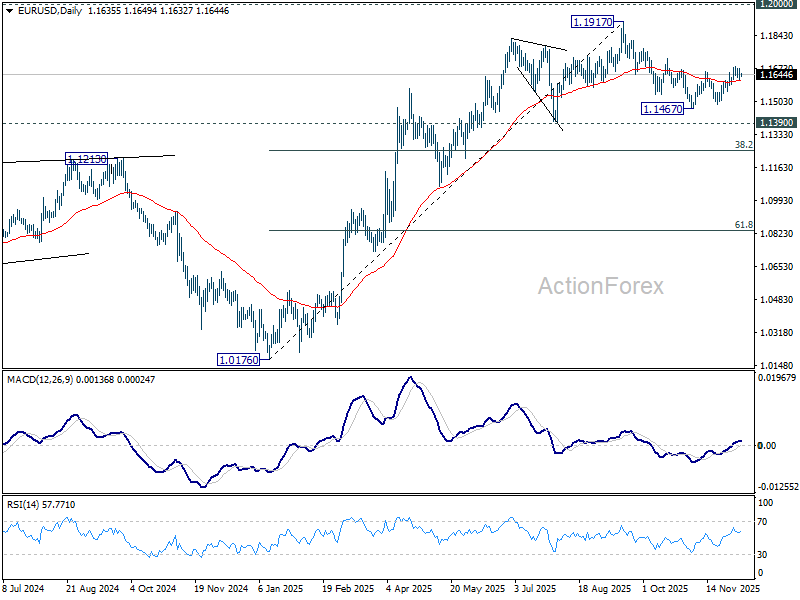
EUR/USD Daily Outlook
Daily Pivots: (S1) 1.1613; (P) 1.1643; (R1) 1.1668; More….
Intraday bias in EUR/USD remains neutral for consolidations below 1.1681 temporary top. Further rally is in favor with 1.1590 minor support intact. Corrective fall from 1.1917 could have completed at 1.1467. Above 1.1681 will target 1.1727 resistance first. Firm break there will solidify this case and bring retest of 1.1917 high. However, break of 1.1590 will revive near term bearishness, and bring retest of 1.1467 low.
In the bigger picture, as long as 55 W EMA (now at 1.1346) holds, up trend from 0.9534 (2022 low) is still in favor to continue. Decisive break of 1.2 key psychological level will carry larger bullish implication. However, sustained trading below 55 W EMA will argue that rise from 0.9534 has completed as a three wave corrective bounce, and keep long term outlook bearish.