
Sample Category Title
EUR/JPY Daily Outlook
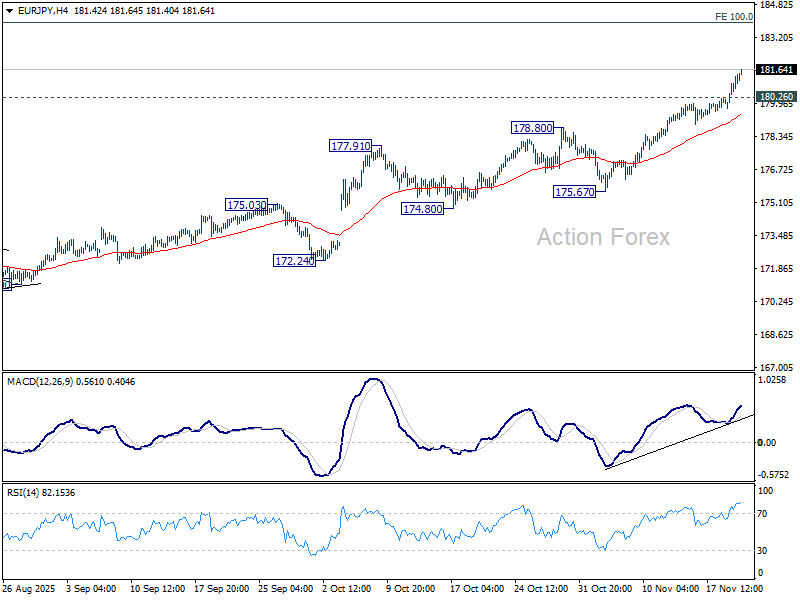
Daily Pivots: (S1) 180.29; (P) 180.82; (R1) 181.87; More...
Intraday bias in EUR/JPY remains on the upside for the moment. Current up trend should target 100% projection of 161.06 to 173.87 from 171.09 at 183.90. Firm break there will target 186.31 projection level next. On the downside, below 180.26 minor support will turn bias neutral and bring consolidations first, before staging another rise.
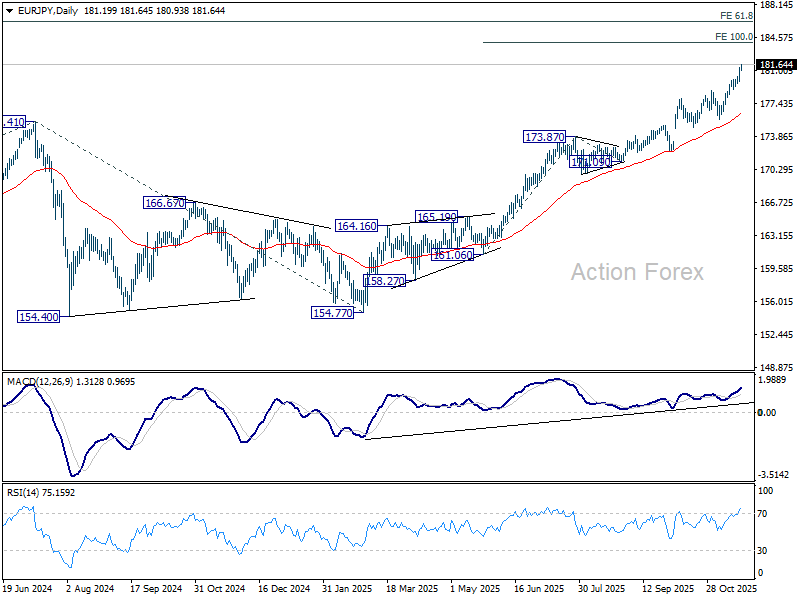
In the bigger picture, up trend from 114.42 (2020 low) is in progress and should target 61.8% projection of 124.37 to 175.41 from 154.77 at 186.31. Outlook will continue to stay bullish as long as 55 W EMA (now at 169.00) holds, even in case of deep pullback.
EUR/GBP Daily Outlook
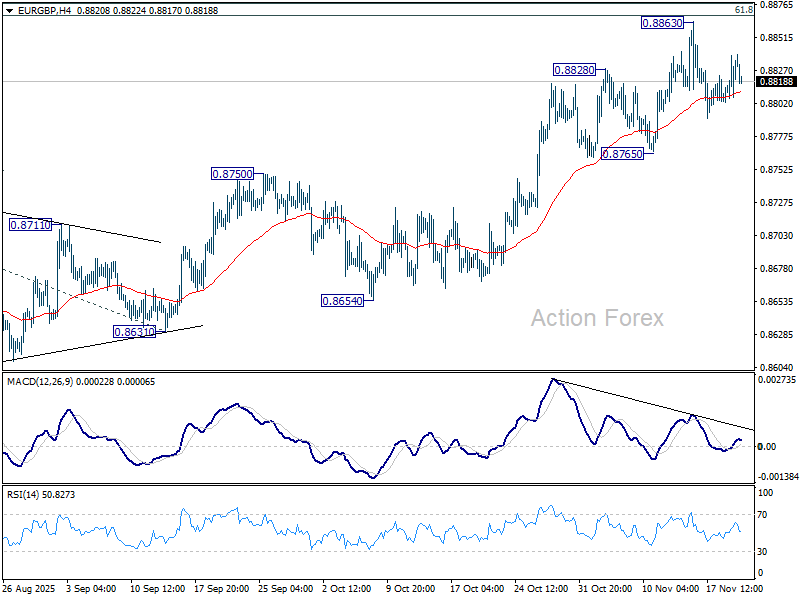
Daily Pivots: (S1) 0.8812; (P) 0.8826; (R1) 0.8849; More…
Range trading continues below 0.8863 and intraday bias stays neutral in EUR/GBP. Considering bearish divergence condition in 4H MACD, firm break of 0.8765 support will confirm short term topping. Deeper fall should then be seen back to 55 D EMA (now at 0.8737) even still as a correction. On the upside, however, sustained trading above 0.8867 fibonacci level will carry larger bullish implications. Next near term target will be 100% projection of 0.8354 to 0.8752 from 0.8631 at 0.9029.
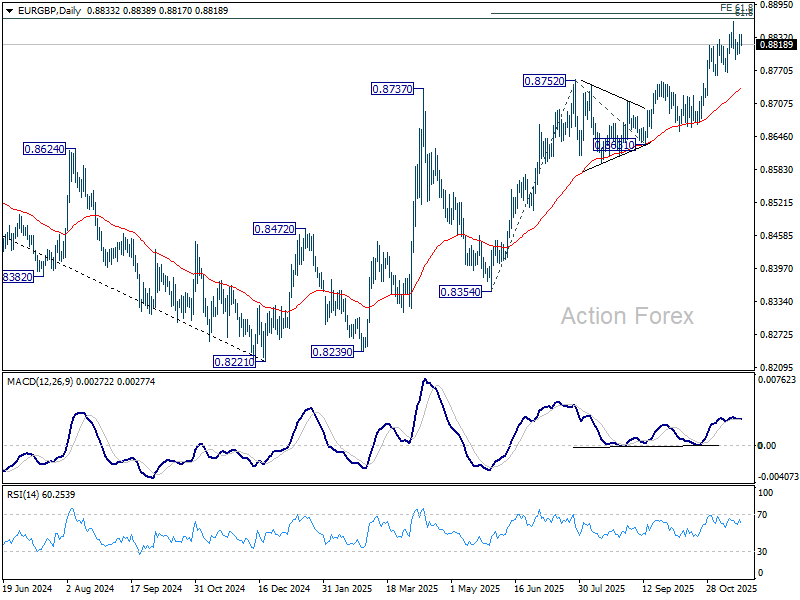
In the bigger picture, rise from 0.8221 medium term bottom is still seen as a corrective move. Upside should be limited by 61.8% retracement of 0.9267 to 0.8221 at 0.8867. Sustained trading below 55 W EMA (now at 0.8589) should confirm that this corrective bounce has completed. However, decisive break of 0.8867 will suggest that EUR/GBP is already reversing whole decline from 0.9267 (2022 high). That should pave the way back to 0.9267.
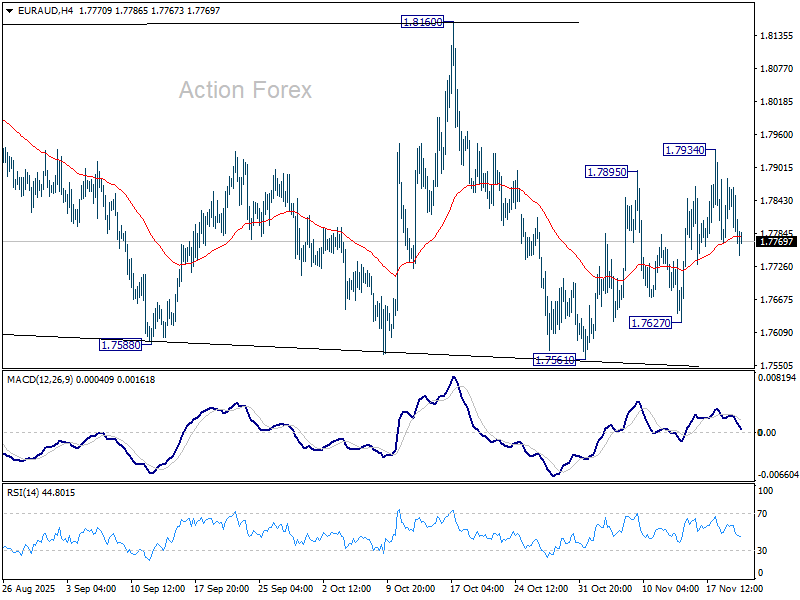
EUR/AUD Daily Outlook
Daily Pivots: (S1) 1.7763; (P) 1.7824; (R1) 1.7865; More...
Intraday bias in EUR/AUD is turned neutral again with current retreat. On the upside, above 1.7934 will bring stronger rally towards 1.8160 resistance. On the downside, break of 1.7627 will turn bias back to the downside for 1.7561 support instead. Overall, EUR/AUD is extending a medium term corrective pattern and the next move will depend on the breakout from 1.7561/8160 range.
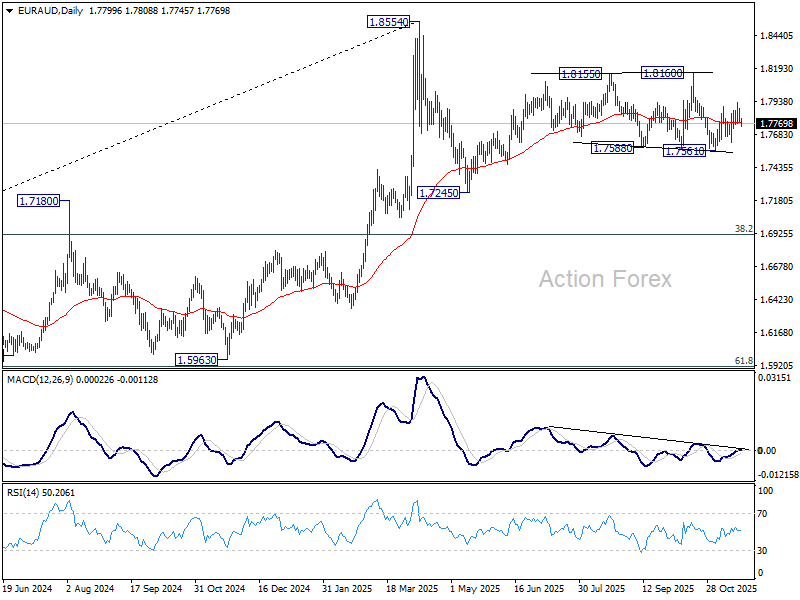
In the bigger picture, price actions from 1.8554 medium term top are seen as a corrective pattern. Sustained break of 55 W EMA (now at 1.7426) will suggest that it's correcting the whole rally from 1.4281 (2022 low). In this case, deeper decline would be seen to 38.2% retracement of 1.4281 to 1.8554 at 1.6922. Nevertheless, strong rebound from 55 W EMA will likely bring resumption of the up trend sooner.
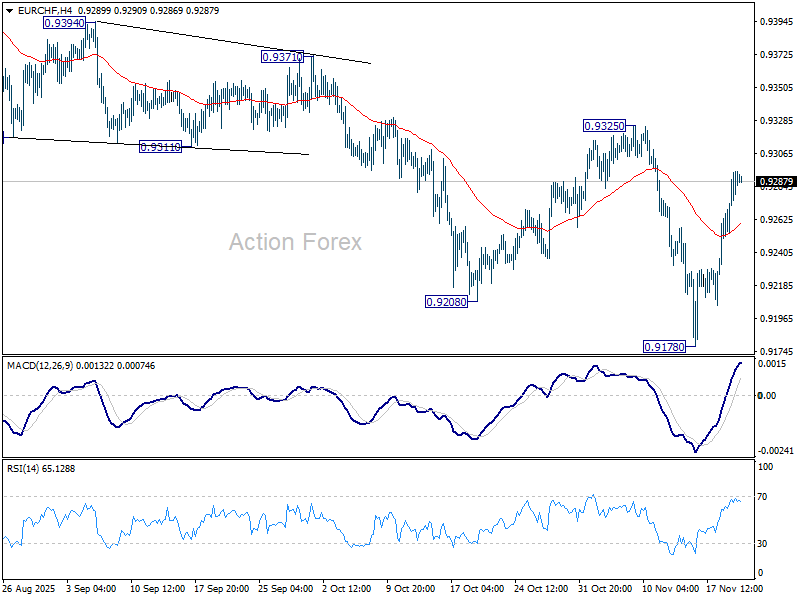
EUR/CHF Daily Outlook
Daily Pivots: (S1) 0.9267; (P) 0.9281; (R1) 0.9310; More....
Intraday bias in EUR/CHF remains neutral first and more sideway trading could be seen. Still, outlook will remain bearish as long as 0.9325 resistance holds. Firm break of 0.9178 will resume larger down trend. However, break of 0.9325 will bring stronger rally back towards 0.9452 resistance.
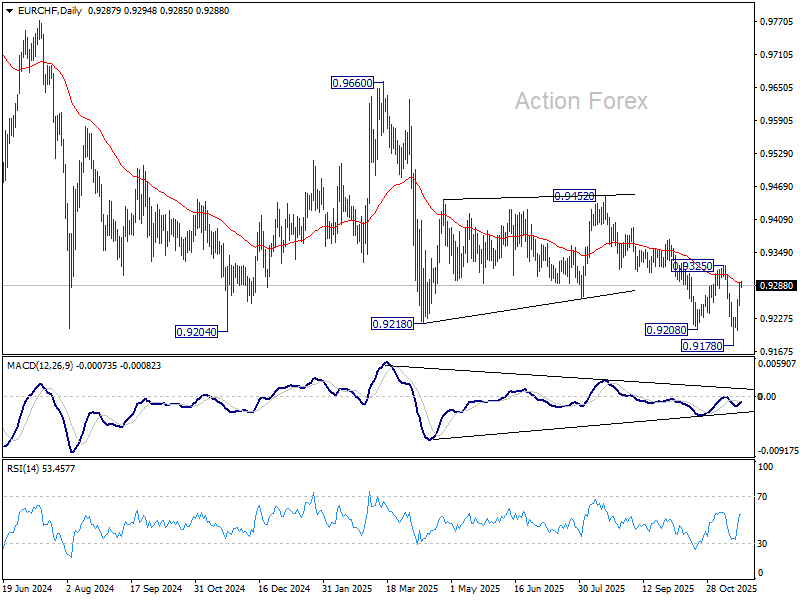
In the bigger picture, outlook remains bearish with EUR/CHF staying well inside long term falling channel after multiple rejection by 55 W EMA (now at 0.9377). Next target is 61.8% projection of 1.1149 to 0.9407 from 0.9928 at 0.8851. Break of 0.9452 resistance is needed to be the first sign of medium term bottoming. Otherwise, outlook will stay bearish in case of strong rebound.
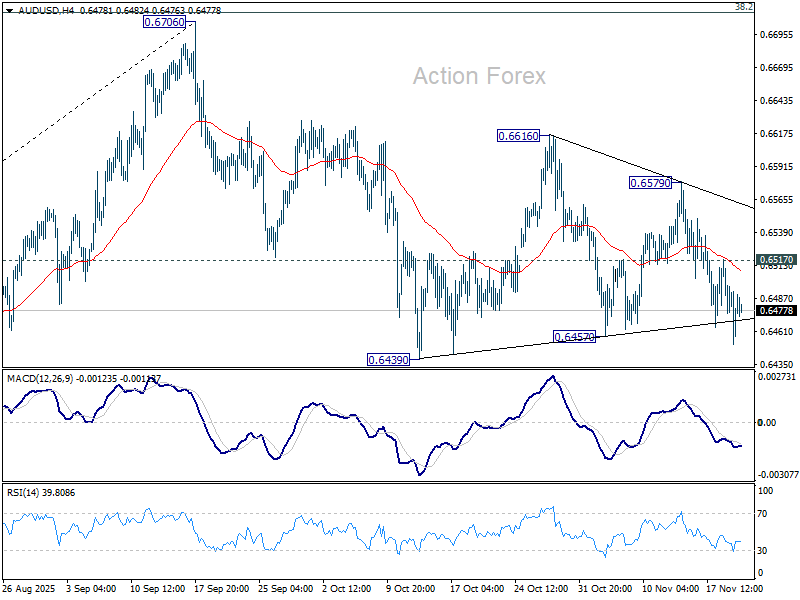
AUD/USD Daily Report
Daily Pivots: (S1) 0.6449; (P) 0.6481; (R1) 0.6511; More...
Intraday bias in AUD/USD is back on the downside with breach of 0.6457 support. Deeper fall would be seen to 0.6413 cluster (38.2% retracement of 0.5913 to 0.6706 at 0.6403). Decisive break there will carry larger bearish implications. On the upside, above 0.6517 minor resistance will turn intraday bias neutral again first.
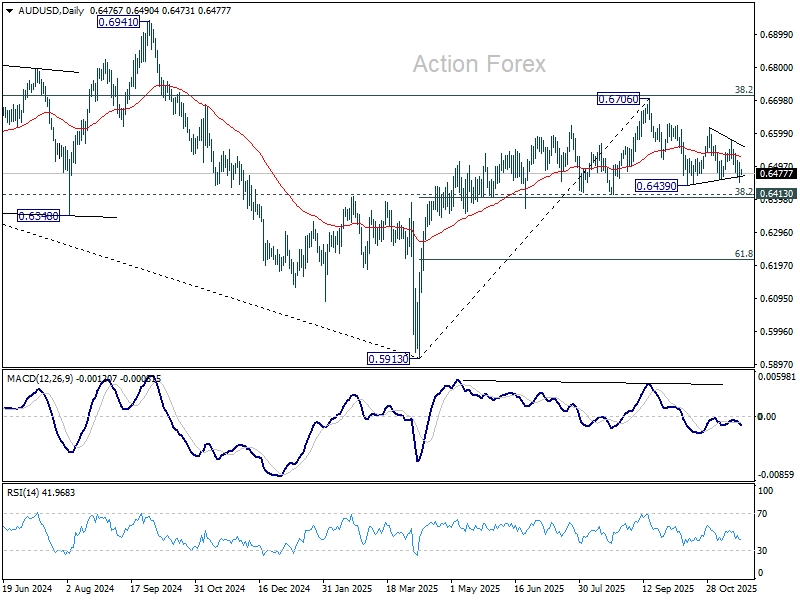
In the bigger picture, there is no clear sign that down trend from 0.8006 (2021 high) has completed. Rebound from 0.5913 is seen as a corrective move. Outlook will remain bearish as long as 38.2% retracement of 0.8006 to 0.5913 at 0.6713 holds. Break of 0.6413 support will suggest rejection by 0.6713 and solidify this bearish case. Nevertheless, considering bullish convergence condition in W MACD, sustained break of 0.6713 will be a strong sign of bullish trend reversal, and pave the way to 0.6941 structural resistance for confirmation.
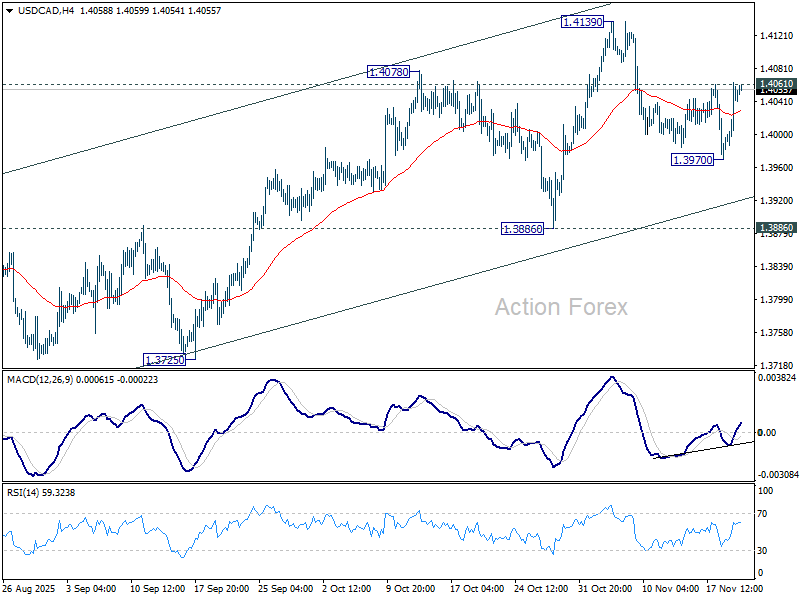
USD/CAD Daily Outlook
Daily Pivots: (S1) 1.4000; (P) 1.4033; (R1) 1.4082; More...
Intraday bias in USD/CAD is turned neutral again with current recovery. On the upside, firm break of 1.4061 resistance will indicate that pullback from 1.4139 has already completed, and bring stronger rally to retest this high. Nevertheless, break of 1.3970 will extend the pullback towards 1.3886 support. Strong rebound should be seen there to preserve the whole rally from 1.3538.
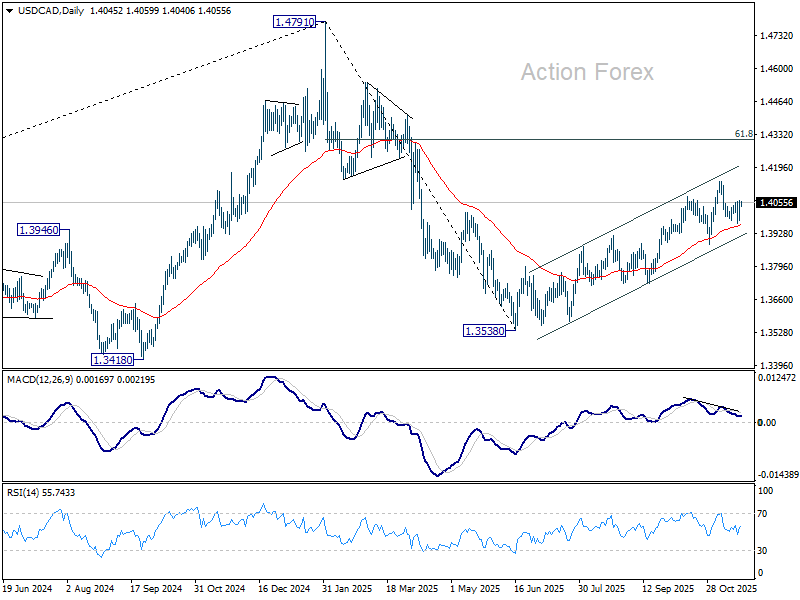
In the bigger picture, price actions from 1.4791 medium term top is likely just unfolding as a correction to up trend from 1.2005 (2021 low), with rise from 1.3538 as the second leg. A third leg should follow before up trend resumption. That is, range trading is set to extend for the medium term. For now, this will remain the favored case as long as 1.3886 support holds. However, firm break of 1.3886 will revive the case that fall from 1.4791 is indeed a larger scale correction.
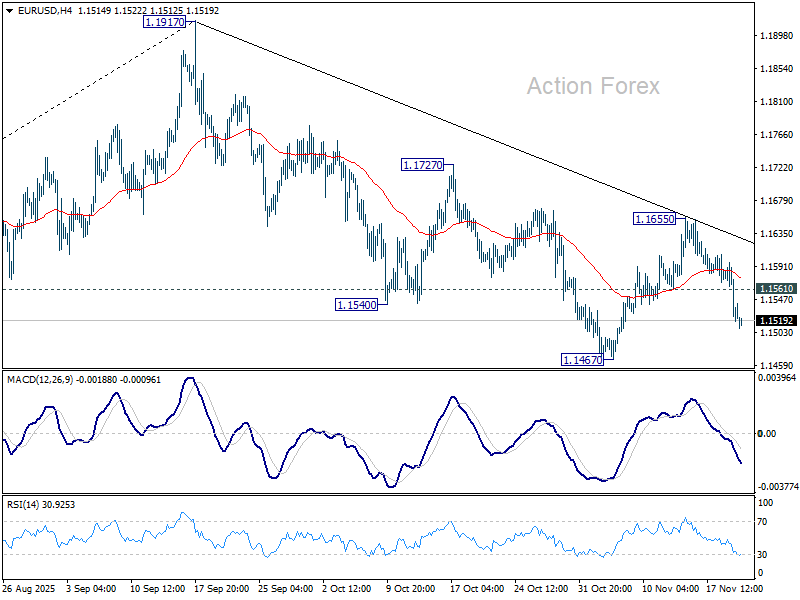
EUR/USD Daily Outlook
Daily Pivots: (S1) 1.1505; (P) 1.1551; (R1) 1.1584; More…
EUR/USD's break of 1.5610 support suggests that recovery from 1.1467 has completed at 1.1655. More importantly, fall from 1.1917 is still in progress. Intraday bias is back on the downside for 1.1467 first. Firm break there will target 1.1390, and then 38.2% retracement of 1.0176 to 1.1917 at 1.1252. For now, risk will stay on the downside as long as 1.1655 resistance holds, in case of recovery.
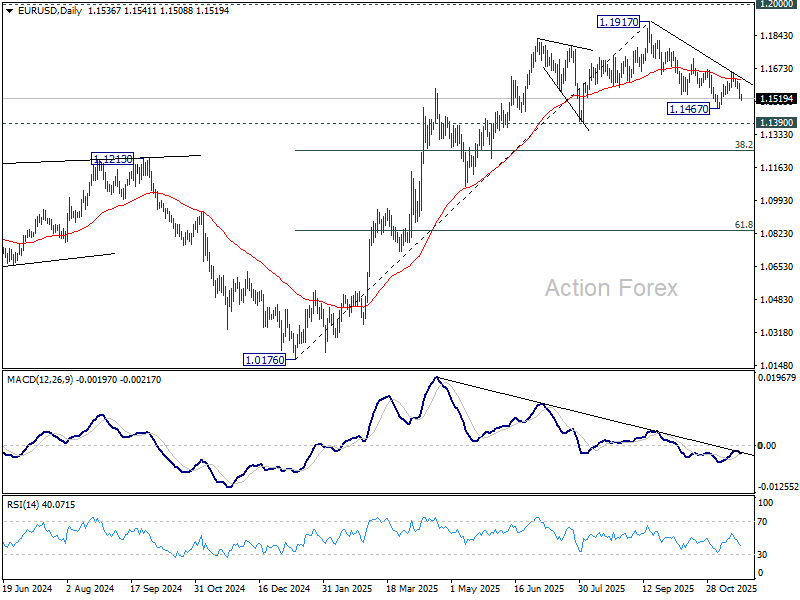
In the bigger picture, considering bearish divergence condition in D MACD, a medium term top is likely in place at 1.1917, just ahead of 1.2 key psychological level. As long as 55 W EMA (now at 1.1328) holds, the up trend from 0.9534 (2022 low) is still in favor to continue. Decisive break of 1.2000 will carry larger bullish implications. However, sustained trading below 55 W EMA will argue that rise from 0.9534 has completed as a three wave corrective bounce, and keep long term outlook bearish.
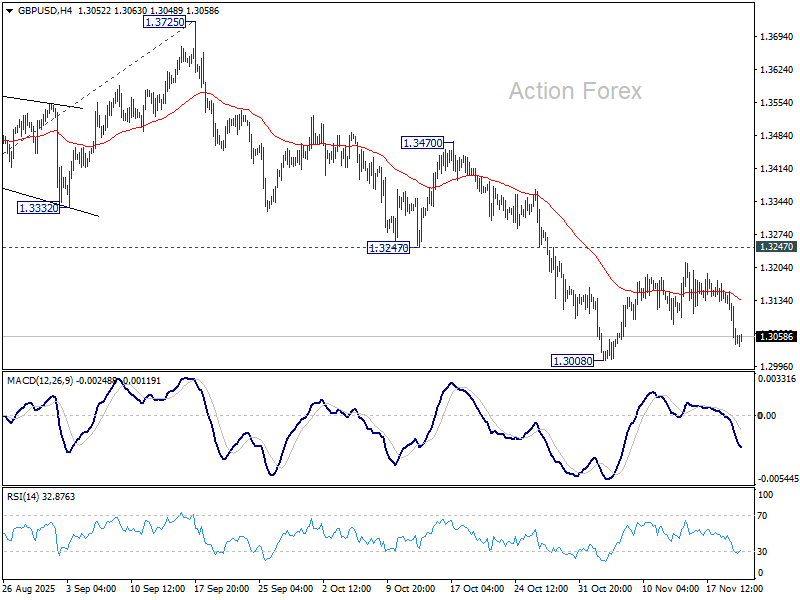
GBP/USD Daily Outlook
Daily Pivots: (S1) 1.3018; (P) 1.3087; (R1) 1.3129; More...
GBP/USD dips further today but it stays above 1.3008 support. Intraday bias remains neutral and outlook is unchanged. Further decline is expected as long as 1.3247 support turned resistance holds. Break of 1.3008 will resume the fall from 1.3787, and target 138.2% projection of 1.3787 to 1.3140 from 1.3725 at 1.2831. Nevertheless, firm break of 1.3247 will suggest that fall from 1.3787 has completed as a corrective move already.
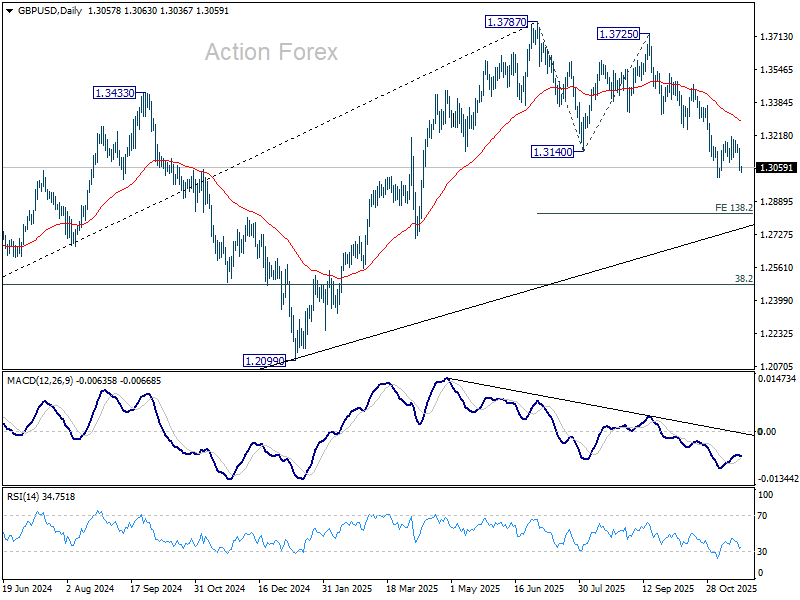
In the bigger picture, the break of 55 W EMA (now at 1.3182) is taken as the first sign that corrective rise from 1.0351 (2022 low) has completed. Decisive break of trend line support (now at 1.2824) will solidify this case and target 38.2% retracement of 1.0351 to 1.3787 at 1.2474 next. Meanwhile, in case of another rise, strong resistance should emerge below 1.4248 (2021 high) to cap upside to preserve the long term down trend.
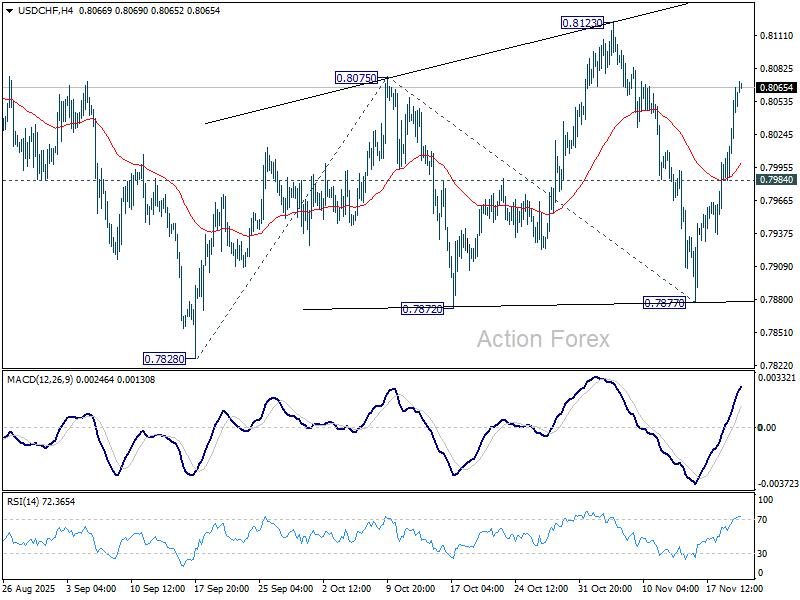
USD/CHF Daily Outlook
Daily Pivots: (S1) 0.8006; (P) 0.8036; (R1) 0.8087; More…
Intraday bias in USD/CHF remains on the upside at this point. Rise from 0.7877 is seen as a leg in the corrective pattern from 0.7828 low. Further rally would be seen to 0.8123 resistance next. On the downside, below 0.7937 minor support will turn bias neutral first. Break of 0.7877 will bring retest of 0.7828 low.
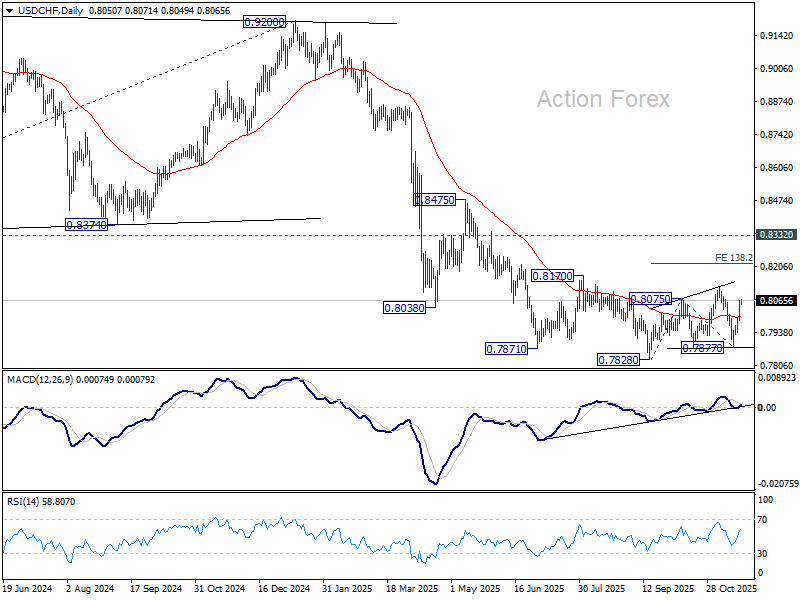
In the bigger picture, long term down trend from 1.0342 (2017 high) is still in progress. Next target is 100% projection of 1.0146 (2022 high) to 0.8332 from 0.9200 at 0.7382. In any case, outlook will stay bearish as long as 0.8332 support turned resistance holds (2023 low).
In October, FOMC Members Expressed Disagreement About December’s Decision
The Federal Reserve Open Market Committee (FOMC) lowered the federal funds rate to a target range of 4.00% to 3.75% in October, despite the government shutdown leaving them with little additional official data since their September decision.
The minutes showed that the committee is still concerned about the impact of tariffs on inflation. Many participants also noted expectations of core goods inflation to pick up over the coming quarters, as tariffs pass through to firms' prices. On the other hand, a few participants did note that productivity gains from AI and automation may help tamp down cost increases. Still, participants seemed to agree that inflation expectations remained well anchored.
On the labor market, participants did comment on the lack of a jobs report for September and reported relying on private-sector estimates and limited government data. Pointing to the available data, including surveys, participants generally viewed the data as consistent with layoffs and hiring both having remained low, and the job market having softened through September and October, but not sharply.
Participants generally judged that "uncertainty about the economic outlook remained elevated", while still noting that inflation had moved up from earlier in the year and remained elevated. Many participants who voted in favor of lowering rates this meeting "could have also supported maintaining the level of the target range".
Critically, participants expressed strongly differing views about what would be appropriate at their December meeting. While most participants seem to favor reducing the policy rate over time, several of those with that view are unconvinced that would be appropriate in December. Many participants suggested that it would likely be appropriate to keep the target range unchanged for the rest of the year given their economic outlook.
Key Implications
The key takeaway from this meeting, and the real surprise, is how strongly FOMC members disagree about what is likely in their December meeting. The recent upticks in inflation and the signs that tariffs are going to start passing through to inflation are eroding some members confidence in the balance of risks, and may be pushing out rate cuts further.
The release of the missing jobs data tomorrow will be critical for the FOMC. The potential for the committee to favor holding rates constant in December rests in part on the assessment of the labor market as softening but not sharply deteriorating. This potentially puts the rate outlook in a "bad news is good news" situation – jobs reports for September and October that confirm the labor market is only softening and not severely weakening will strengthen the case made by some FOMC members in September that a pause in December may be appropriate.