Sample Category Title
Robots, Humans and Donkeys
No, AI probably won’t take your (whole) job, but the future workforce will look different. Fortunately, the labour force is already shifting in mostly the right direction. Policy and social changes are nonetheless needed.
- AI automates some tasks previously performed by humans, but concerns about mass unemployment are overblown. History shows that new technologies reduce the share of employment in the affected industries, but economy-wide production and employment rise. Nor will AI reduce the value of human labour. The things ‘robots’ can do will become more abundant, and their relative price will fall. The relative price of the things only humans can do will rise.
- The impact will vary by occupation and experience level. Clerical and administrative work will be more susceptible to AI automation, caring occupations and technical trades less so. Entry-level positions will be more susceptible than more senior ones, because they do more of the routine ‘donkey work’ amenable to automation. They are also more impacted by economic downturns generally. This explains the concerns about the entry-level and graduate job market in the US. So far, though, we do not see the same signs in Australia.
- Demographic trends in countries like Australia (but not the US) point to a future workforce well-positioned for the AI era. However, challenges remain in gender diversity and funding across key industries. Policy reforms and shifts in societal attitudes toward different occupations will be essential to navigate the changes.
AI – generative or otherwise – is simply another technology for automating previously manual tasks. If you can do something more productively, you need fewer people to produce current output.
Understandably, people worry that their jobs will therefore disappear. Some commentators argue that AI will induce mass unemployment, requiring governments to introduce a Universal Basic Income. These messages have even come from voices in the tech industry, which hardly seems like a good way to garner public support for the industry’s direction.
The good news is that with every wave of a new, transformative technology, we find new things to do. While there might be a bumpy transition, the end result is not lower employment. Consider that 300 years ago, around two-thirds of English men worked in agriculture; higher figures applied 200 years ago for agrarian colonial societies, including what became Australia. Now,
fewer than 2% do, but we have more and more varied food to enjoy. The other 98% of the workforce do other things. The same process occurred when the Industrial Revolution mechanised spinning. The share of the non-agricultural workforce in England and Wales that was in the textiles industry fell even as production of clothing and other textiles boomed. And rising manufacturing productivity in the 1900s enabled the expansion of many desirable services.
Contrary to the claims of the more tech-oriented commentators, AI does not reduce the value of human labour. Quite the opposite. The supply of things ‘robots’ (AI) can do will expand massively, lowering their relative price. By contrast, the supply of workers available to do things that only humans can do will not increase as much, even allowing for some displacement through automation. Thus, the relative price of things only humans can do will in fact rise. The human touch, the in-person service, will become the prestige item, and a greater share of people will work in those fields.
And there will be many things that only humans can do, even as the AI models get better. In particular, knowing what the right question to ask is (which, along with “and how to ask it”, is all that people mean by “prompt engineering”) is a uniquely human activity.
The automation effect will not affect every job equally, of course. A range of recent reports have sought to quantify which tasks are most susceptible to full automation, which will be augmented, and thus which jobs will need to change the most. There are limitations to this work. For a start, jobs are not just a collection of disjoint tasks. The original ILO methodology also uses ChatGPT to work out which tasks are impacted and might not fully capture agentic AI’s current and future capabilities.
Still, the pattern is clear – clerical and administrative work is most susceptible to automation, while for most other occupations, AI will augment rather than fully automate. Technical and building trades, along with ‘caring’ occupations where the human touch is so important, are the least impacted.
Another thread in the concerns about the impact of AI on the labour market is that it will be uneven across different experience levels in the same occupation. Put simply, the tasks most prone to automation are the routine ones usually performed by the less experienced members of an occupation. We already hear this concern from contacts in industries such as management consulting, tertiary education and elsewhere. If all the routine ‘donkey work’ in these white-collar occupations is eliminated, these contacts worry, what will the new graduate staff do? How will they learn?
We suspect these fears are overstated. The amount of ‘donkey work’ needed to teach the new graduates how to be a more senior member of the profession was surely lower than the amount that needed to be done. My own observation of the economics profession accords with this. The workload for a young public-sector economist three decades ago involved a lot of spreadsheet grunt-work that needed to be done but did not teach the young economist much after the first couple of times they did it. Nowadays, the data have become more abundant, the models more sophisticated and the expectations elevated. And despite not cutting their teeth on as much ‘donkey work’ as their predecessors, the young economists and other analysts of today certainly meet those higher expectations. A steeper learning curve was possible. (And perhaps, with less time spent learning and doing the ‘donkey work’, more time is available to develop the all-important judgement, soft skills and other things only humans can do.)
There is a less optimistic wrinkle to the issue of impact by experience level, though. Even if the skill expectations for new entrants to white-collar roles increase, these entry-level roles are still the most impacted. Academic research shows that new entrants are also the most impacted in economic downturns. It is much easier to just not hire an unknown quantity with no experience than to sack longstanding, experienced staff. These early-career experiences also seem to have a ‘scarring’ effect on people, long into their careers.
It is therefore no wonder that people are worried about the prospects for new entrants to the workforce in the AI era. In the US, signs of a weakening in this segment could be a signal of a weakening economy, but researchers from
Stanford University, the St Louis Fed and elsewhere suspect that AI adoption is already disrupting the jobs market. (It could also be a bit of both, or an unwind of some pandemic-era over-hiring.)
There does not seem to be evidence of this effect in Australia just yet. As Westpac Economics colleague Ryan Wells noted last week, youth unemployment has been volatile and broadly picking up. But we are not yet seeing evidence of a generalised deterioration in hiring for entry-level roles. JSA notes that fill rates for vacant jobs have been improving, including in the June quarter (the latest report). If the bottom had fallen out of the entry-level jobs market, we would expect to see the average number of applicants per vacancy rise materially in key industries, but the number of qualified or suitable applicants remain steady or fall. But the JSA data show the opposite – rising average numbers of qualified/suitable applicants with total applicants steady or a little lower than a year or two ago.
The research on differential impact by occupation does suggest that some policy and societal response is needed, though. As noted above, the roles most impacted by AI are expected to be white-collar occupations with a lot of routine tasks amenable to automation. Those least impacted are the ‘caring’ occupations where human contact is needed, and technical and trades occupations, where physical processes predominate. We have previously highlighted the industry-level implications of this.
The glass-half-full view of these likely shifts is that trends in labour supply in most western countries, including Australia but not the US, are shifting in the required direction. As Ryan and I noted in a report a couple of months ago, population ageing is, outside the US, leading to higher overall labour force participation, with the workforce becoming older and more female. A higher share of older, more experienced workers, who know what the right question is, are exactly the kind of workers who will be best placed to thrive in the AI era, perhaps with a little training and practice.
The glass-half-empty view, though, is that Australia already struggles to train enough technical and trades workers. A strong gender skew also limits supply: the construction industry has the lowest proportion of female workers of any industry. Even mining has a much better gender balance. Meanwhile, ‘caring’ occupations have expanded lately for other reasons, but public funding has its limits. Policy action is clearly needed around both these occupation groups. But society also needs to re-evaluate the social cachet accorded to some jobs over others.
Gold Price Forecast: Bullion Settles at $4077 on Mixed NFP Data, Fed Increasingly Hawkish
At the time of writing, gold trades at $4077 per troy ounce, having erased gains made prior to the months-delayed September US Nonfarm Payrolls release.
Relatively unchanged at -0.02% in today’s session, gold currently trades approximately 7.00% shy of all-time highs made in October, and remains on pace to secure a remarkable yearly gain of over 50% in 2025.
What’s next for gold?
Gold (XAU/USD): Key takeaways 20/11/2025
- Picking up in volatility in recent weeks, precious metal markets remain highly active as markets readjust expectations for the Federal Reserve’s December 10th decision
- With yesterday’s FOMC minutes revealing “strongly differing views” in the most recent meeting, a better-than-expected September NFP report adds to rationale to slow down the Fed’s current easing cycle
- Albeit now concluded, the US government shutdown and the knock-on effect on data availability still cast a shadow over financial markets, with many using gold as a hedge against policy risk and a perceived decline in central bank efficacy
Gold (XAU/USD): September NFP report eases pressure on December rate cut
Having had at least some dealings with the financial markets for the best part of ten years now, today marks a special occasion, being the first time I’m discussing nonfarm payrolls on the 20th of the month.
While I can only speak for myself, I’m happy to see NFP back on the calendar in any capacity, especially considering the lack of economic data in the last month or so.
With that said, this brings us back to today, and, albeit representing conditions from some time ago, today saw the release of September’s nonfarm payroll report, which beat expectations by +69,000 jobs.
Keeping our focus on precious metal markets, let’s discuss some implications for gold, as well as further macroeconomic themes currently at play.
Gold (XAU/USD): Fundamental Analysis 20/11/2025
September jobs beat to further Fed hawkish tilt:
Let’s start by addressing the most recent and obvious fundamental happening in the last twelve hours - the September NFP report.
Delayed just shy of two months owing to the US government shutdown, September’s numbers beat expectations by some margin. However, the report also noted rising unemployment to 4.4%, its highest level since 2021, as well as downward revisions to both July and August numbers.
While this is fairly mixed on the surface, markets have received some assurance that the US labour market was stronger than expected before the US government shutdown took place.
Speaking of which, we’ve also recently had confirmation from the Bureau of Labor Statistics that October’s NFP release will not be postponed indefinitely, and alongside the delayed release of November’s report, today serves as the last NFP report available before the Federal Reserve votes again on interest rates early December.
Tying this all together, and considering the most recent data, albeit two months old, shows some buoyancy in the US labour market, this will not only somewhat relieve the pressure for further rate cuts by the Fed, but further vindicates a pre-existing hawkish tilt, best described by Vice Chair Jefferson’s commitment to “proceed slowly” in the current easing cycle.
On gold pricing, there’s no surprise that any notion of higher interest rates spells trouble for the current rally in gold pricing, with price action in the last week or so, alongside the Fed’s increasingly hawkish stance, testament to this.
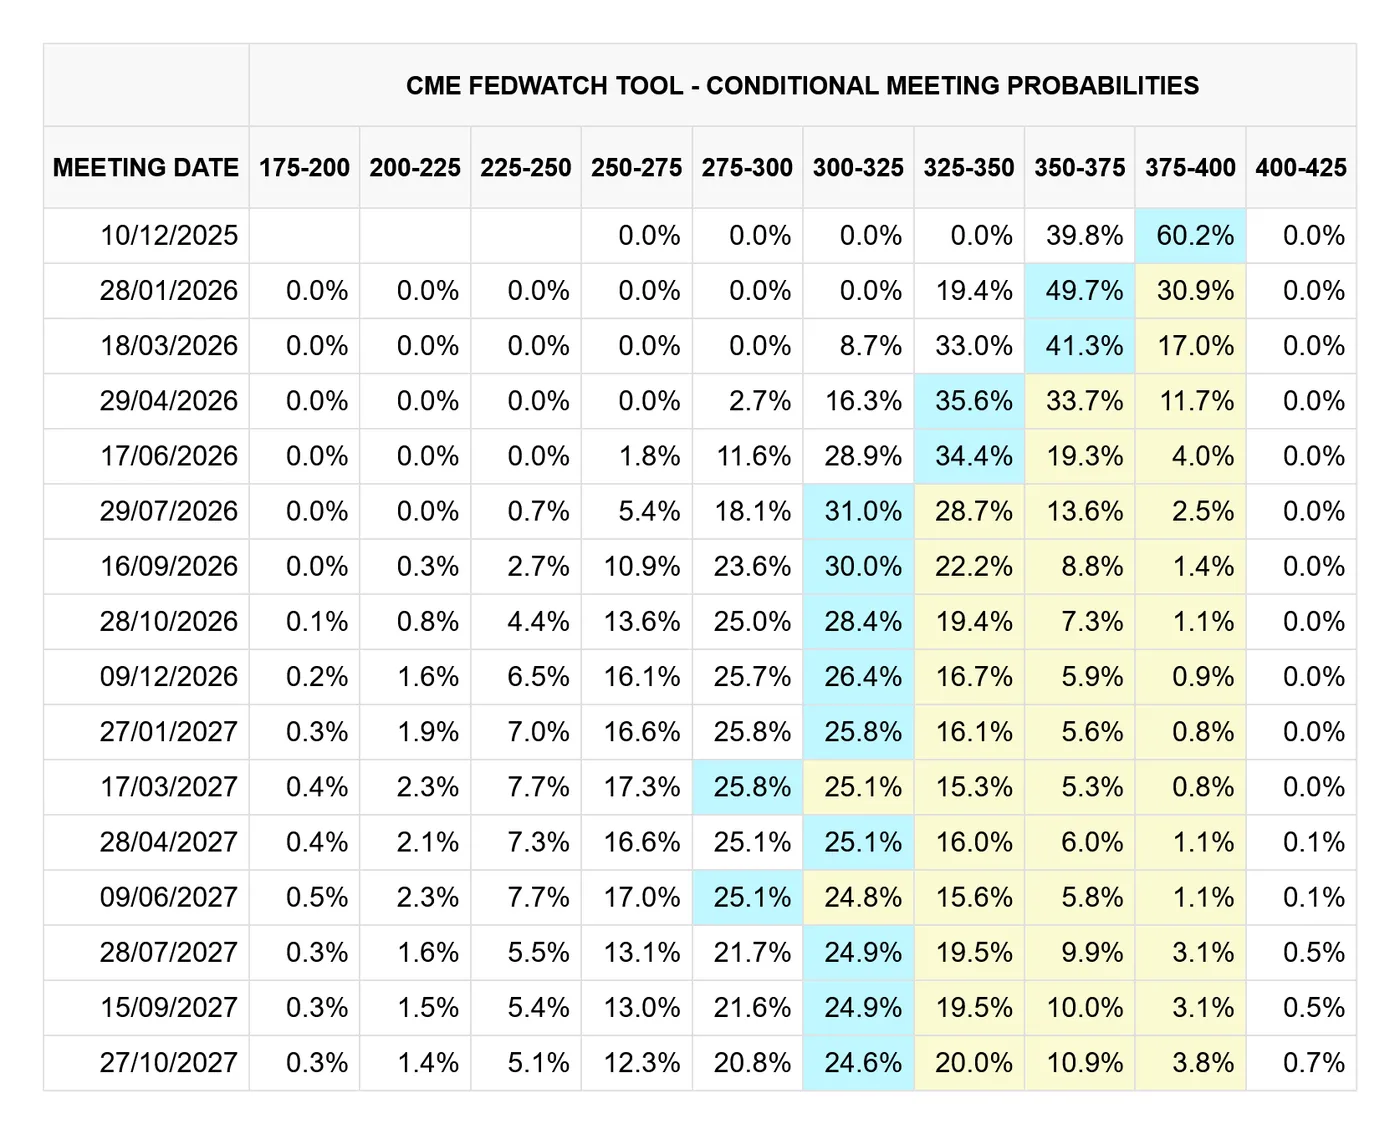
CME FedWatch, 20/11/2025
At the time of writing, the CME FedWatch tool predicts rates will be maintained in the upcoming meeting, currently at odds of 60.2%, with a 39.8% chance of a rate cut.
It’s worth noting that, just a few short weeks ago, directly following the October decision, markets had almost ‘nailed-on’ a consecutive rate cut in December, with this change of expectations going some way in explaining the pullback seen in precious metal pricing.
Split room highlighted in October FOMC Minutes:
Released yesterday, minutes shared from the October rate decision highlight an increasingly divided group of policymakers ahead of the December decision, adding further rationale to expectations of rates being left unchanged.
In brief, the meeting can be summarised as follows:
- “Several” participants believed that another rate in December could be justified if the labour market continues to slow. Naturally, today’s NFP raises some questions over this
- “Many” others deemed that a maintenance of the current rate, held at 4.00%, would be the appropriate choice in December, especially considering the lack of economic data to guide decisions in recent months
- Focus seems to be primarily on the jobs market, as opposed to inflation or economic activity, which makes today’s NFP report, which will be the last before the December decision, even more significant
For reasons discussed above, at least one result is a dampening of gold upside, which would likely receive a second wind if rates were to be cut.
Gold as a hedge against policy failure:
While the above casts some shadow on gold upside, markets are currently asking one question: How can the Fed make the right decision with no data?
On this basis, and despite the notion that higher interest rates are inherently gold negative, there is some evidence that markets are using gold as a hedge against policy failure.
Put simply, and while the Fed could be forgiven considering the lack of data, suppose a decision to hold in December was found to be, in hindsight, the wrong decision when more data is made available, this could spell trouble for the dollar, making gold a more attractive option to store wealth by comparison.
Albeit a minor theme at play, this could offer some precious metals upside, as markets are less confident of the Fed’s grasp on current conditions, although by no fault of their own.
XAU/USD: Technical Analysis 20/11/2025
XAU/USD: Daily (D1) chart analysis:
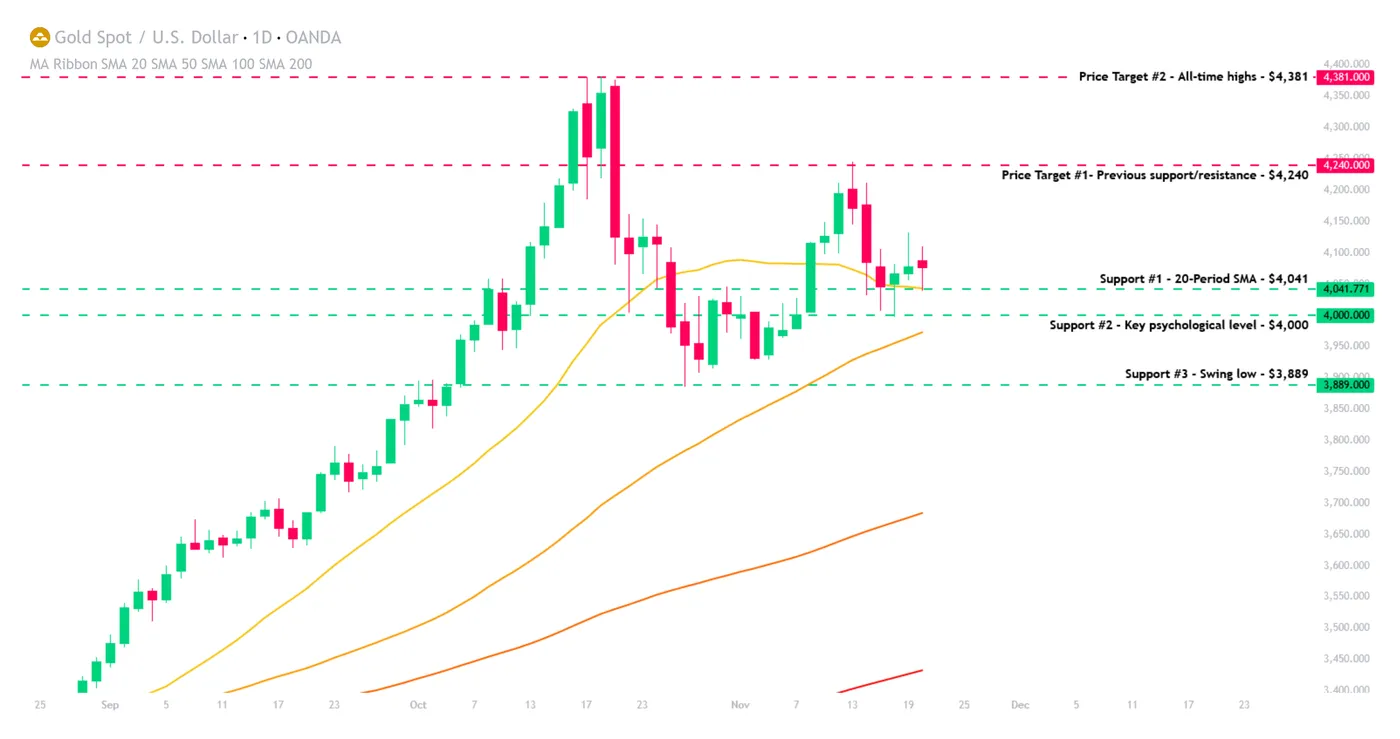
Gold (XAU/USD), D1, OANDA, TradingView, 20/11/2025
I’m pleased to say that, as per my previous coverage, the first price target of $4,090 was hit in yesterday’s session.
Going forward, here are some other levels to consider:
Price targets and support/resistance levels:
- Price target/Resistance #1 - $4,240 - Previous support/resistance
- Price target/Resistance #2 - $4,381 - All-time highs
- Support #1 - $4,031 - 20-Period SMA
- Support #2 - $4,000 - Key psychological level
- Support #3 - $3,889 - Swing low
While, in fairness, my commentary above suggests a somewhat bearish angle in the short term for gold, it’s essential to remember that gold has rallied in response to other macro factors this year, despite a staunchly hawkish Fed for much of 2025.
To the downside, the yellow metal remains well supported by many moving averages, as well as the key psychological level of $4,000, which was breached for the first time earlier this year.
Otherwise, and in the immediate, we have seen a few pin bars to suggest that there is further bullish appetite for gold, despite a more hawkish Fed putting a lid on 2025 upside - at least for now.
Fed’s Hammack: Insurance rate cut for jobs could backfire on financial stability
Cleveland Fed President Beth Hammack made it clear today that she sees significant risks in cutting interest rates further while inflation remains above target. Easing policy to cushion the labor market, she argued, risks "prolonging this period of elevated inflation" and could further fuel "risk-taking" in an already buoyant financial environment.
With stock prices firm and credit flowing freely, financial conditions are “quite accommodative,” she noted, making additional monetary support potentially counterproductive.
Hammack also warned that lowering short-term borrowing costs could distort asset pricing and credit risk signals. Such distortions, she said, might leave the economy exposed to a sharper downturn late.
She pushed back against the idea that a rate cut would act as “insurance” for the labor market, saying policymakers must recognize that such insurance could come "at the cost of heightened financial stability risks”.
Sunset Market Commentary
Markets
US investors today for the first time in a long while could prepare for, admittedly flawed, first class official US data guiding trading, including challenging their assessment on Fed policy. (Outdated) US September payrolls data were the actor in case. After the October 29 hawkish Fed rate cut, US bond yields ahead of the report had arrived near the topside of short-term trading ranges (10-y 4.05%/4.16%; 2-y 3.52%/3.63%). At least a big minority of Fed governors in the meantime indicated great cautions/reluctance to ‘unconditionally’ further bring the policy rate to a neutral level. Inflation was still expected to stay above the target for quite some time to come while visibility on the heath of the labour market was low with few really alarming indications. US money markets had reduced the probability of a December rate cut to 25-30% in the run-up to the payrolls release. Unfortunately for markets, the first report in two months and a halve didn’t bring clear message for the December 10 policy meeting. The US economy in September added a stronger than expected 119k jobs (was -4k in August). The unemployment rate rose from 4.3% to 4.4%, but this was mainly due to a rise in the labour force/participation rate. Wage data (AHE 0.2% M/M and 3.8%) was very close to expectations. This also applies to the restart of the publication of (more timely) weekly jobless claims (220k week ended Nov 15). The reports won’t force highly divided FOMC members toward some kind of consensus view. As an illustration, Cleveland Fed president Hammack (one of the Hawkish members) repeated that cutting interest rates now risks prolonging this period of inflation and could encourage risk taking in financial markets. US yields in hesitant trading ceded 1-3 bps across the curve in minor steepening move. Little spill-over effects from the US data to European yields’ markets. German yields continue cautiously grinding north (2-y + 1 bp, 30-y +3 bps). A mildly positive US jobs report also supports the ‘post-Nvidia’ equity rebound as a big positive earnings surprise released after the close of the US markets yesterday eased fears on an ‘AI-bubble’. The EuroStoxx 50 after recent correction regains 1.2%. The US equities open between 1.2% (Dow) and 2.0% (Nasdaq) higher.
On FX, the dollar is shifting into a lower gear after yesterday’s (partially USD/JPY inspired) rally on a positive risk sentiment and a still open debate on December Fed easing. DXY at 100.1 holds near the 100.25/36 resistance/ST highs. EUR/USD (1.154) stays north of the 1.15 big figure, but the picture remains a bit unconvincing. The yen (USD/JPY 157.5) and Japanese bonds remain in the defensive as the government is preparing a JPY 21.3 trillion ($ 135 bln) stimulus package, raising further questions on fiscal sustainability (but to some extent also on room for the BOJ to further normalize policy). Sterling regains modest ground with EUR/GBP testing the 0.88 barrier as markets are looking forward to further details on next week’s budget.
News & Views
The Norges Bank released its quarterly expectations survey (Q4) in which it questions economists, social partners, business leaders and households. Economists and social partners expect goods and services inflation 12 months ahead to be 2.8% (from 2.8% & 2.7%). Business leaders and households expect stronger short term price pressure at respectively 3.7% (from 4%) and 3.9% (unchanged). Expected annual wage growth is seen in the 4%-4.5% range (from 4.3%-4.4%) with the exception of households who estimate it lower at 2.9% (from 3.2%). 31.7% of business leaders expect profitability of their own company to improve over the next 12 months (30.3% in Q3 survey), 37.8% expects it to remain unchanged (from 38.2%) and 27.6% sees it weakening (from 28.8%). Today’s survey won’t alter the Norwegian central bank’s plans to implement a long rate pause at the current 4%. Norwegian money markets only discount a 37% probability of a 25 bps rate cut between now and the end of Q1 2026. EUR/NOK is going nowhere at 11.73.
• Belgian consumer confidence climbed further in November, hitting the highest level since October 2021 (2 from 0). All indicators signaled an improvement. At the aggregate level, there was a slight improvement in expectations concerning the economic situation in Belgium (-26 from -27), and in addition, a continued weakening of fears about unemployment (-10 from -6), following the sharp decline seen in October. On a personal level, households are more optimistic about their own financial situation (0 from -2), and their expectations about their capacity to save hit a new peak for the year (26 from 23). Belgian business confidence will be published next Monday.
US: Delayed Jobs Report Beats Expectations on Hiring, But Unemployment Rate Ticks up to 4.4%
Non-farm employment increased by 119k in September, ahead of Bloomberg's consensus forecast of 54k. Job gains for the prior two months were revised lower by a total of 33k.
- Over the past three months, non-farm payrolls averaged 62k jobs, below the twelve-month average of 109k.
Private payrolls rose 97k – up from 18k reported in August – with nearly all the gains concentrated in health care & social assistance (+57k) and leisure & hospitality (+47k). Meanwhile, transportation & warehousing (-25k), professional & business services (-20k), manufacturing (-6k) and mining & logging (-3k) all shed jobs. Federal hiring (-3k) was also lower on the month, though this was more than offset by a decent gain in state & local (+25k) hiring.
In the household survey, the labor force (+470k) shot higher, eclipsing a smaller gain in civilian employment (+251k), pushing the unemployment rate up 0.12 percentage points to a new cyclical high of 4.4%. The labor force participation rate ticked up to 62.4% (from 62.3%).
Average hourly earnings (AHE) rose 0.3% month-on-month (m/m) – a tick slower than in August. On a twelve-month basis, AHE held steady at 3.8%.
Key Implications
Non-farm payrolls surprised to the upside in September, with private sector hiring rising at its fastest clip in five months. However, jobs gains remain narrowly concentrated, and there's mounting evidence to suggest that trade exposed sectors like manufacturing and transportation & warehousing are increasingly feeling the pain from higher tariffs.
Given the slate of alternative private sector labor market data released since September, this morning's employment report was dated even before its release. Unfortunately, it will be another month before the next employment report, as the Bureau of Labor Statistics announced yesterday that it won't be releasing the October report and the release of the November figures has been delayed until December 16th. This will come after the FOMC's next meeting on December 10th, which almost guarantees that the Fed will skip its next meeting to better assess the backflow of economic data.
USD/JPY Mid-Day Outlook
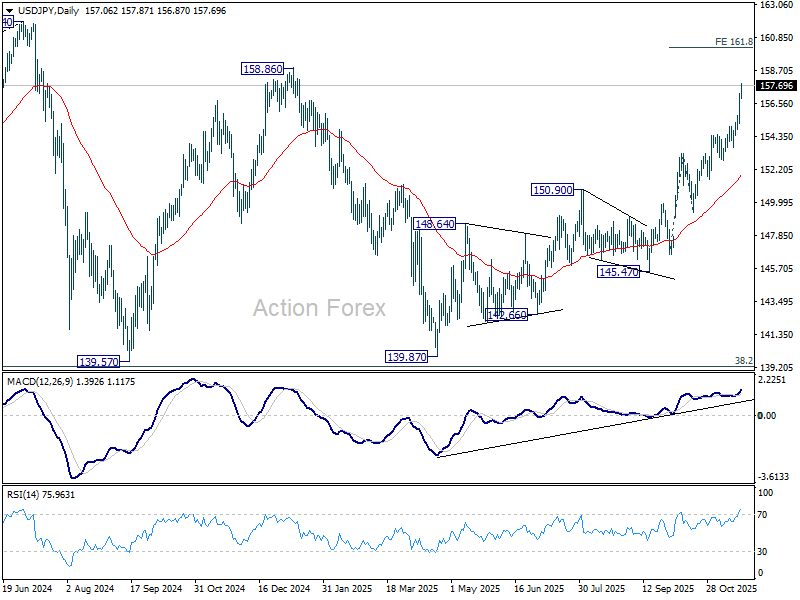
Daily Pivots: (S1) 155.85; (P) 156.52; (R1) 157.82; More...
Intraday bias in USD/JPY remains on the upside for 158.85 key structural resistance, and then 161.8% projection of 146.58 to 153.26 from 149.37 at 160.17. On the downside, below 156.45 minor support will turn intraday bias neutral and bring consolidations, before staging another rise.
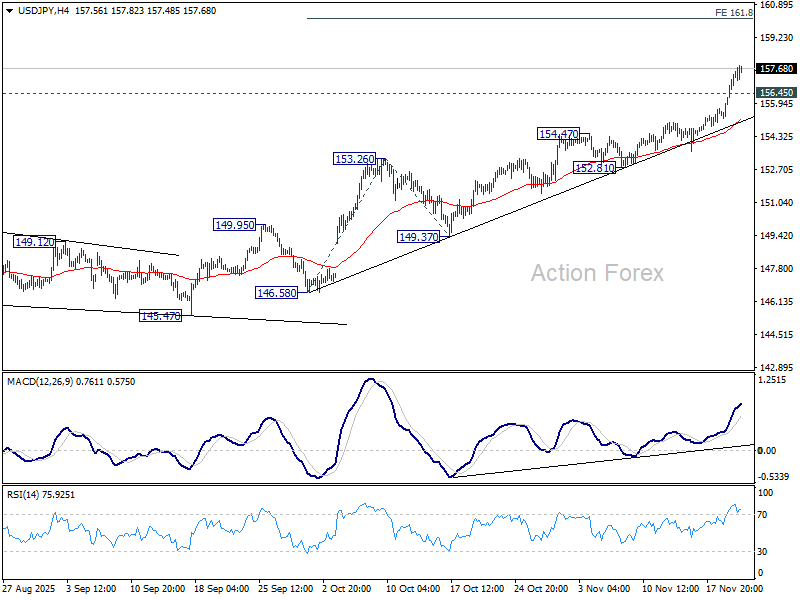
In the bigger picture, current development suggests that corrective pattern from 161.94 (2024 high) has completed with three waves at 139.87. Larger up trend from 102.58 (2021 low) could be ready to resume through 161.94 high. Decisive break of 158.85 structural resistance will solidify this bullish case and target 161.94 for confirmation. On the downside, break of 150.90 restiveness turned support will dampen this bullish view and extend the corrective pattern with another falling leg.
USD/CHF Mid-Day Outlook
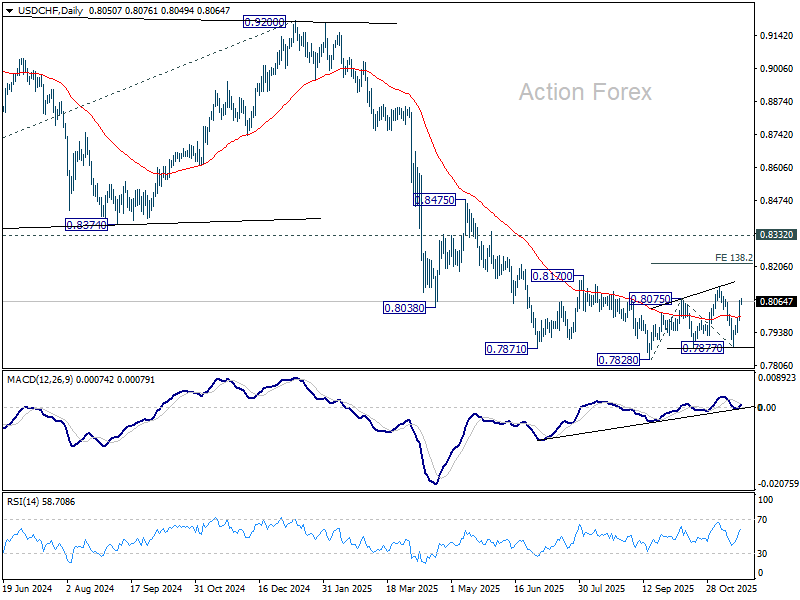
Daily Pivots: (S1) 0.8006; (P) 0.8036; (R1) 0.8087; More…
Intraday bias in USD/CHF remains on the upside for the moment. Rise from 0.7877 is seen as a leg in the corrective pattern from 0.7828 low. Further rally would be seen to 0.8123 resistance next. On the downside, below 0.7937 minor support will turn bias neutral first. Break of 0.7877 will bring retest of 0.7828 low.
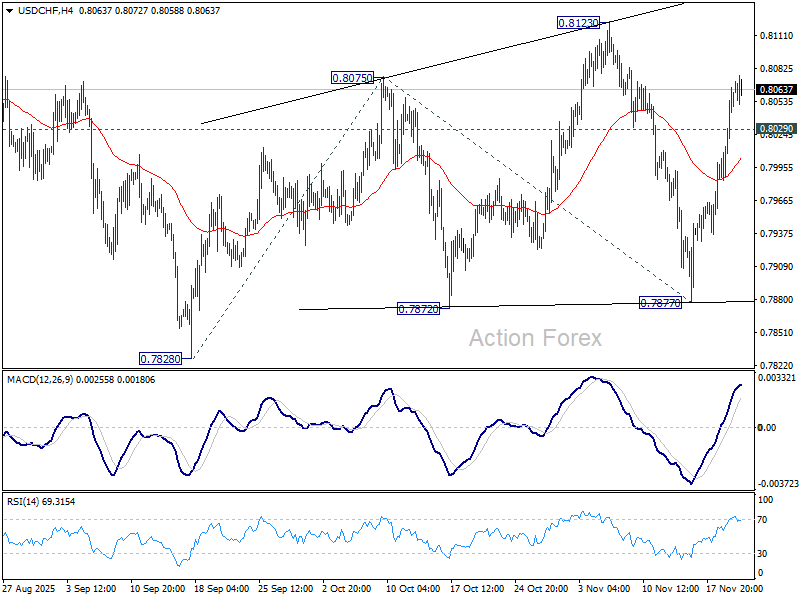
In the bigger picture, long term down trend from 1.0342 (2017 high) is still in progress. Next target is 100% projection of 1.0146 (2022 high) to 0.8332 from 0.9200 at 0.7382. In any case, outlook will stay bearish as long as 0.8332 support turned resistance holds (2023 low).
EUR/USD Mid-Day Outlook
Daily Pivots: (S1) 1.1505; (P) 1.1551; (R1) 1.1584; More…
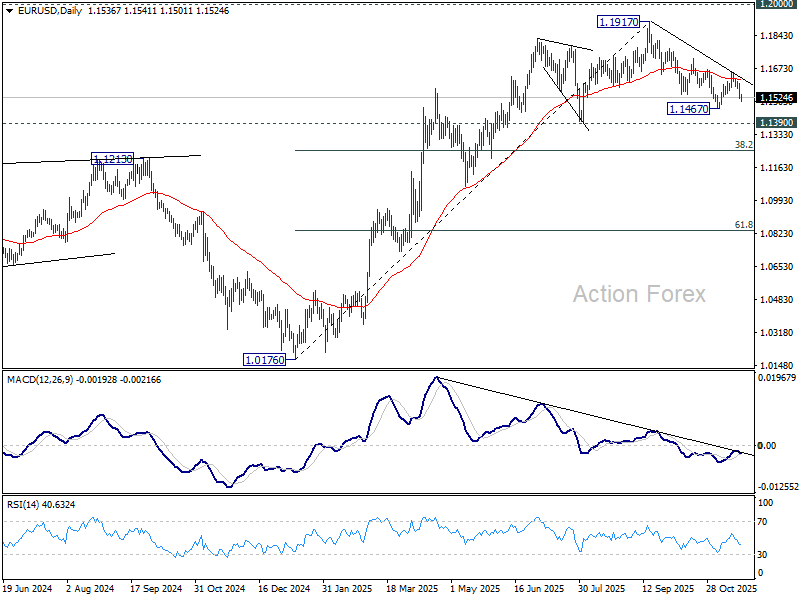
Intraday bias in EUR/USD remains on the downside for retesting 1.1467 first. Firm break there will target 1.1390, and then 38.2% retracement of 1.0176 to 1.1917 at 1.1252. For now, risk will stay on the downside as long as 1.1655 resistance holds, in case of recovery.
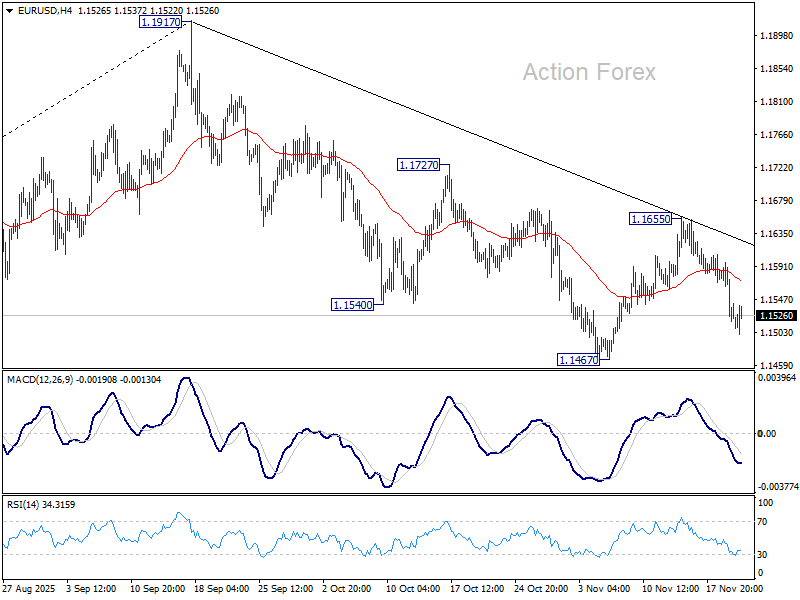
In the bigger picture, considering bearish divergence condition in D MACD, a medium term top is likely in place at 1.1917, just ahead of 1.2 key psychological level. As long as 55 W EMA (now at 1.1328) holds, the up trend from 0.9534 (2022 low) is still in favor to continue. Decisive break of 1.2000 will carry larger bullish implications. However, sustained trading below 55 W EMA will argue that rise from 0.9534 has completed as a three wave corrective bounce, and keep long term outlook bearish.
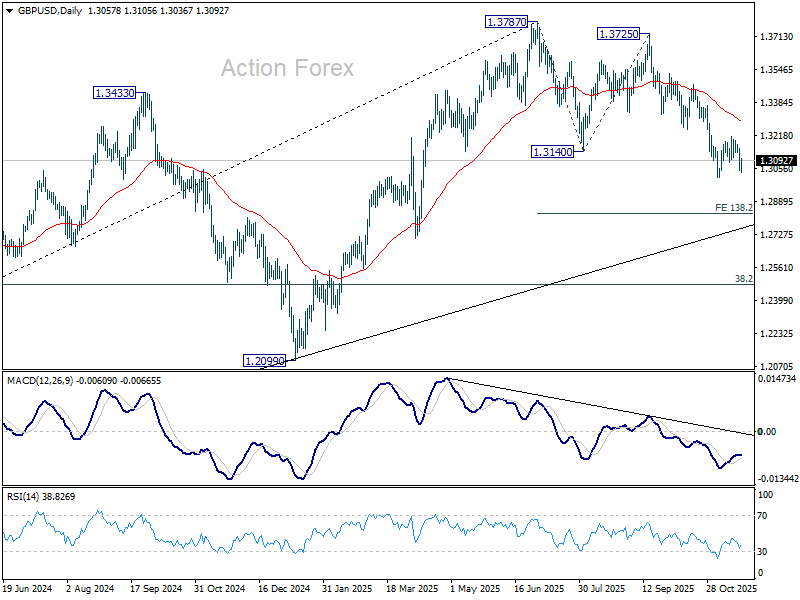
GBP/USD Mid-Day Outlook
Daily Pivots: (S1) 1.3018; (P) 1.3087; (R1) 1.3129; More...
GBP/USD recovers mildly today as range trading continues. Intraday bias remains neutral and outlook is unchanged. Further decline is expected as long as 1.3247 support turned resistance holds. Break of 1.3008 will resume the fall from 1.3787, and target 138.2% projection of 1.3787 to 1.3140 from 1.3725 at 1.2831. Nevertheless, firm break of 1.3247 will suggest that fall from 1.3787 has completed as a corrective move already.
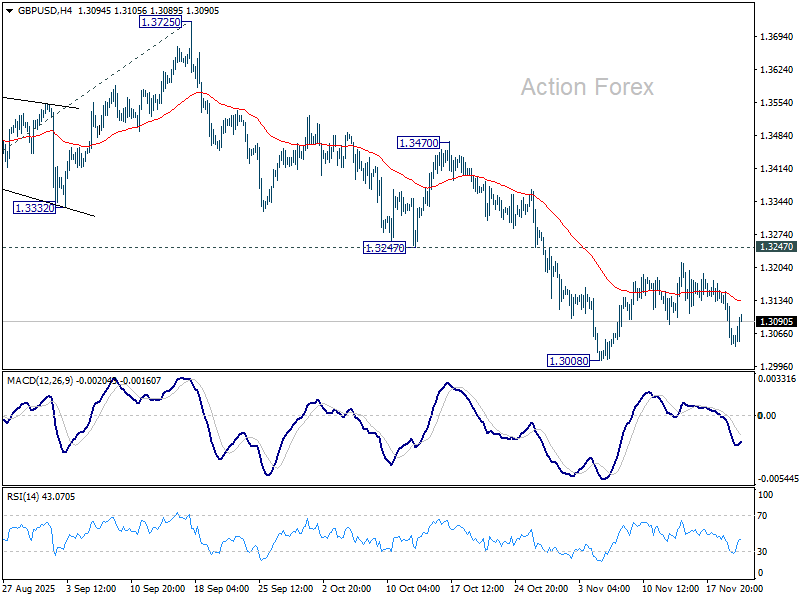
In the bigger picture, the break of 55 W EMA (now at 1.3182) is taken as the first sign that corrective rise from 1.0351 (2022 low) has completed. Decisive break of trend line support (now at 1.2824) will solidify this case and target 38.2% retracement of 1.0351 to 1.3787 at 1.2474 next. Meanwhile, in case of another rise, strong resistance should emerge below 1.4248 (2021 high) to cap upside to preserve the long term down trend.