Sample Category Title
USD/JPY Daily Outlook
Daily Pivots: (S1) 155.85; (P) 156.52; (R1) 157.82; More...
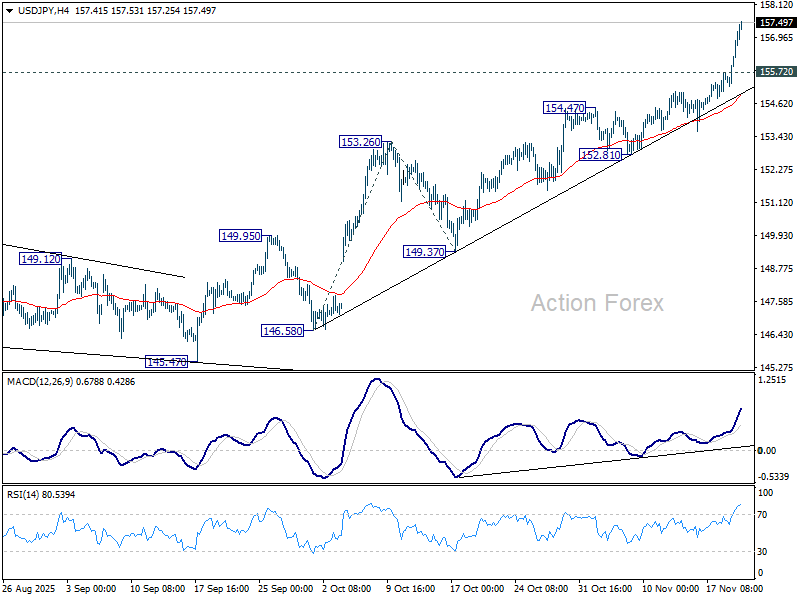
USD/JPY accelerates higher today and intraday bias stays on the upside for 158.85 key structural resistance, and then 161.8% projection of 146.58 to 153.26 from 149.37 at 160.17. On the downside, below 155.72 minor support will turn intraday bias neutral and bring consolidations, before staging another rise.
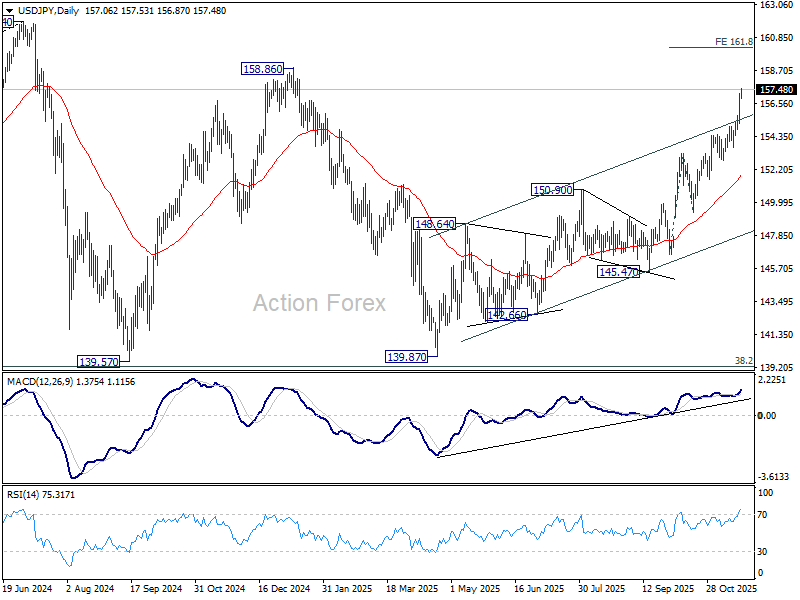
In the bigger picture, current development suggests that corrective pattern from 161.94 (2024 high) has completed with three waves at 139.87. Larger up trend from 102.58 (2021 low) could be ready to resume through 161.94 high. Decisive break of 158.85 structural resistance will solidify this bullish case and target 161.94 for confirmation. On the downside, break of 150.90 restiveness turned support will dampen this bullish view and extend the corrective pattern with another falling leg.
Risk-On Returns, Fed Cut Bets Fade Further, NFP Looms
Investor sentiment turned decisively positive in Asian markets today, even as traders continued dialing back expectations for a December Fed rate cut following the hawkish tone in FOMC minutes released overnight. The shift in rate expectations would normally pressure risk assets, but momentum instead swung in the other direction thanks to a powerful catalyst out of the U.S. tech sector.
Chip stocks in Japan and South Korea were the clear standouts, surging after Nvidia’s earnings crushed Wall Street forecasts. The company also issued a stronger-than-expected sales outlook for Q4, providing a fresh jolt of optimism for the AI complex. The rally in semiconductors fed through regional benchmarks, with U.S. futures trading sharply higher ahead of the September jobs report.
Whether the rebound can sustain into the U.S. session remains the big question. If Nvidia-driven enthusiasm holds, investors may once again push AI valuation anxiety into the background—at least temporarily—helping stabilize broader risk sentiment after a shaky week.
All eyes now turn to September non-farm payrolls. The report is expected to show 53k increase in payrolls, a modest improvement from August’s weak 22k print, while unemployment is projected to hold steady at 4.3%. Still, the data come with an important caveat: they are dated.
The Bureau of Labor Statistics confirmed it will not publish a full October jobs report due to the now-resolved federal shutdown, and will instead combine October and November payrolls into a single release on December 16—six days after the Fed’s final policy meeting of the year. That means policymakers will go into December lacking two months of labor-market detail.
Against that backdrop, today’s NFP figures may not sway the Fed in any meaningful way. With the minutes revealing resistance to cutting again in December, only an extreme surprise is likely to disrupt the current bias toward a hold. The market has largely absorbed that message, so reaction to the print could be subdued.
In Japan, Yen’s slide remains relentless. Even comments from a BoJ hawk failed to spark support, as the currency was overwhelmed by the strong rally in domestic equities. As USD/JPY vaulted through the 157 handle, officials attempted verbal intervention once again.
Chief Cabinet Secretary Minoru Kihara warned that the Yen is experiencing sudden, one-way movements and that authorities are watching for “excessive fluctuations or disorderly moves. But the warnings—repeated frequently over the past week—had no discernible market impact.
For the week so far, Dollar is leading the performance table, followed by Loonie and then Aussie. Yen is the weakest, trailed by Swiss Franc and Kiwi. Euro and Sterling are drifting in the middle of the pack.
In Asia, at the time of writing, Nikkei is up 2.91%. Hong Kong HSI is up 0.23%. China Shanghai SSE is up 0.33%. Singapore Strait Times is up 0.21%. Japan 10-year JGB yield is up 0.039 at 1.811. Overnight, DOW rose 0.10%. S&P 500 rose 0.38%. NASDAQ rose 0.59%. 10-year yield rose 0.010 to 4.133.
Fed minutes highlight resistance to December cut
The October FOMC minutes revealed a deep policy split, and "strongly differing views", showing officials wrestling with how quickly to bring rates toward neutral. While the majority continues to expect additional easing “over time,” many expressed reluctance to cut again in December, marking a more hawkish tone than markets had priced in. Traders reacted swiftly, pushing the probability of a December rate cut down to roughly 33%, compared with near 50% earlier in the week.
Participants were divided across a wide spectrum of views. Several argued that economic conditions would justify another quarter-point reduction at the next meeting "if the economy evolved about as they expected over the coming intermeeting period."
However, “many participants” judged that keeping rates "unchanged for the rest of the year" would be more "appropriate" under their baseline outlooks. Others supported further easing but emphasized that December may not necessarily be the right moment.
The Committee delivered its second straight cut in October, moving rates to 3.75–4.00%, but Chair Jerome Powell emphasized at the press conference that another move in December was “not a foregone conclusion.” The internal debate documented in the minutes supports that caution and signals stronger resistance to front-loading additional cuts.
BoJ hawkish voice emerges as Koeda presses for further tightening
BoJ board member Junko Koeda delivered one of the clearest hawkish signals from the Bank in recent months, arguing that real interest rates remain “significantly low” and must be moved back toward "a state of equilibrium" to avoid “unintended distortions” later.
With Japan’s output gap hovering around zero and labor market tightness intensifying amid widespread staff shortages, she said in a speech that current economic backdrop justifies continued normalization. In her view, the BoJ should “continue to raise” the policy rate as economic conditions improve, adjusting monetary support in line with the broader recovery in activity and prices.
Koeda stressed that underlying inflation is running near 2%, but achieving the target sustainably requires the Bank to test how firmly "underlying inflation has remained stable or been anchored". That means looking beyond headline data to evaluate whether price momentum can hold as temporary factors fade.
Her message contrasted with recent political pressure urging caution on tightening, reinforcing the divide between policymakers seeking gradual normalization and government voices favoring prolonged accommodation.
PBoC stays on hold, but markets still see easing ahead
China kept its benchmark lending rates unchanged for the sixth straight month today, leaving the one-year Loan Prime Rate at 3.0% and the five-year rate at 3.5%. The decision was widely expected, as policymakers continue to balance the need to support the economy with the desire to avoid fuelling financial instability.
Despite the steady stance, markets remain convinced that monetary easing has merely been delayed, not abandoned. Expectations are building for a “dual cut” — both policy rates and banks’ reserve requirement ratio — in the first quarter of 2026.
A run of softer October activity data has strengthened that view. Exports contracted, retail sales slowed further, and the property-related drag has shown little sign of easing. Combined, these have heightened concerns that Q4 will bring more headwinds rather than signs of stabilization.
Adding to the pressure, new bank lending fell sharply in October as both households and businesses remained reluctant to take on fresh debt amid weak confidence and ongoing US-China trade tensions. Without a meaningful pickup in credit demand, Beijing may soon have little choice but to act more decisively to shore up activity in early 2026.
USD/JPY Daily Outlook
Daily Pivots: (S1) 155.85; (P) 156.52; (R1) 157.82; More...
USD/JPY accelerates higher today and intraday bias stays on the upside for 158.85 key structural resistance, and then 161.8% projection of 146.58 to 153.26 from 149.37 at 160.17. On the downside, below 155.72 minor support will turn intraday bias neutral and bring consolidations, before staging another rise.
In the bigger picture, current development suggests that corrective pattern from 161.94 (2024 high) has completed with three waves at 139.87. Larger up trend from 102.58 (2021 low) could be ready to resume through 161.94 high. Decisive break of 158.85 structural resistance will solidify this bullish case and target 161.94 for confirmation. On the downside, break of 150.90 restiveness turned support will dampen this bullish view and extend the corrective pattern with another falling leg.
Ethereum Softens Before NFP, Leaving Bulls and Bears on High Alert
Key Highlights
- Ethereum extended losses below $3,500 and $3,200.
- ETH is now trading below a key bearish trend line with resistance at $3,480 on the daily chart.
- Bitcoin price gained bearish momentum and tested $90,000.
- The US nonfarm payrolls could change by 50K in Sep 2025.
Ethereum Technical Analysis
Ethereum remained in a bearish zone after it settled below $3,500. ETH extended losses like Bitcoin and declined below $3,200.
Looking at the daily chart, the price even spiked below $3,000 and settled below the 100-day simple moving average (red). The current price action suggests an increase in bearish pressure. If there is a recovery wave, the price could face resistance at $3,200.
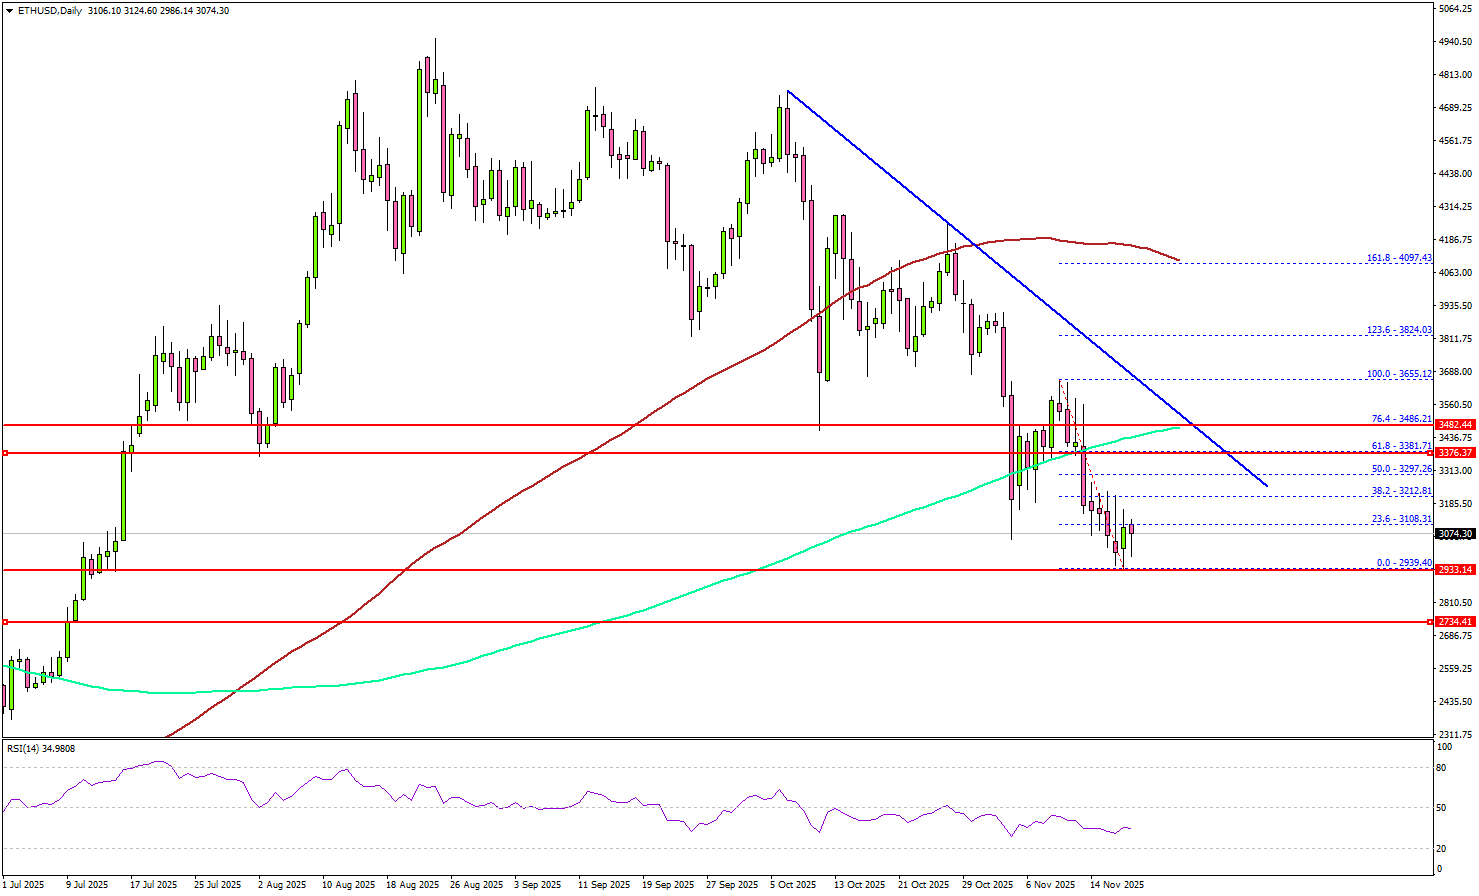
The next major resistance is near the $3,380 level. The main resistance is now forming near the $3,480 zone. There is also a key bearish trend line with resistance at $3,480 on the same chart.
A daily close above the $3,380 resistance zone could start another steady increase. In the stated case, the price may perhaps rise toward the $3,500 level. The next stop for the bulls may perhaps be $3,650.
On the downside, the bulls might be active near $3,000 and $2,940. The main support is now forming near $2,740, below which the price could slide toward $2,550. Any more losses might call for a move toward $2,320.
Looking at Bitcoin, there was a sharp decline below $100,000, and the bears seem to be aiming for more downside in the near term.
Economic Releases
- US Initial Jobless Claims - Forecast 223K, versus 232K previous.
- US nonfarm payrolls for Sep 2025 – Forecast 50K, versus 22K previous.
- US Unemployment Rate for Sep 2025 - Forecast 4.3%, versus 4.3% previous.
BoJ hawkish voice emerges as Koeda presses for further tightening
BoJ board member Junko Koeda delivered one of the clearest hawkish signals from the Bank in recent months, arguing that real interest rates remain “significantly low” and must be moved back toward "a state of equilibrium" to avoid “unintended distortions” later.
With Japan’s output gap hovering around zero and labor market tightness intensifying amid widespread staff shortages, she said in a speech that current economic backdrop justifies continued normalization. In her view, the BoJ should “continue to raise” the policy rate as economic conditions improve, adjusting monetary support in line with the broader recovery in activity and prices.
Koeda stressed that underlying inflation is running near 2%, but achieving the target sustainably requires the Bank to test how firmly "underlying inflation has remained stable or been anchored". That means looking beyond headline data to evaluate whether price momentum can hold as temporary factors fade.
Her message contrasted with recent political pressure urging caution on tightening, reinforcing the divide between policymakers seeking gradual normalization and government voices favoring prolonged accommodation.
PBoC stays on hold, but markets still see easing ahead
China kept its benchmark lending rates unchanged for the sixth straight month today, leaving the one-year Loan Prime Rate at 3.0% and the five-year rate at 3.5%. The decision was widely expected, as policymakers continue to balance the need to support the economy with the desire to avoid fueling financial instability.
Despite the steady stance, markets remain convinced that monetary easing has merely been delayed, not abandoned. Expectations are building for a “dual cut” — both policy rates and banks’ reserve requirement ratio — in the first quarter of 2026.
A run of softer October activity data has strengthened that view. Exports contracted, retail sales slowed further, and the property-related drag has shown little sign of easing. Combined, these have heightened concerns that Q4 will bring more headwinds rather than signs of stabilization.
Adding to the pressure, new bank lending fell sharply in October as both households and businesses remained reluctant to take on fresh debt amid weak confidence and ongoing US-China trade tensions. Without a meaningful pickup in credit demand, Beijing may soon have little choice but to act more decisively to shore up activity in early 2026.
Fed minutes highlight resistance to December cut
The October FOMC minutes revealed a deep policy split, and "strongly differing views", showing officials wrestling with how quickly to bring rates toward neutral. While the majority continues to expect additional easing “over time,” many expressed reluctance to cut again in December, marking a more hawkish tone than markets had priced in. Traders reacted swiftly, pushing the probability of a December rate cut down to roughly 33%, compared with near 50% earlier in the week.
Participants were divided across a wide spectrum of views. Several argued that economic conditions would justify another quarter-point reduction at the next meeting "if the economy evolved about as they expected over the coming intermeeting period."
However, “many participants” judged that keeping rates "unchanged for the rest of the year" would be more "appropriate" under their baseline outlooks. Others supported further easing but emphasized that December may not necessarily be the right moment.
The Committee delivered its second straight cut in October, moving rates to 3.75–4.00%, but Chair Jerome Powell emphasized at the press conference that another move in December was “not a foregone conclusion.” The internal debate documented in the minutes supports that caution and signals stronger resistance to front-loading additional cuts.
(FED) Minutes of the Federal Open Market Committee
October 28–29, 2025
A joint meeting of the Federal Open Market Committee and the Board of Governors of the Federal Reserve System was held in the offices of the Board of Governors on Tuesday, October 28, 2025, at 9:00 a.m. and continued on Wednesday, October 29, 2025, at 9:00 a.m.1
Developments in Financial Markets and Open Market Operations
The manager turned first to an overview of broad market developments during the intermeeting period. Market participants left their macroeconomic outlooks little changed, and they appeared to continue to interpret data made available over the period as consistent with a resilient economy. In line with the stable outlook, investors' expectations for the path of the policy rate, whether market based or survey based, were virtually unchanged over the period. Investors expected a 25 basis point lowering in the target range for the federal funds rate at the October meeting and another 25 basis point lowering at the December meeting, although some uncertainty around the December meeting was evident in responses to the Open Market Desk's Survey of Market Expectations (Desk survey) as well as in market prices.
The manager turned next to developments in Treasury markets and market-based measures of inflation compensation. Treasury yields were little changed, on net, over the period, consistent with stable expectations for the policy rate. Inflation compensation moved lower over the period, particularly for shorter tenors, with staff models attributing these recent movements to temporary factors.
Broad equity indexes continued to rise over the period, with the largest technology companies performing strongly on market participants' optimism about artificial intelligence (AI). The manager noted that rising stock prices were consistent with expectations for continued robust growth in earnings. Corporate bond spreads increased a bit this period but remained low in absolute terms. A couple of well-publicized bankruptcies, as well as some credit losses reported by some banks, led to increased investor scrutiny of credit markets, with investors reportedly closely tracking the riskiest segments of credit markets for signs of weakening and noting the possibility of future losses.
Regarding international developments, the manager noted that the trade-weighted dollar index rose somewhat over the period. Despite its recent appreciation, the dollar remained weaker against all major currencies since the beginning of the year, and outside forecasters continued to expect that the dollar would depreciate modestly over the medium term.
The manager highlighted that recent changes in money market conditions indicated that the level of reserves could be approaching ample. Rates on Treasury repurchase agreements (repo) moved notably higher relative to the interest rate on reserve balances (IORB). Investors attributed this movement to a decline in available liquidity amid ongoing balance sheet runoff and continued large Treasury debt issuance. Higher repo rates induced a fairly rapid increase in the effective federal funds rate (EFFR) relative to the IORB, with signs that the EFFR might increase further. The manager noted this increase was widespread, with many participants paying higher rates in the federal funds market regardless of their reasons for borrowing. Consistent with the move higher in repo rates, the overnight reverse repurchase agreement (ON RRP) facility had seen usage fall to de minimis levels. Meanwhile, the standing repo facility (SRF) was used more frequently over the period, albeit not in large volumes. Pressures in money markets resulted in notable movements in some other indicators of reserve ampleness. For example, payments by banks shifted to later in the day, suggesting that banks may have been economizing on reserves. In addition, the share of domestic banks borrowing in the federal funds market increased. The estimated elasticity of the EFFR with respect to changes in the supply of reserves was stable during the period. That outcome, however, was likely due to the aftereffects of the debt ceiling resolution, which likely affected the estimated elasticity. A related concept, the elasticity of repo rates to changes in repo volumes, increased significantly since late August.
The manager recommended that the Committee consider stopping the runoff of the System Open Market Account (SOMA) portfolio soon. Continuing runoff would imply that volatility in money markets likely would continue to intensify. He noted that excessive money market rate volatility would pose risks to both the control of the policy rate and the stability of funding in the repo market, which in turn could affect the stability of the U.S. Treasury market. The manager also noted that further reductions in the size of the portfolio may prove short lived because they would bring forward the time when the Desk would need to restart purchases of securities to maintain ample reserves.
The manager next discussed the expected trajectory of the balance sheet. Respondents to the Desk survey had come to expect an earlier date for the end of portfolio runoff. Market outreach suggested further revisions to expectations in the week after the survey concluded, and the staff estimated that if respondents had been asked more recently, almost half would have said they expected the Committee to announce an end to runoff at this meeting.
In the absence of material take-up at the ON RRP facility, and assuming balance sheet runoff would end, the staff estimated that reserves would continue to gradually decline amid projected increases in other Federal Reserve liabilities. At times, such as during quarter- and year-ends and tax dates, reserves were projected to dip to quite low levels. Against this backdrop, the staff would continue to monitor indicators of reserve conditions closely.
The manager noted that the Desk would begin using a new trading platform in the near future to conduct its repo and reverse repo operations, with other operations to follow in coming quarters. In addition, he informed the Committee that there were no intervention operations in foreign currencies for the SOMA during the intermeeting period.
By unanimous vote, the Committee ratified the Desk's domestic transactions over the intermeeting period.
Special Topic: The Standing Repo Facility
The staff provided background on the SRF, including potential benefits and costs of central clearing for SRF transactions. The main potential benefit mentioned was greater effectiveness of the SRF in helping to maintain control of the federal funds rate. Central clearing could increase counterparties' willingness to use the SRF when there is upward pressure on repo rates, which would damp pressures on the federal funds rate. The main potential costs mentioned were increased systemic importance of providers of central clearing, the potential for central clearing of the SRF to enable greater nonbank leverage in the Treasury market, and the expansion of the Federal Reserve's footprint in financial markets.
Most participants commented on the potential for central clearing of SRF transactions.2 Among those who commented, almost all noted that the SRF supports the effective implementation and transmission of monetary policy as well as smooth market functioning, and that central clearing of SRF transactions could improve the effectiveness of the facility. A few participants raised concerns about risks associated with centrally clearing the SRF, including increased systemic importance of providers of central clearing. Participants who commented generally supported further study of central clearing of SRF transactions.
Special Topic: Balance Sheet Issues
The FOMC's "Plans for Reducing the Size of the Federal Reserve's Balance Sheet," announced in May 2022, indicated that the Committee intended to cease balance sheet runoff when reserve balances are judged to be somewhat above a level consistent with ample reserves. Since then, the size of the Federal Reserve's balance sheet had declined substantially. In addition, money market conditions had tightened recently, which suggested that reserve balances may be moving closer to ample. In light of these developments, participants discussed whether to stop balance sheet runoff soon and what the maturity composition of the SOMA Treasury portfolio (SOMA portfolio) should be in the longer run. Views on the latter would guide the investment of principal payments received on the Federal Reserve's holdings of agency securities as well as the composition of securities to be purchased once reserve management purchases would be needed. Consequently, participants agreed that their discussions at this meeting would help inform the Committee's future decisions regarding the long-run composition of the SOMA portfolio.
The participants' discussion was preceded by a staff presentation. The staff reviewed the composition of the SOMA portfolio and provided some considerations regarding the SOMA portfolio's long-run composition, including issues related to market functioning, potential macroeconomic implications, interactions with the Treasury's management of the federal debt, monetary policy implementation, and the Federal Reserve's net income. The presentation noted that the current share of Treasury bills in the SOMA portfolio was smaller than the bill share of total Treasury securities outstanding. The staff also noted that if the Committee preferred a SOMA portfolio with a proportional or greater share of Treasury bills relative to total outstanding, policymakers could wait to make that decision because the current share of Treasury bills in the portfolio was small and the monthly amounts of principal payments received on the Federal Reserve's holdings of agency securities that would need to be reinvested once balance sheet runoff stopped were modest.
Participants agreed that the recent tightening in money market conditions indicated that it would soon be appropriate to end balance sheet runoff and that reinvestments of principal payments received on agency securities holdings should be directed into Treasury bills. Various participants highlighted the need to continue to monitor money market conditions. Participants also agreed that a larger share of Treasury bills than the current portfolio allocation would be desirable in the long run. A larger share of Treasury bills would shift the SOMA portfolio composition toward that of Treasury securities outstanding. Many participants indicated that a greater share of Treasury bills could provide the Federal Reserve with more flexibility to accommodate changes in the demand for reserves or changes in nonreserve liabilities and thereby help to maintain an ample level of reserves. Several participants also noted that a greater share of Treasury bills could increase flexibility for future monetary policy accommodation without having to raise the level of reserves. The majority of participants indicated that a larger share of Treasury bills would also reduce Federal Reserve income volatility.
Some participants indicated that during a transition phase, purchases to reach a larger share of Treasury bills in the SOMA portfolio could reduce the availability of short-term Treasury securities to the private sector and potentially affect market functioning. They thus favored a measured approach to purchasing Treasury bills. A couple of other participants noted the absence of market functioning problems in past episodes when purchases focused on Treasury bills. A number of participants noted that the expected pace of paydowns of agency securities in the near term was around only $15 billion to $20 billion per month, and that redirecting these proceeds into Treasury bills once balance sheet runoff ended likely would not adversely affect market functioning.
Overall, most participants favored a long-run composition of the SOMA portfolio that matched the composition of Treasury securities outstanding, indicating that a proportional allocation would provide enough flexibility and may be simpler to communicate. Some participants indicated that they favored a larger-than-proportional share of Treasury bills, citing the benefits of having even greater flexibility than available under a proportional allocation. Various participants noted that it was not necessary to decide on the long-run composition of the SOMA portfolio at this time, as the shift toward a long-run composition would take place over a number of years.
Staff Review of the Economic Situation
The information available at the time of the meeting indicated that growth of real gross domestic product (GDP) had moderated over the first half of the year. Information on the labor market was limited by the federal government shutdown; however, available indicators were consistent with a continued gradual cooling in the labor market without any evidence of a sharp deterioration. Consumer price inflation had moved up since earlier in the year and remained somewhat elevated.
Total consumer price inflation—as measured by the 12-month change in the price index for personal consumption expenditures (PCE)—was estimated to have been 2.8 percent in September based on data from the consumer price index. Core PCE price inflation, which excludes changes in consumer energy prices and many consumer food prices, was also estimated to have been 2.8 percent in September. These estimates implied that total PCE price inflation had risen 0.5 percentage point relative to a year ago and that core PCE inflation was unchanged from its year-earlier rate.
Real GDP posted a strong gain in the second quarter following a decline in the first quarter, although the average increase over the first half of the year was slower than the average pace seen over 2024. Real private domestic final purchases (PDFP)—which comprises PCE and private fixed investment and which often provides a better signal of underlying economic momentum than GDP—had risen faster than GDP over the first half but had also slowed relative to its 2024 rate of increase. PDFP growth appeared to have continued at a solid pace in the third quarter, though the government shutdown had reduced the amount of data that was available to gauge third-quarter economic activity. Available data suggested that net exports positively contributed to GDP growth in the third quarter. After falling sharply in the second quarter and then rising somewhat in July, real imports of goods appeared to have resumed falling in August. U.S. real goods exports appeared to have declined moderately in August after having increased modestly in the first half of the year. The government shutdown was expected to reduce GDP growth for as long as it continued, with a corresponding boost to growth once the government reopened and government production and purchases returned to normal levels.
Recent activity indicators suggested that foreign real GDP growth slowed in the third quarter relative to the first half of the year. Growth in China softened amid fading fiscal stimulus and a persistent property-sector downturn, while indicators in Europe continued to point to subdued activity. Slower foreign growth was driven in part by weaker exports due to reduced U.S. demand and lower investment due to elevated uncertainty, likely reflecting the effects of the U.S. tariffs. Growth in some foreign economies, especially in Mexico and parts of Asia, was supported by continued strong demand for high-tech products, originating primarily from the U.S.
Headline inflation was near central banks' targets in many foreign economies, aided by declines in global energy prices. However, core inflation remained elevated in some economies, notably Brazil, Mexico, and the U.K. By contrast, inflation in China continued to be subdued. In response to lackluster economic activity, some foreign central banks—including the Bank of Canada, the Sveriges Riksbank, and the Bank of Mexico—cut their policy rates further over the intermeeting period.
Staff Review of the Financial Situation
Over the intermeeting period, both the market-implied expected path of the federal funds rate through the end of 2026 and nominal Treasury yields were little changed on net. At short maturities, real yields rose somewhat as measures of inflation compensation decreased amid declines in oil prices. At longer maturities, real yields and inflation compensation were little changed on net.
Broad equity price indexes increased moderately, boosted by technology firms with positive earnings news and AI-related investor optimism. Credit spreads were little changed, on net, and remained very low by historical standards. The one-month option-implied volatility on the S&P 500 index was largely unchanged, on net, and remained near the median of its historical distribution.
Risk appetite in foreign financial markets was generally strong. On net, foreign equity indexes were moderately higher, and technology stocks outperformed in several economies, largely reflecting continued investor optimism regarding AI. Market-based policy expectations and longer-term yields declined in most major advanced foreign economies, in part because of weak economic data. By contrast, yields in Japan rose amid political developments that led to expectations for increased fiscal spending. The broad dollar index increased modestly, primarily driven by the relative strength of U.S. economic data.
Conditions in U.S. short-term funding markets tightened materially over the intermeeting period but remained orderly. Late in the period, the spread between the EFFR and the IORB reached the narrowest level since the runoff of the Federal Reserve's balance sheet began in 2022. The Secured Overnight Financing Rate occasionally printed above the minimum bid rate at the SRF, and SRF take-up occurred on several days. The average usage of the ON RRP facility fell to its lowest level since 2021. Taken together, these developments suggested that reserve balances were moving closer to ample levels.
In domestic credit markets, borrowing costs of businesses, households, and municipalities remained significantly lower than the highs observed in 2023 but elevated relative to their average post–Global Financial Crisis levels. Yields on corporate bonds and leveraged loans edged down. Rates on 30-year fixed-rate conforming residential mortgages were little changed on net. Yields on commercial mortgage-backed securities (CMBS) moved up modestly. Interest rates on credit card accounts edged up a touch in August.
Credit remained generally available but relatively tight for small businesses. Issuance of corporate bonds, leveraged loans, and private credit was robust in recent months. Core loans on banks' books continued to increase in the third quarter, driven primarily by strong growth in commercial and industrial (C&I) lending. In the residential mortgage market, credit remained easily available for high-credit-score borrowers but less so for low-score borrowers. Consumer credit remained generally available for most households.
Banks in the October Senior Loan Officer Opinion Survey on Bank Lending Practices reported, on net, an easing in bank lending conditions on C&I loans for large firms and those with low exposures to international trade. Banks also eased standards for commercial real estate loans, credit cards, and auto loans over the third quarter. The overall level of bank lending standards aggregated across all loan categories was estimated to be around the median level observed since 2011.
Credit quality was generally stable at levels somewhat weaker than during the pre-pandemic period. The credit performance of corporate bonds, leveraged loans, and private credit remained stable. The use of distressed exchanges among leveraged loan borrowers and payment-in-kind interest among private credit borrowers, however, remained elevated. Delinquency rates on small business loans continued to be moderately above pre-pandemic levels, and those on CMBS remained elevated through September. Delinquency rates on most mortgage loan types, by contrast, stayed near historical lows. Credit card delinquency rates inched down in September, while auto loan delinquency rates ticked up, and both rates stood above their pre-pandemic levels.
The staff provided an updated assessment of the stability of the U.S. financial system and, on balance, continued to characterize the system's financial vulnerabilities as notable. The staff judged that asset valuation pressures were elevated. For public equities, price-to-earnings ratios stood at the upper end of their historical distribution. Nonprice indicators, such as the number of newly launched leveraged exchanged-traded products, also reflected high and broad-based investor demand for risky assets.
Vulnerabilities associated with nonfinancial business and household debt were characterized as moderate. Corporate debt grew modestly over the past few years, and household balance sheets remained strong. The rapid growth of private credit moderated somewhat, but recent bankruptcies raised concerns about credit quality and hidden leverage in this market. House prices remained high but flattened out in the past year, and the likelihood of severe distress among mortgage borrowers appeared to be notably lower than following the previous period of elevated house prices, in part because of stronger underwriting standards and near historical highs for homeowners' equity.
Vulnerabilities associated with leverage in the financial sector were characterized as notable. Hedge fund leverage, on average, remained elevated and increased further, driven by both a shift toward more leveraged strategies and an increase in leverage within strategies. Available data suggested that hedge fund exposure to Treasury markets doubled over the past two years. By contrast, banks remained resilient, with high regulatory capital ratios and improved funding structure, although their market-adjusted capital ratios remained depressed and sensitive to long-term interest rates.
Vulnerabilities associated with funding risks were characterized as moderate. The amount of total short-run funding instruments and cash management vehicles as a fraction of GDP grew in recent years but remained in the middle of its historical range. The total market capitalization of stablecoins, some of which may be vulnerable to runs, grew significantly in the past two years.
Staff Economic Outlook
Relative to the forecast prepared for the September meeting, real GDP growth was projected to be modestly stronger, on balance, through 2028, reflecting stronger expected potential output growth and greater projected support from financial conditions. GDP growth after 2025 was expected to remain above potential until 2028 as the drag from higher tariffs waned, with financial conditions becoming a tailwind for spending. As a result, the unemployment rate was expected to decline gradually after this year before flattening out at a level slightly below the staff's estimate of the natural rate of unemployment.
The staff's inflation forecast was broadly similar to the one prepared for the September meeting, with tariff increases expected to put upward pressure on inflation in 2025 and 2026. Thereafter, inflation was projected to return to its previous disinflationary trend.
The staff continued to view the uncertainty around the forecast as elevated, citing a cooling labor market, still-elevated inflation, heightened uncertainty about government policy changes and their effects on the economy, and the limited availability of data caused by the government shutdown. Risks around the employment and GDP forecasts continued to be seen as skewed to the downside, as elevated economic uncertainty and a cooling labor market raised the risk of a sharper-than-expected weakening in labor market conditions and output growth. Risks around the inflation forecast continued to be seen as skewed to the upside, as the elevated levels of some measures of expected inflation and more than four consecutive years of actual inflation above 2 percent raised the possibility that this year's projected rise in inflation would prove to be more persistent than the staff anticipated.
Participants' Views on Current Conditions and the Economic Outlook
In their discussion of inflation, participants observed that overall inflation had moved up since earlier in the year and remained somewhat above the Committee's 2 percent longer-run goal. Participants generally noted that core inflation had remained elevated, as disinflation in housing services had been more than offset by higher goods inflation, reflecting in part the effects of tariff increases implemented earlier in the year. Several participants observed that, setting aside their estimates of tariff effects, inflation was close to the Committee's target. Many participants, however, remarked that overall inflation had been above target for some time and had shown little sign of returning sustainably to the 2 percent objective in a timely manner.
Participants generally expected inflation to remain somewhat elevated in the near term before moving gradually to 2 percent. Several participants pointed to the persistence in core nonhousing services inflation as a factor that may keep overall inflation above 2 percent in the near term. Many participants expected some additional pickup in core goods inflation over the next few quarters, driven in part by further pass-through of tariffs to firms' pricing. Several participants expressed uncertainty about the timing and magnitude of tariff-related price effects, noting that some businesses were reportedly waiting to adjust prices until tariff policies seemed more settled. Drawing on reports from their District contacts, several participants remarked that businesses, including those not directly affected by tariffs, indicated that they planned to raise prices gradually in response to higher tariff-related input costs. A few participants suggested that potential recent productivity gains achieved through automation and AI may help businesses support their profit margins and limit the extent to which cost increases are passed on to consumers. A few participants commented that the softer labor market would likely help keep inflationary pressures in check. A couple of participants noted that recent changes in immigration policies would lessen housing demand and strengthen the disinflation in housing services prices.
Participants generally noted that most measures of short-term inflation expectations had eased somewhat from their peaks earlier in the year and that most survey-based and market-based measures of longer-term inflation have shown little net change since the end of last year, which suggested that longer-term inflation expectations remained well anchored. Participants emphasized the importance of maintaining well-anchored inflation expectations to help return inflation to the Committee's 2 percent objective in a timely manner, and many noted concerns that the prolonged period of above-target inflation could risk an increase in longer-term expectations.
With regard to the labor market, participants observed that the data available before the government shutdown indicated that job gains had slowed this year and that the unemployment rate had edged up but remained low through August. Participants commented on the lack of the Employment Situation report for September during this intermeeting period and reported relying on private-sector and limited government data, as well as information provided by businesses and community contacts, to assess labor market conditions. Participants pointed to recent available indicators, including survey-based measures of job availability, as being consistent with layoffs and hiring having remained low as well as a labor market that had gradually softened through September and October but had not sharply deteriorated. Participants generally attributed the slowdown in job creation to both reduced labor supply—stemming from lower immigration and labor force participation—and less labor demand amid moderate economic growth and elevated uncertainty. Many participants remarked that structural factors such as investment related to AI and other productivity-enhancing technologies may be contributing to softer labor demand.
Regarding the outlook for the labor market, participants generally expected conditions to soften gradually in coming months and the labor market to remain less dynamic than earlier in the year, with businesses reluctant to add workers but also hesitant to lay off employees. Several participants described the lack of job turnover and hesitancy among businesses to add jobs as adding downside risks to the labor market, noting that a further weakening in labor demand could push the unemployment rate sharply higher. A few participants viewed the rise in the unemployment rates for groups historically more sensitive to cyclical changes in economic activity, or the concentration of job gains in less-cyclical sectors, as signaling potential broader labor market weakness. Some participants noted the apparent divergence between subdued job growth and moderate GDP growth, with several suggesting that this pattern might persist over time as advances in AI boost productivity growth while demographic factors constrain labor supply.
Participants noted that available indicators suggested that economic activity appeared to have been expanding at a moderate pace, although a number of participants observed that the lack of government-provided spending data since the shutdown made it challenging to gauge the more recent strength of overall activity. Participants generally noted that consumer spending had shown signs of firming in recent months after the slowdown observed early in the year. Many participants, however, remarked on a divergence in spending patterns across income groups, noting that consumption growth appeared to be disproportionately supported by higher-income households benefiting from strong equity markets, while lower-income households demonstrated increased price sensitivity and spending adjustments in response to high prices and elevated economic uncertainty. A couple of participants expressed concern about the relatively narrow base of support for consumption growth, noting the potential vulnerability should high-income consumer spending weaken. A couple of participants mentioned continued weakness in the housing market, despite some recent signs of stabilization, and that housing-affordability challenges remained a significant constraint on the sector.
Regarding the business sector, many participants highlighted strong investment in technology, particularly spending related to AI and data centers. Some participants suggested that those investments could boost productivity and thus aggregate supply. A few participants noted that lower business taxes or further expected easing in government regulations would likely support business activity and productivity growth over time. Some participants remarked that financial conditions were supportive of economic activity. A few participants mentioned the persistent headwinds facing the agricultural sector from compressed profit margins due to low crop prices, elevated input costs, and retrenched demand from abroad.
Participants generally judged that uncertainty about the economic outlook remained elevated. Participants saw risks to both sides of the Committee's dual mandate, with many indicating that downside risks to employment had increased since earlier in the year, as the unemployment rate ticked up and the pace of job gains slowed, leaving the labor market more susceptible to any negative shock. Many participants continued to see upside risks to their inflation outlook, pointing to the possibility that elevated inflation could prove more persistent than currently expected even after the effects of this year's tariff increases fade. A few participants remarked on the risk that trade tensions could disrupt global supply chains and weigh on overall economic activity. Many participants observed that the divergence between solid economic growth and weak job creation created a particularly challenging environment for policy decisions, requiring careful monitoring of incoming data to distinguish between cyclical weakness and structural changes in the relationship between output and employment. When discussing uncertainty, various participants expressed concern about the potential effect of a prolonged government shutdown, both on near-term economic activity and on the ability to accurately assess economic conditions because of limitations to the availability of federal government data. Several participants, however, remarked that other private and public indicators, as well as information in the Beige Book and obtained from District contacts, continued to provide useful signals about economic conditions.
In their discussion of financial stability, a number of participants pointed to some recent failures of firms involved in nonbank credit activity. These participants suggested that there were various reasons for concern about developments in the private credit sector, which included risks related to loan quality, the sector's funding practices, poor underwriting and collateral practices, banks' exposure to the sector, and the possibility of the transmission of strains in the sector to the real economy. A few participants noted that recent years' growth in private credit was an example of traditional financial activity moving outside the existing U.S. regulatory framework. Some participants commented on stretched asset valuations in financial markets, with several of these participants highlighting the possibility of a disorderly fall in equity prices, especially in the event of an abrupt reassessment of the possibilities of AI-related technology. A couple of participants cited risks associated with high levels of corporate borrowing.
In their consideration of monetary policy at this meeting, participants noted that inflation had moved up since earlier in the year and remained somewhat elevated. Participants further noted that available indicators suggested that economic activity had been expanding at a moderate pace. They observed that job gains had slowed this year and that the unemployment rate had edged up but remained low through August. Participants assessed that more recent indicators were consistent with these developments. In addition, they judged that downside risks to employment had risen in recent months. Against this backdrop, many participants were in favor of lowering the target range for the federal funds rate at this meeting, some supported such a decision but could have also supported maintaining the level of the target range, and several were against lowering the target range. Those who favored or could have supported a lowering of the target range for the federal funds rate toward a more neutral setting generally observed that such a decision was appropriate because downside risks to employment had increased in recent months and upside risks to inflation had diminished since earlier this year or were little changed. Those who preferred to keep the target range for the federal funds rate unchanged at this meeting expressed concern that progress toward the Committee's inflation objective had stalled this year, as inflation readings increased, or that more confidence was needed that inflation was on a course toward the Committee's 2 percent objective, while also noting that longer-term inflation expectations could rise should inflation not return to 2 percent in a timely manner. One participant agreed with the need to move toward a more neutral monetary policy stance but preferred a 1/2 percentage point reduction at this meeting. In light of their assessment that reserve balances had reached or were approaching ample levels, almost all participants noted that it was appropriate to conclude the reduction in the Committee's aggregate securities holdings on December 1 or that they could support such a decision.
In considering the outlook for monetary policy, participants expressed a range of views about the degree to which the current stance of monetary policy was restrictive. Some participants assessed that the Committee's policy stance would be restrictive even after a potential 1/4 percentage point reduction in the policy rate at this meeting. By contrast, some participants pointed to the resilience of economic activity, supportive financial conditions, or estimates of short-term real interest rates as indicating that the stance of monetary policy was not clearly restrictive. In discussing the near-term course of monetary policy, participants expressed strongly differing views about what policy decision would most likely be appropriate at the Committee's December meeting. Most participants judged that further downward adjustments to the target range for the federal funds rate would likely be appropriate as the Committee moved to a more neutral policy stance over time, although several of these participants indicated that they did not necessarily view another 25 basis point reduction as likely to be appropriate at the December meeting. Several participants assessed that a further lowering of the target range for the federal funds rate could well be appropriate in December if the economy evolved about as they expected over the coming intermeeting period. Many participants suggested that, under their economic outlooks, it would likely be appropriate to keep the target range unchanged for the rest of the year. All participants agreed that monetary policy was not on a preset course and would be informed by a wide range of incoming data, the evolving economic outlook, and the balance of risks.
In discussing risk-management considerations that could bear on the outlook for monetary policy, participants generally judged that upside risks to inflation remained elevated and that downside risks to employment were elevated and had increased since the first half of the year. Many participants agreed that the Committee should be deliberate in its policy decisions against the backdrop of these two-sided risks and reduced availability of key economic data. Most participants suggested that, in moving to a more neutral policy stance, the Committee was helping forestall the possibility of a major deterioration in labor market conditions. Many of these participants also judged that, with more evidence having accumulated that the effect on overall inflation of this year's higher tariffs would likely be limited, it was appropriate for the Committee to ease its policy stance in response to downside risks to employment. Most participants noted that, against a backdrop of elevated inflation readings and a very gradual cooling of labor market conditions, further policy rate reductions could add to the risk of higher inflation becoming entrenched or could be misinterpreted as implying a lack of policymaker commitment to the 2 percent inflation objective. Participants judged that a careful balancing of risks was required and agreed on the importance of well-anchored longer-term inflation expectations in achieving the Committee's dual-mandate objectives.
Committee Policy Actions
In their discussions of monetary policy for this meeting, members agreed that available indicators suggested that economic activity had been expanding at a moderate pace. They also agreed that job gains had slowed this year and that the unemployment rate had edged up but remained low through August. Members observed that more recent indicators were consistent with these developments. They noted that inflation had moved up since earlier in the year and remained somewhat elevated. They agreed that the Committee was attentive to the risks to both sides of its dual mandate and that downside risks to employment had risen in recent months.
In support of the Committee's goals and in light of the shift in the balance of risks, almost all members decided to lower the target range for the federal funds rate by 1/4 percentage point to 3-3/4 to 4 percent. Two members voted against that decision. One of these members preferred to lower the target range 1/2 percentage point, while the other member preferred to leave the target range unchanged. Almost all members agreed to conclude the reduction of the Committee's securities holdings on December 1. One member who voted against the Committee's policy rate decision at the meeting also preferred an immediate end to balance sheet runoff. Members agreed that, in considering additional adjustments to the target range for the federal funds rate, the Committee would carefully assess incoming data, the evolving outlook, and the balance of risks. All members agreed that the postmeeting statement should affirm their strong commitment both to supporting maximum employment and to returning inflation to the Committee's 2 percent objective.
Members agreed that, in assessing the appropriate stance of monetary policy, the Committee would continue to monitor the implications of incoming information for the economic outlook. They would be prepared to adjust the stance of monetary policy if risks emerged that could impede the attainment of the Committee's goals. Members also agreed that their assessments would take into account a wide range of information, including readings on labor market conditions, inflation pressures and inflation expectations, and financial and international developments.
At the conclusion of the discussion, the Committee voted to direct the Federal Reserve Bank of New York, until instructed otherwise, to execute transactions in the SOMA in accordance with the following domestic policy directive, for release at 2:00 p.m.:
"Effective October 30, 2025, the Federal Open Market Committee directs the Desk to:
- Undertake open market operations as necessary to maintain the federal funds rate in a target range of 3-3/4 to 4 percent.
- Conduct standing overnight repurchase agreement operations with a minimum bid rate of 4.0 percent and with an aggregate operation limit of $500 billion.
- Conduct standing overnight reverse repurchase agreement operations at an offering rate of 3.75 percent and with a per-counterparty limit of $160 billion per day.
- Roll over at auction the amount of principal payments from the Federal Reserve's holdings of Treasury securities maturing in October and November that exceeds a cap of $5 billion per month. Redeem Treasury coupon securities up to this monthly cap and Treasury bills to the extent that coupon principal payments are less than the monthly cap. Beginning on December 1, roll over at auction all principal payments from the Federal Reserve's holdings of Treasury securities.
- Reinvest the amount of principal payments from the Federal Reserve's holdings of agency debt and agency mortgage-backed securities (MBS) received in October and November that exceeds a cap of $35 billion per month into Treasury securities to roughly match the maturity composition of Treasury securities outstanding. Beginning on December 1, reinvest all principal payments from the Federal Reserve's holdings of agency securities into Treasury bills.
- Allow modest deviations from stated amounts for reinvestments, if needed for operational reasons."
The vote also encompassed approval of the statement below for release at 2:00 p.m.:
"Available indicators suggest that economic activity has been expanding at a moderate pace. Job gains have slowed this year, and the unemployment rate has edged up but remained low through August; more recent indicators are consistent with these developments. Inflation has moved up since earlier in the year and remains somewhat elevated.
The Committee seeks to achieve maximum employment and inflation at the rate of 2 percent over the longer run. Uncertainty about the economic outlook remains elevated. The Committee is attentive to the risks to both sides of its dual mandate and judges that downside risks to employment rose in recent months.
In support of its goals and in light of the shift in the balance of risks, the Committee decided to lower the target range for the federal funds rate by 1/4 percentage point to 3-3/4 to 4 percent. In considering additional adjustments to the target range for the federal funds rate, the Committee will carefully assess incoming data, the evolving outlook, and the balance of risks. The Committee decided to conclude the reduction of its aggregate securities holdings on December 1. The Committee is strongly committed to supporting maximum employment and returning inflation to its 2 percent objective.
In assessing the appropriate stance of monetary policy, the Committee will continue to monitor the implications of incoming information for the economic outlook. The Committee would be prepared to adjust the stance of monetary policy as appropriate if risks emerge that could impede the attainment of the Committee's goals. The Committee's assessments will take into account a wide range of information, including readings on labor market conditions, inflation pressures and inflation expectations, and financial and international developments."
Voting for this action: Jerome H. Powell, Chair; John C. Williams, Vice Chair; Michael S. Barr; Michelle W. Bowman; Susan M. Collins; Lisa D. Cook; Austan D. Goolsbee; Philip N. Jefferson; Alberto G. Musalem; and Christopher J. Waller.
Voting against this action: Stephen I. Miran, who preferred to lower the target range for the federal funds rate by 1/2 percentage point at this meeting, and Jeffrey R. Schmid, who preferred no change to the target range for the federal funds rate at this meeting.
Consistent with the Committee's decision to lower the target range for the federal funds rate to 3-3/4 to 4 percent, the Board of Governors of the Federal Reserve System voted unanimously to lower the interest rate paid on reserve balances to 3.90 percent, effective October 30, 2025. The Board of Governors of the Federal Reserve System voted unanimously to approve a 1/4 percentage point decrease in the primary credit rate to 4.0 percent, effective October 30, 2025.3
It was agreed that the next meeting of the Committee would be held on Tuesday–Wednesday, December 9–10, 2025. The meeting adjourned at 10:20 a.m. on October 29, 2025.
Notation Vote
By notation vote completed on October 7, 2025, the Committee unanimously approved the minutes of the Committee meeting held on September 16–17, 2025.
Attendance
Jerome H. Powell, Chair
John C. Williams, Vice Chair
Michael S. Barr
Michelle W. Bowman
Susan M. Collins
Lisa D. Cook
Austan D. Goolsbee
Philip N. Jefferson
Stephen I. Miran
Alberto G. Musalem
Jeffrey R. Schmid
Christopher J. Waller
Beth M. Hammack, Neel Kashkari, Lorie K. Logan, Anna Paulson, and Sushmita Shukla, Alternate Members of the Committee
Thomas I. Barkin, Raphael W. Bostic, and Mary C. Daly, Presidents of the Federal Reserve Banks of Richmond, Atlanta, and San Francisco, respectively
Joshua Gallin, Secretary
Matthew M. Luecke, Deputy Secretary
Brian J. Bonis, Assistant Secretary
Michelle A. Smith, Assistant Secretary
Mark E. Van Der Weide, General Counsel
Richard Ostrander, Deputy General Counsel
Trevor A. Reeve, Economist
Stacey Tevlin, Economist
Beth Anne Wilson, Economist
Brian M. Doyle, Carlos Garriga, Joseph W. Gruber, and William Wascher, Associate Economists
Roberto Perli, Manager, System Open Market Account
Julie Ann Remache, Deputy Manager, System Open Market Account
Daniel Aaronson, Interim Director of Research, Federal Reserve Bank of Chicago
Stephanie R. Aaronson, Senior Associate Director, Division of Research and Statistics, Board
Jose Acosta, Senior System Engineer II, Division of Information Technology, Board
Roc Armenter, Executive Vice President, Federal Reserve Bank of Philadelphia
Alyssa Arute,4 Assistant Director, Division of Reserve Bank Operations and Payment Systems, Board
Alessandro Barbarino, Special Adviser to the Board, Division of Board Members, Board
Julia Barmeier,4 Lead Financial Institution Policy Analyst, Division of Reserve Bank Operations and Payment Systems, Board
William F. Bassett, Senior Associate Director, Division of Financial Stability, Board
Jose Berrospide, Assistant Director, Division of Financial Stability, Board
Paola Boel, Vice President, Federal Reserve Bank of Cleveland
Erik Bostrom,4 Senior Financial Institution Policy Analyst I, Division of Monetary Affairs, Board
David Bowman,4 Senior Associate Director, Division of Monetary Affairs, Board
Nina Boyarchenko, Financial Research Advisor, Federal Reserve Bank of New York
Falk Braeuning, Vice President, Federal Reserve Bank of Boston
Christian V. Cabanilla,4 Policy Advisor, Federal Reserve Bank of New York
Michele Cavallo, Special Adviser to the Board, Division of Board Members, Board
Kathryn B. Chen,4 Director of Cross Portfolio Policy and Analysis, Federal Reserve Bank of New York
Andrew Cohen,5 Special Adviser to the Board, Division of Board Members, Board
Stephanie E. Curcuru, Deputy Director, Division of International Finance, Board
Marnie Gillis DeBoer,6 Senior Associate Director, Division of Monetary Affairs, Board
Anthony M. Diercks, Principal Economist, Division of Monetary Affairs, Board
Cynthia L. Doniger,4 Principal Economist, Division of Monetary Affairs, Board
Burcu Duygan-Bump, Associate Director, Division of Research and Statistics, Board
Giovanni Favara, Deputy Associate Director, Division of Monetary Affairs, Board
Laura J. Feiveson,7 Special Adviser to the Board, Division of Board Members, Board
Erin E. Ferris,4 Principal Economist, Division of Monetary Affairs, Board
Andrew Figura, Associate Director, Division of Research and Statistics, Board
Aaron Flaaen, Principal Economist, Division of International Finance, Board
Glenn Follette, Associate Director, Division of Research and Statistics, Board
Greg Frischmann, Senior Special Counsel, Legal Division, Board; Special Adviser to the Board, Division of Board Members, Board
Jamie Grasing,4 Senior Data Engineer, Division of Monetary Affairs, Board
Brian Greene,4 Associate Director, Federal Reserve Bank of New York
James Hebden, Principal Economic Modeler, Division of Monetary Affairs, Board
Valerie S. Hinojosa, Section Chief, Division of Monetary Affairs, Board
Matteo Iacoviello, Senior Associate Director, Division of International Finance, Board
Jane E. Ihrig, Special Adviser to the Board, Division of Board Members, Board
Sebastian Infante,4 Section Chief, Division of Monetary Affairs, Board
Benjamin K. Johannsen, Assistant Director, Division of Monetary Affairs, Board
Callum Jones, Principal Economist, Division of Monetary Affairs, Board
Michael T. Kiley, Deputy Director, Division of Monetary Affairs, Board
Elizabeth Klee, Deputy Director, Division of Monetary Affairs, Board
Michael Koslow,4 Associate Director, Federal Reserve Bank of New York
Anna R. Kovner, Executive Vice President, Federal Reserve Bank of Richmond
Seung Kwak, Senior Economist, Division of Monetary Affairs, Board
Britt Leckman,8 Federal Reserve Board Staff Photographer, Division of Board Members, Board
Andreas Lehnert, Director, Division of Financial Stability, Board
Eric B. Lewin,4 Assistant General Counsel, Federal Reserve Bank of New York
Kurt F. Lewis, Special Adviser to the Chair, Division of Board Members, Board
Laura Lipscomb, Special Adviser to the Board, Division of Board Members, Board
Byron Lutz, Deputy Associate Director, Division of Research and Statistics, Board
Dina Tavares Marchioni,9 Director of Money Markets, Federal Reserve Bank of New York
Benjamin W. McDonough, Deputy Secretary and Ombudsman, Office of the Secretary, Board
Alisdair G. McKay, Monetary Advisor, Federal Reserve Bank of Minneapolis
Kindra I. Morelock, Information Services Senior Analyst, Division of Monetary Affairs, Board, and Federal Reserve Bank of Chicago
Norman J. Morin, Associate Director, Division of Research and Statistics, Board
David Na,4 Acting Group Manager, Division of Monetary Affairs, Board
Edward Nelson, Senior Adviser, Division of Monetary Affairs, Board
Anna Nordstrom, Head of Markets, Federal Reserve Bank of New York
Caterina Petrucco-Littleton,10 Deputy Associate Director, Division of Consumer and Community Affairs, Board; Special Adviser to the Board, Division of Board Members, Board
Brian Phillips,5 Special Adviser to the Board, Division of Board Members, Board
Eugenio P. Pinto,7 Special Adviser to the Board, Division of Board Members, Board
Christine Repper,11 Manager, Division of Reserve Bank Operations and Payment Systems, Board
William E. Riordan,4 Capital Markets Trading Advisor, Federal Reserve Bank of New York
Samuel Schulhofer-Wohl, Senior Vice President, Federal Reserve Bank of Dallas
Kirk Schwarzbach, Special Assistant to the Board, Division of Board Members, Board
Zeynep Senyuz, Special Adviser to the Board, Division of Board Members, Board
John J. Stevens, Senior Associate Director, Division of Research and Statistics, Board
Mary H. Tian,4 Group Manager, Division of Monetary Affairs, Board
Paula Tkac, Director of Research, Federal Reserve Bank of Atlanta
Annette Vissing-Jørgensen, Senior Adviser, Division of Monetary Affairs, Board
Jeffrey D. Walker,4 Senior Associate Director, Division of Reserve Bank Operations and Payment Systems, Board
Eric Wallerstein, Special Adviser to the Board, Division of Board Members, Board
Daniel Wilson, Vice President, Federal Reserve Bank of San Francisco
Evan Winerman,4 Deputy Associate General Counsel, Legal Division, Board
Emre Yoldas, Deputy Associate Director, Division of International Finance, Board
Filip Zikes, Special Adviser to the Board, Division of Board Members, Board
_______________________
Joshua Gallin
Secretary
1. The Federal Open Market Committee is referenced as the "FOMC" and the "Committee" in these minutes; the Board of Governors of the Federal Reserve System is referenced as the "Board" in these minutes. Return to text
2. The discussion summarized here draws from remarks made by participants during various portions of the meeting, as the agenda did not include a separate policymaker discussion about the SRF. Return to text
3. In taking this action, the Board approved requests to establish that rate submitted by the Board of Directors of the Federal Reserve Banks of Boston, New York, Philadelphia, Richmond, Atlanta, Chicago, Dallas, and San Francisco. The vote also encompassed approval by the Board of Governors of the establishment of a 4.0 percent primary credit rate by the remaining Federal Reserve Banks, effective on October 30, 2025, or the date such Reserve Banks inform the Secretary of the Board of such a request. (Secretary's note: Subsequently, the Federal Reserve Banks of Cleveland, St. Louis, Minneapolis, and Kansas City were informed of the Board's approval of their establishment of a primary credit rate of 4.0 percent, effective October 30, 2025.) Return to text
4. Attended through the discussion of balance sheet issues. Return to text
5. Attended the discussion of economic developments and the outlook. Return to text
6. Attended through the discussion of developments in financial markets and open market operations. Return to text
7. Attended through the discussion of balance sheet issues, and from the discussion of current monetary policy through the end of the meeting. Return to text
8. Attended opening remarks for Tuesday's session only. Return to text
9. Attended through the discussion of economic developments and the outlook. Return to text
10. Attended Wednesday's session only. Return to text
11. Attended Tuesday's session only. Return to text
NFP Preview: BLS Announces No October Report, November Report Delayed to After Fed Meeting. Rate Cut Bets Tumble Further,...
Markets are bracing for the release of September Jobs data from the US now that the US Government shutdown has come to an end. The report comes at a time when US rate cut expectations have fallen significantly since the Fed's October meeting thanks in part to a hawkish Jerome Powell and the lack of official Government data.
Expectations for a rate cut have declined from around 90% ahead of the Fed's October meeting to around 49% at the time of writing, which makes tomorrow's jobs report even more significant. Market participants have been tracking private data releases such as the ADP number which has shown persistent labor market weakness and yet rate cut expectations have continued to fall.
It was confirmed today that the October Jobs report will not be released, while the November report will only be released on December 16, 2025 which is after the December Fed meeting.
This means the Fed will have tomorrow's data only to peruse ahead of the Fed Meeting next month. Rate cut bets have fallen another 13% after the announcement, now down to 36%.
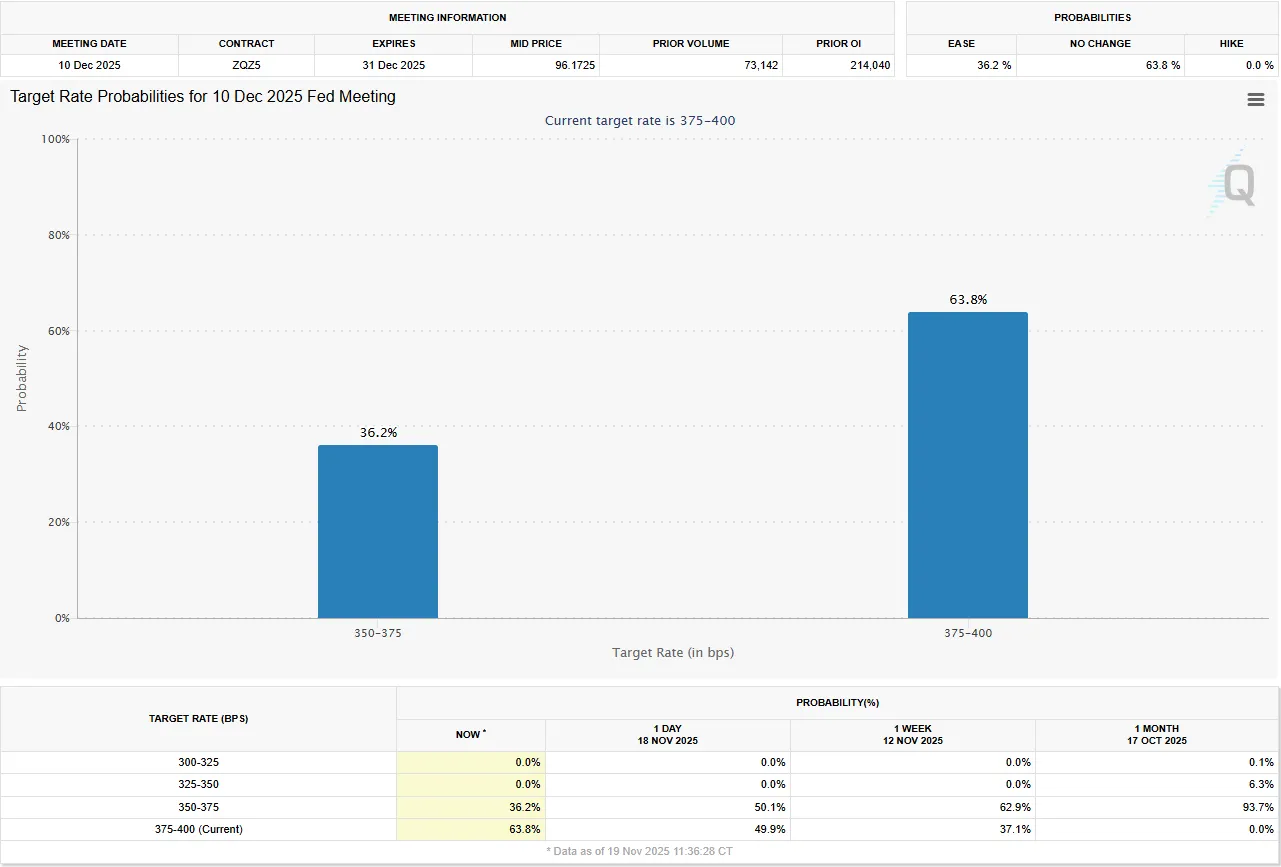
Source: CME FedWatch Tool
NFP Preview: What to Expect
The September monthly jobs report from the Bureau of Labor Statistics (BLS) is finally coming out after the government shutdown. Since the October report might not be released, this September data is a key, possibly one of the last, major pieces of information about the job market before the Federal Reserve (FOMC) meets in December.
Economists and traders generally expect the report to show that the US added about 50,000 new jobs in September, that the average worker's pay increased by 0.3% compared to the month before (or 3.7% year-over-year), and that the main unemployment rate (U3) stayed the same at 4.3%.

For all market-moving economic releases and events, see the MarketPulse Economic Calendar. (click to enlarge)
The Federal Reserve is already in a difficult position heading into tomorrow's data release and market participants will be hoping for more clarity. This would require either a significant beat of expectations which may strengthen the case for no rate cut or a significant miss of expectations which could lead to an increase in rate cut expectations.
This would undoubtedly be the best case scenario as a reading in line with consensus could leave market participants with more questions than answers.
Potential implications for the US Dollar Index (DXY)
The market's reaction to the NFP report will not be uniform, but rather dependent on the deviation from consensus forecasts. These are the potential reactions we could see depending on how the data comes out and is received.

Source: Table Created by Zain Vawda
The US Dollar is at an interesting inflection point with tomorrow's data pivotal to the greenbacks immediate move.
US Dollar Index (DXY)
The US Dollar Index (DXY) is at a critical inflection point having just risen back above the crucial 100.00 level and the 200-day MA.
This is the third time the index has risen above the 100.00 mark for the third time since the end of July. However, the index has failed to gain acceptance above this level with each foray above the level having been met by significant selling pressure.
Immediate resistance rests at 100.61 before the 102.00 handle comes into focus.
Acceptance above the 100.00 mark is needed if the DXY is to continue its advance. The overall trend remains bullish with a daily candle close below 99.20 invalidating the bullish narrative.
US Dollar Index (DXY) Daily Chart, November 19, 2025

Source: TradingView (click to enlarge)
NZDCAD Wave Analysis
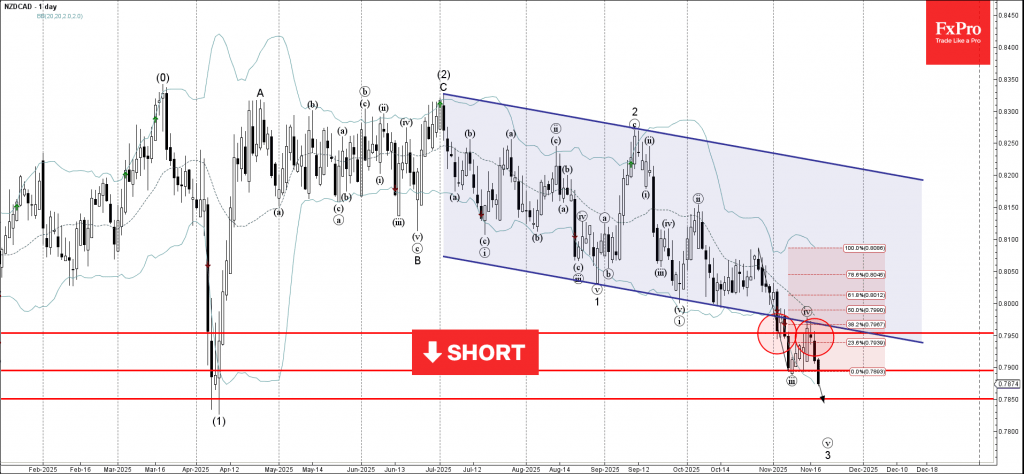
NZDCAD: ⬇️ Sell
- NZDCAD reversed from resistance zone
- Likely to fall to support level 0.7850
NZDCAD currency pair recently reversed down from the resistance zone between the resistance level 0.7950, 20-day moving average and the lower trendline of the recently broken down channel from July.
The downward reversal from this resistance zone accelerated the active impulse wave iii – which belongs to the impulse waves 3 and (3).
Given the clear daily downtrend, NZDCAD currency pair can be expected to fall further to the next support level 0.7850, which reversed the rice sharply in April.