Sample Category Title
Gold Dips in Healthy Correction
Gold prices eased to 4,060 USD per ounce on Wednesday, marking a technical correction following the previous session's gains. Investor caution prevails ahead of a series of high-impact macroeconomic releases, with particular focus on today's FOMC meeting minutes and Thursday's US employment report. These publications are expected to provide crucial insights into the Federal Reserve's future interest rate path.
US agencies have resumed data publication following the government shutdown. Recent figures showed initial jobless claims climbed to a two-month high in mid-October, while continuing claims rose to 1.9 million. This softness in the labour market has modestly bolstered expectations for a December rate cut. However, markets remain wary that stronger subsequent reports could constrain the Fed's ability to ease policy, particularly amid persistent hawkish rhetoric from officials.
A further factor supporting gold is the growing unease over stretched valuations in the technology sector. This is fuelling a mild risk-off sentiment and supporting demand for gold as a safe-haven asset, offsetting some of the metal's recent weakness.
Technical Analysis: XAU/USD
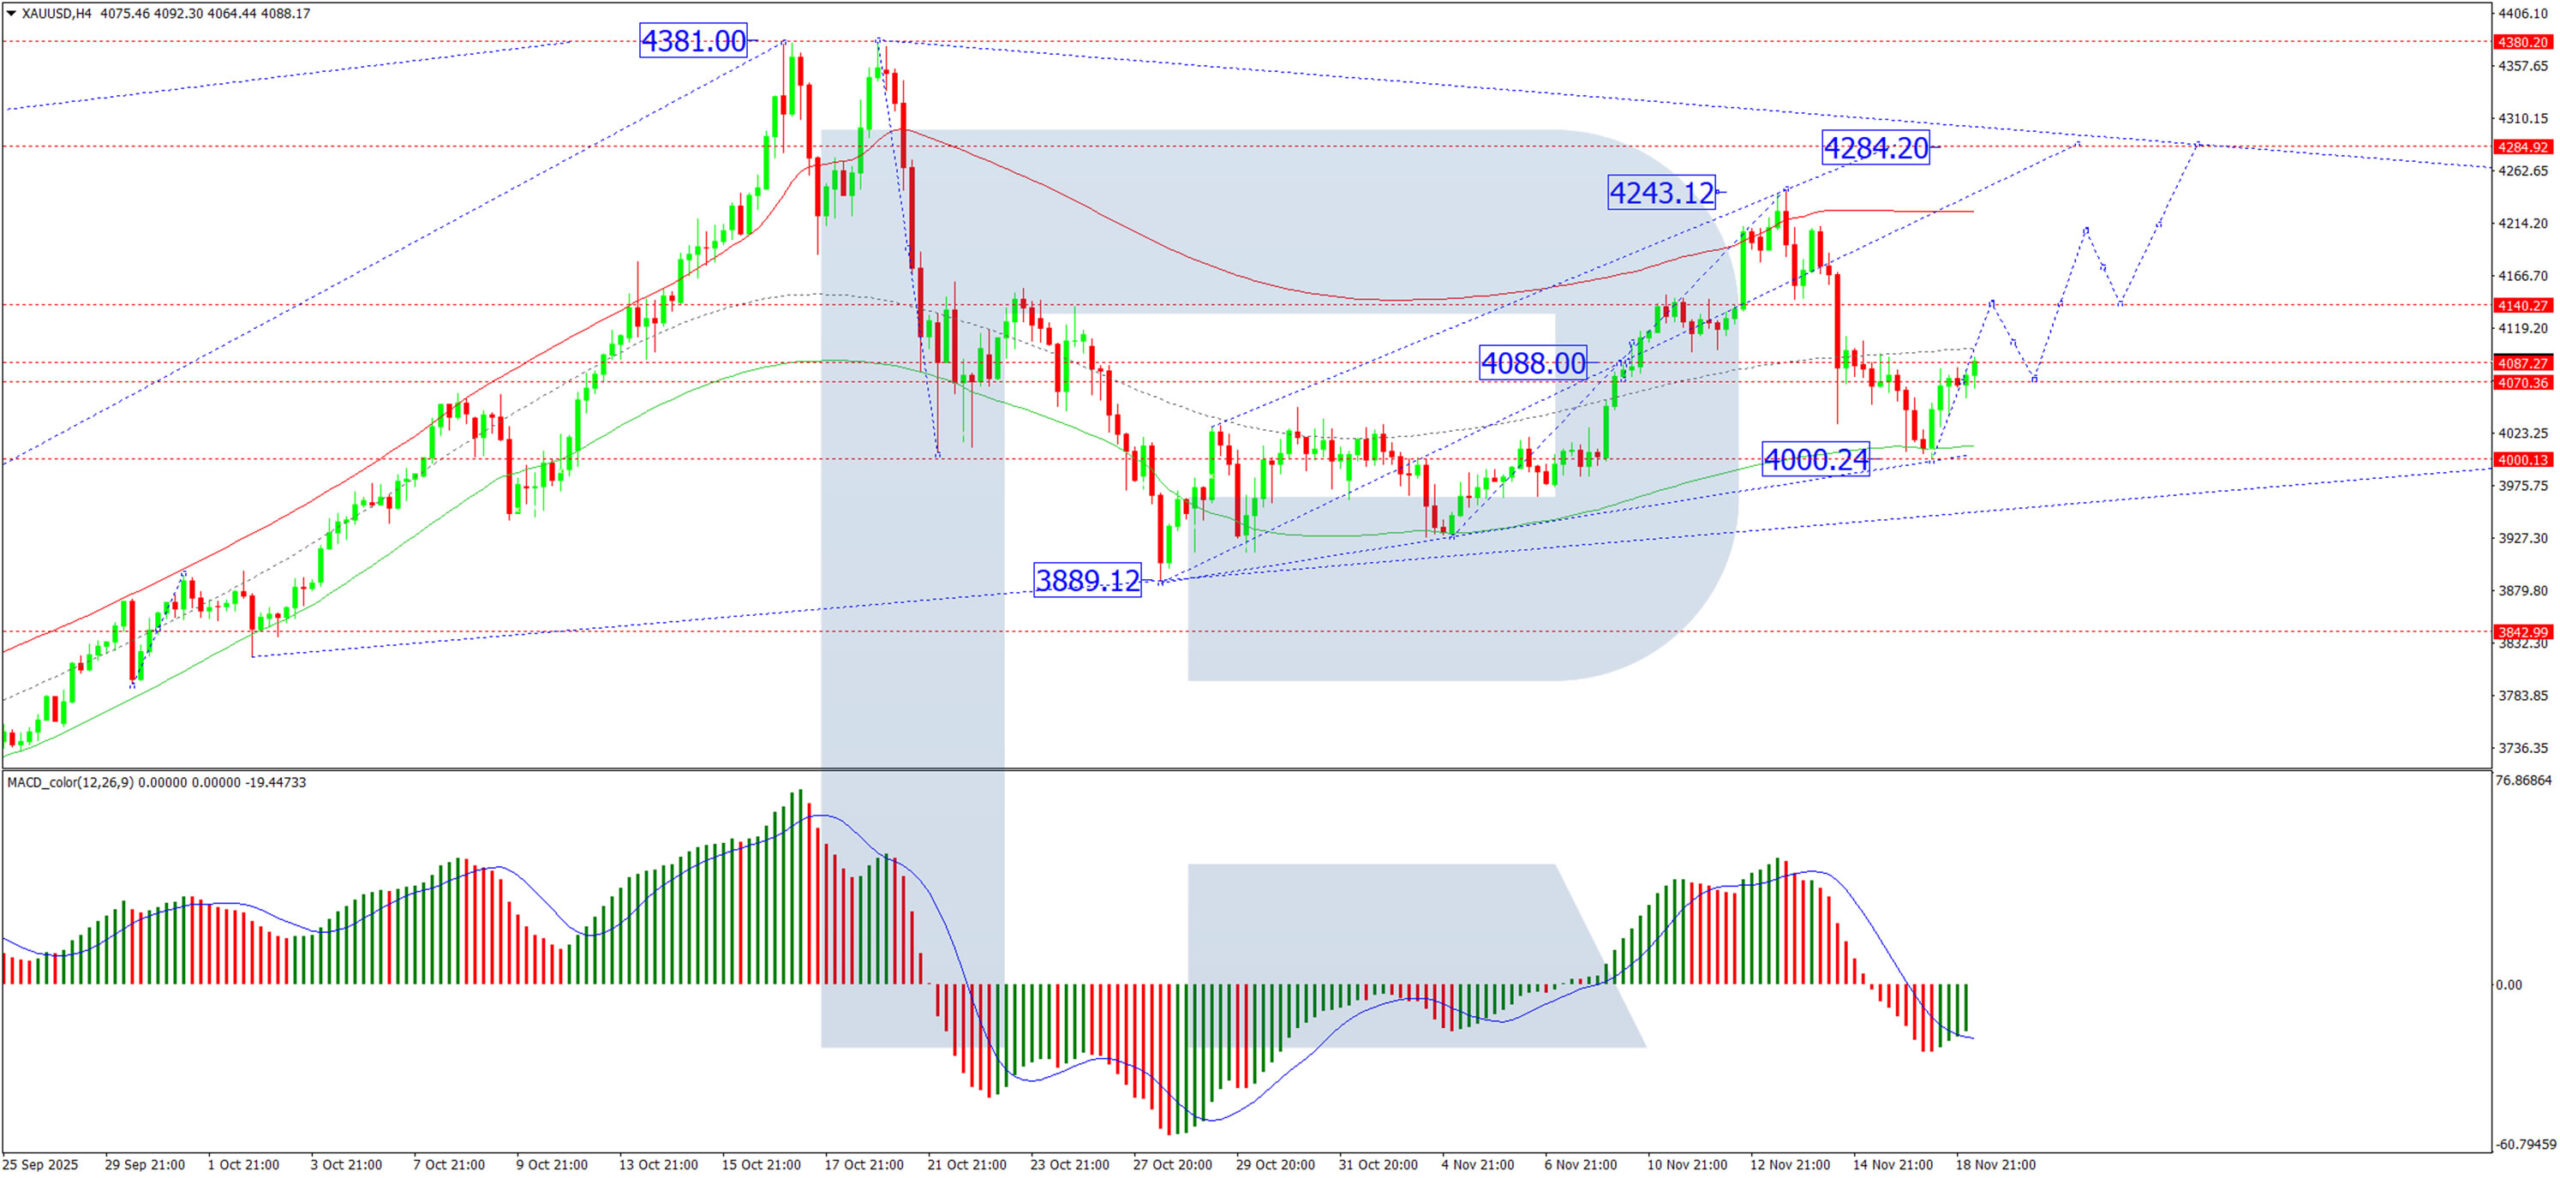
H4 Chart:
On the H4 chart, XAU/USD is forming a consolidation range around 4,060 USD. An upward breakout is anticipated, targeting 4,140 USD as part of a fifth wave within a larger growth structure aiming for 4,284 USD. The MACD indicator supports this constructive view. Its signal line is below zero but has diverged from the histogram and is turning upward, suggesting building bullish momentum.
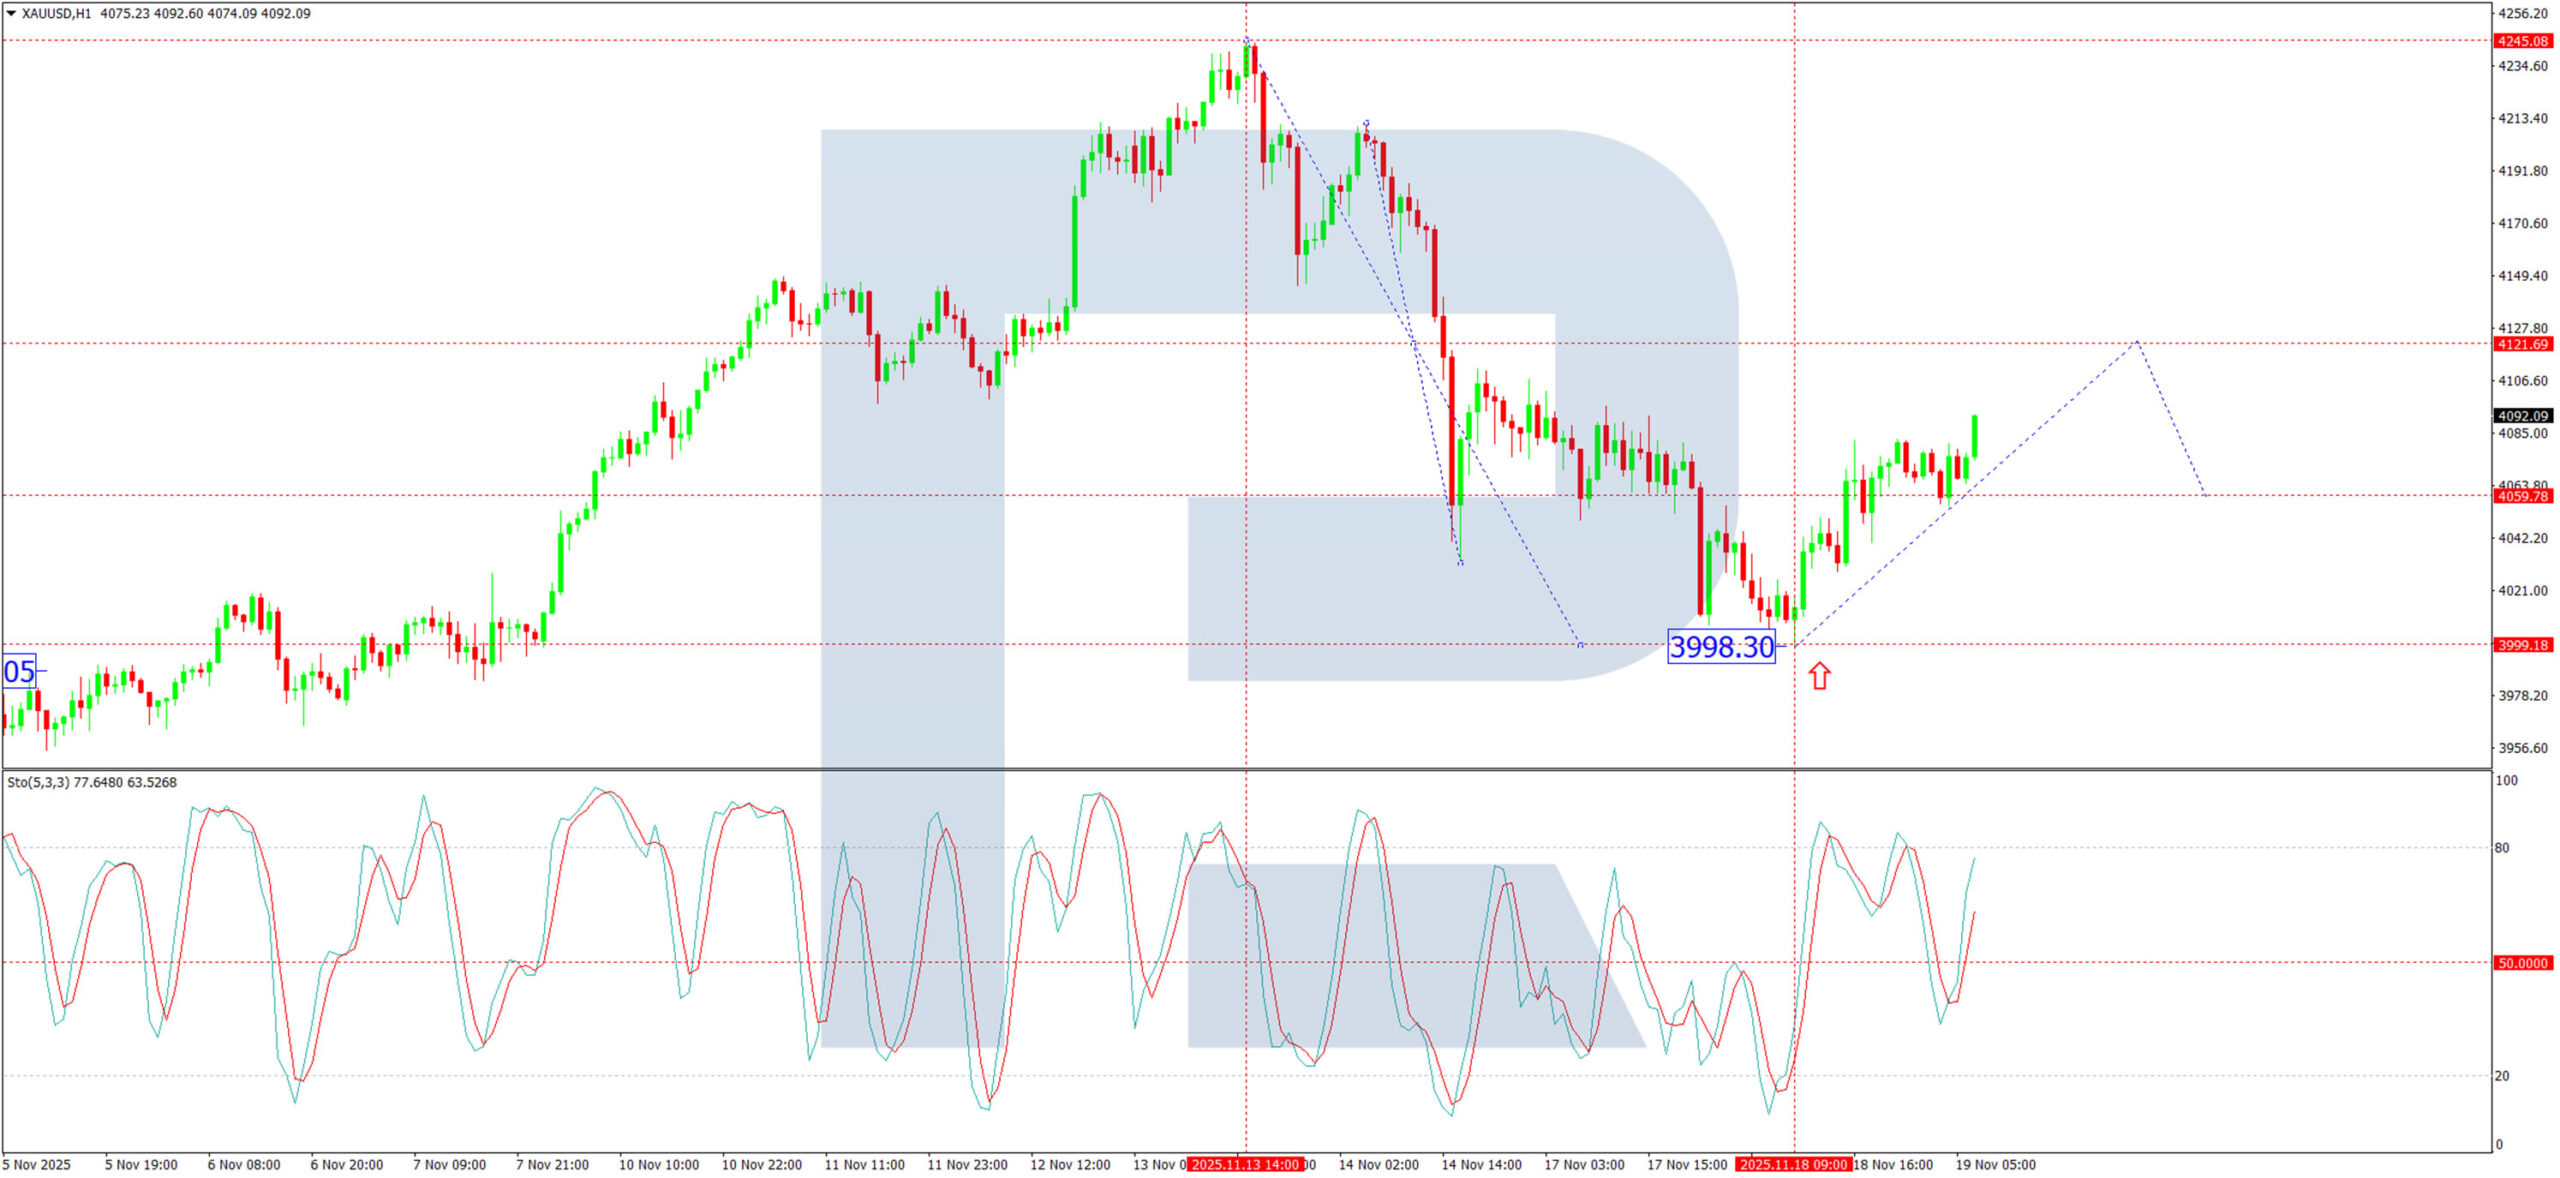
H1 Chart:
On the H1 chart, the market has established a consolidation range around 4,060 USD. With the upper boundary at 4,082 USD now breached, the path is open for the next leg higher. The initial target is 4,122 USD, potentially followed by a corrective pullback to retest 4,060 USD from above. A successful retest could catalyse a further advance towards 4,188 USD and ultimately 4,284 USD. The Stochastic oscillator confirms this near-term bullish bias, with its signal line positioned above 50 and pointing firmly upward.
Conclusion
Gold's current pullback appears corrective within a broader uptrend, driven by cautious positioning ahead of key US data. The technical structure suggests underlying strength, with a clear setup for a potential rally towards 4,284 USD upon a sustained break above 4,082 USD. While the immediate direction hinges on the FOMC minutes and jobs data, the metal's role as a portfolio hedge continues to provide underlying support amidst equity market jitters.
Eurozone CPI finalized at 2.1%, services lead price pressure
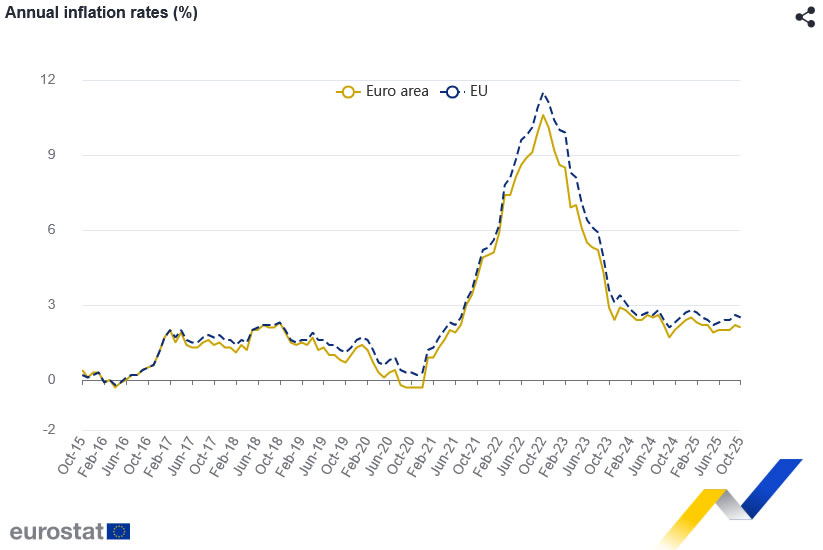
Eurozone CPI was finalized at 2.1% yoy in October, edging down from September’s 2.2% and keeping headline inflation close to the ECB’s target. Core CPI held steady at 2.4% yoy, unchanged from the previous month.
Services remained the dominant driver of inflation in Eurozone, contributing +1.54 percentage points, followed by food, alcohol and tobacco at +0.48 pp, while energy once again exerted a mild drag by -0.08pp.
Across the EU, inflation softened slightly to 2.5% yoy from September’s 2.6%. Price dynamics continued to diverge sharply across member states: Cyprus recorded the lowest annual rate at 0.2%, followed by France (0.8%) and Italy (1.3%). At the other end of the spectrum, Romania remained an outlier at 8.4%, with Estonia (4.5%) and Latvia (4.3%) also posting elevated readings. Compared with the previous month, inflation eased in fifteen member states, held steady in three, and increased in nine.
USD/CAD Falls to November Low
The Canadian dollar has strengthened, influenced by several factors — the most important of which is arguably the easing of domestic political tensions.
According to media reports, Canada’s draft budget has passed its first round of voting. Although several stages of review remain, the result suggests that there are enough votes for the budget to be approved in the end.
Had the draft budget failed to pass, it would almost certainly have resulted in the resignation of Prime Minister Mark Carney and the calling of new parliamentary elections less than a year after the previous ones.
With the risk of political turmoil receding, the Canadian dollar effectively “breathed a sigh of relief”, appreciating against other currencies.
Technical Analysis of the USD/CAD Chart
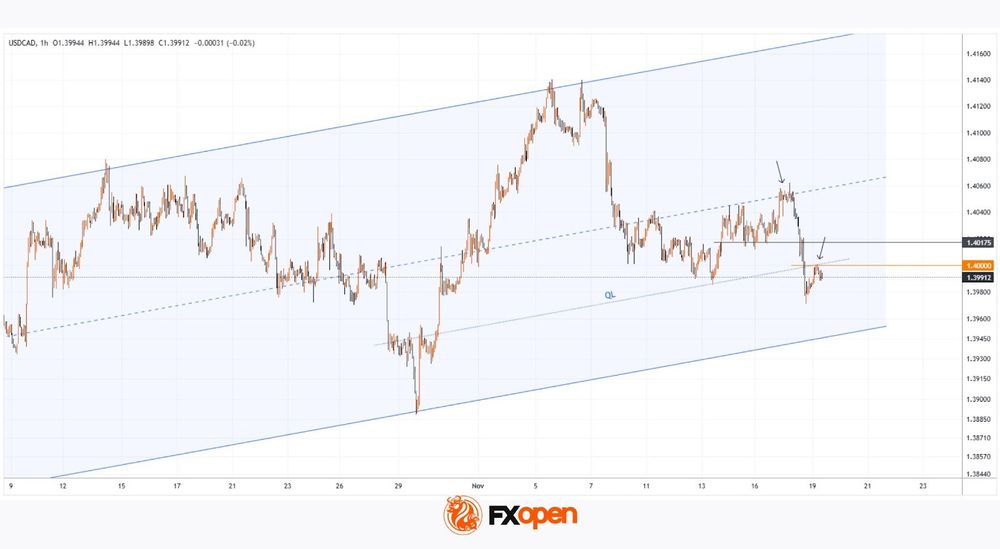
This autumn, movements in the USD/CAD pair have shaped a broad ascending channel. Within this structure:
→ the median line acted as resistance at the start of the week;
→ yesterday’s sharp decline pushed the pair into the lower quarter of the channel, and today the QL line is demonstrating resistance.
This indicates that sellers are currently in control, having:
→ broken through local support at 1.40175;
→ kept the pair below the psychological 1.40000 level.
It is possible that they will attempt to extend this momentum and drive USD/CAD towards the lower boundary of the channel — and if that happens, forex traders may look for opportunities to trade a potential upward reversal from this key support.
Trade over 50 forex markets 24 hours a day with FXOpen. Take advantage of low commissions, deep liquidity, and spreads from 0.0 pips. Open your FXOpen account now or learn more about trading forex with FXOpen.
This article represents the opinion of the Companies operating under the FXOpen brand only. It is not to be construed as an offer, solicitation, or recommendation with respect to products and services provided by the Companies operating under the FXOpen brand, nor is it to be considered financial advice.
Gold Price Slides While WTI Crude Oil Extends Recovery
Gold price extended losses below $4,100 before the bulls appeared. Crude oil price is rising and it could climb further higher toward $62.00.
Important Takeaways for Gold and WTI Crude Oil Prices Analysis Today
- Gold price failed to clear $4,250 and corrected lower against the US Dollar.
- There was a break above a key bearish trend line with resistance at $4,050 on the hourly chart of gold at FXOpen.
- WTI Crude oil prices are moving higher above the $60.00 resistance zone.
- There is a key bullish trend line forming with support near $59.80 on the hourly chart of XTI/USD at FXOpen.
Gold Price Technical Analysis
On the hourly chart of Gold at FXOpen, the price was able to climb above $4,200. The price even broke $4,220 before the bears appeared. The price traded toward $4,245 before there was a fresh decline.
There was a move below $4,200 and $4,100. The price settled below the 50-hour simple moving average, and RSI dipped below 40. Finally, it tested the $4,000 handle. A low was formed at $3,997 and the price is now attempting to recover.
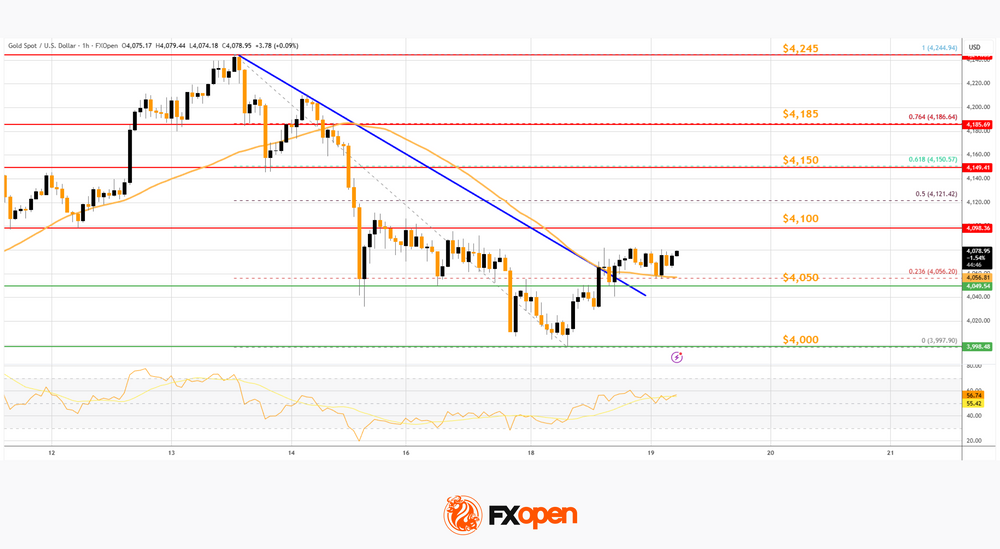
There was a break above a key bearish trend line with resistance at $4,050. The price climbed above the 23.6% Fib retracement level of the downward move from the $4,244 swing high to the $3,997 low.
Immediate resistance on the upside is $4,100. The first major hurdle sits at $4,150 and the 61.8% Fib retracement. A close above $4,150 could initiate a recovery wave to $4,185. An upside break above $4,185 could send Gold price toward $4,250. Any more gains may perhaps set the pace for an increase toward $4,320.
If there is no recovery wave, the price could continue to move down. Initial support on the downside is near the $4,050 level. The first key area of interest might be $4,000. If there is a downside break below $4,000, the price might decline further. In the stated case, the price might drop to $3,880.
WTI Crude Oil Price Technical Analysis
On the hourly chart of WTI Crude Oil at FXOpen, the price started a decent increase from $58.00 against the US Dollar. The price gained bullish momentum after it broke $59.00.
There was a sustained upward movement above $59.50 and $60.00. The bulls pushed the price above the 50-hour simple moving average, and the RSI climbed toward 70. A high was formed near $60.75 before there was a minor pullback.
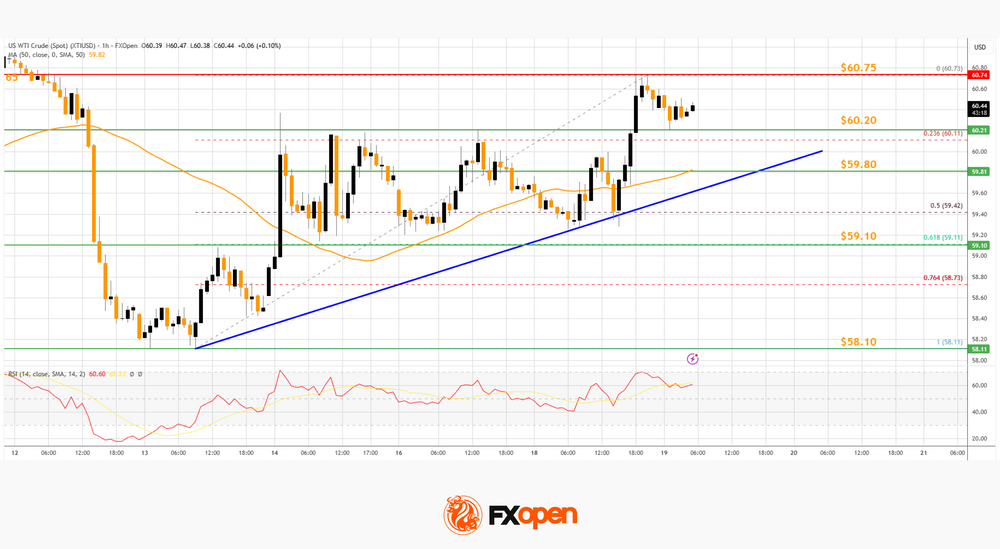
The price declined toward the 23.6% Fib retracement level of the upward move from the $58.11 swing low to the $60.75 high. However, the bulls are active above $60.00. There is also a key bullish trend line forming with support near $59.80.
Immediate resistance is near $60.75 level. If the price climbs further, it could face hurdles near $61.50. The next major stop for the bulls might be $62.20. Any more gain might send the price toward $63.50.
Conversely, the price might correct gains and retest the 50-hour simple moving average or the trend line. The next area of interest on the WTI crude oil chart is near the 61.8% Fib retracement at $59.10. If there is a downside break, the price might decline to $58.10. Any more losses may perhaps open the doors for a move toward $56.50.
Start trading commodity CFDs with tight spreads. Open your trading account now or learn more about trading commodity CFDs with FXOpen.
This article represents the opinion of the Companies operating under the FXOpen brand only. It is not to be construed as an offer, solicitation, or recommendation with respect to products and services provided by the Companies operating under the FXOpen brand, nor is it to be considered financial advice.
Happy Nvidia Day
The day has come, ladies and gentlemen. The biggest — and for some, the most important — company in the world, Nvidia Corporation, is about to reveal its earnings. My crystal ball is whispering that today, after the US closing bell, Nvidia will probably dump another set of jaw-dropping numbers on the table — perhaps a few more billions in sales revenue than the ~$55 billion expected by analysts (which would already be a nearly 60% growth compared to the same time last year) and a gross margin of ideally more than 73%. The company will likely give another stellar guidance and remind everyone that China — once their VIP client — doesn’t even matter in their forecast as much as it did before. CEO Jensen Huang wants investors to assume that the Chinese revenue will be zero. Anything on top of that would be the cherry on top.
But what my crystal ball doesn’t tell is how investors will react. Everyone is now focused on the worries that the huge spending its too high compared to revenue potential, and on the rising anxiety around the circularity of AI deals. Another one just dropped yesterday between Nvidia, Microsoft and Anthropic. The former two will invest a combined $15bn into Anthropic, and the latter will buy computing power from Microsoft’s Azure that – in turn - will be powered by Nvidia chips. Told like this, the whole AI thing does sound like nothing more than a handful of companies sending each other billions of dollars without hints of money flowing inside the circle from outside. But it’s like Mc Donalds buying beef and tomatoes for its burgers. It must do it. Eventually someone will buy the burger. But when, and how much burger is to be seen.
Add to that the fact that Japanese yields are now at levels where Japanese investors prefer bringing their money back to Japan. The 10-year Japanese government bond yield surpassed levels where borrowing yen and placing it in US Treasuries makes no money— after taking FX hedging costs into account. As a result, the Japanese pensions funds are reportedly pulling $1.1 trillion out of the US Treasuries right now – meaning that one of the biggest Treasury buyers is turning into a net seller. In plain English, the Japs may be pulling the rug from under the US Treasury market – that also affects riskier investments like tech, EM stocks and crypto. So maybe we will simply blame the Japanese if the Bank of Japan BoJ) dares hiking rates come December... and that Santa remains stuck somewhere where there’s still snow this Xmas.
But on a more optimistic note, I don’t think the BoJ will gather enough courage to move rates higher. Provided the stress in JGBs, the BoJ Team certainly sees that a rate hike could trigger a budget-crisis scenario akin to what we saw with Liz Truss in the UK. And a severe earthquake in the JGB markets would then trigger a tsunami across global financial markets.
So, if markets don’t turn risk-on after Jensen Huang pushes the ‘on’ button tonight, it may be time for a 10-20% correction. And of course, some love adding fuel to the fire saying that current Big Tech valuations are based on a US 10-year yield of around 2% — continuously — and so if someone comes out and says ‘the emperor is naked’ and the new 10-year benchmark is say nearer 3.5%, valuations could take a 30-40% hit. It’s simple math: many favourite tech stocks trade 25-35 times their earnings. A readjustment of the discount rate could compress them to 18-22 times. So, either your price falls 30-40% or earnings grow strong enough to counteract the higher discount rate. But it’s not that simple.
A month ago — when AI deals were flying in the air — your average tech investor would rather see earnings grow fast enough to neutralise the impact of higher US yields. Today, all they worry about is rising debt. And debt smells worse when borrowing costs mount… The mounting anxiety is pushing credit default spreads to levels some compare to banks just before the sub-prime crisis — with CoreWeave, Tesla, Inc. and Oracle Corporation occupying the top positions in the list of companies most expensive to hedge against default in the next half-decade.
But it’s crazy we went from “AI is everything we always dreamed of” to “this is a worthless bubble” and “screw you OpenAI.” But I can tell you: when an outage at Cloudflare disrupted OpenAI yesterday, and my ChatGPT gave a message saying that I should ‘unblock challenges.cloudflare.com to proceed,’ I didn’t know where to go, what to do, who to ask — a small reminder that when ChatGPT is now around, it doesn’t feel the same.
So, reason tells me there should be a midway between these two extremes — relentless rally and that 30-40% meltdown. Nvidia and other chip companies will certainly continue to sell their chips and grow their fortune; tech companies will continue to develop their AI models, rent data-centres and sell their products to companies outside the tech buddies— say healthcare, banks, hairdressers, tax-offices, McDonalds and anything you could think of. Some will fail. Others will survive. And those who survive will eventually see revenue flow in. Someone will buy the burger.
As for spending, it will level out when the first booming phase is over. Maybe there will be a financial crisis before we get to the safer side of the bridge, but eventually the world will survive. If not, robots will come to the rescue. And while this happens, central banks will be there to temper any potential crisis and print money.
Stay well. Think positive — and maybe keep an eye on the Federal Reserve minutes — just in case!
Cautious Markets Eye FOMC Minutes and NVIDIA Report
In focus today
In the euro area, focus turns to the final HICP inflation data for October. We expect the final print to confirm the flash release of 2.1% y/y headline inflation and 2.4% y/y core inflation.
In the US, the minutes from FOMC's October meeting could gather more attention, given the notably diverse views expressed by Fed speakers recently and the recent hawkish tilt in Fed communication. This shift has turned the December rate cut pricing back into essentially a coin flip. We still call for unchanged policy rates in the US at next month's meeting.
NVIDIA's earnings report is set for release, serving as a crucial test of the sustainability of this year's rally in AI-related stocks, particularly as most heavyweight tech stocks have faced increasing pressure. While the surge has captured investor enthusiasm, concerns about stretched valuations and potential signs of a bubble persist. Meanwhile, market sentiment remains cautious as US equities continue their longest losing streak since August.
In the UK, October inflation data is released. It will be very interesting to see whether softer inflation is now the trend or the September print was a fluke. Following weaker labour market data and growth, a December cut from the Bank of England is looking increasingly likely.
Overnight, China will announce its Loan Prime Rates, which normally are only changed to following adjustments to the PBOC's repo rates, which have remained unchanged for some time. As a result, the loan rates are expected to remain unchanged as well. However, we anticipate rate cuts in the coming months, as recent indicators suggest the domestic economy has been losing momentum.
Economic and market news
What happened yesterday
In the US, the ADP's new weekly employment growth, 'pulse', showed that private employers shed an average of 2.5k jobs a week for the four-week average ending 1 November, an improvement from last week's -11k ADP 'pulse'. Although this suggests sluggish job growth with modestly improving momentum, it is unlikely to change much for broader markets.
The Labor Department reported US jobless claims at 232k for the week ending 18 October, closely aligning with estimates based on state-level data. The partial figure was released due to a technical issue, with a department spokesperson confirming to Reuters that the full data series will become available on 20 November.
In Hungary, the central bank (MNB) held its key rate steady at 6.50%, with the monetary council highlighting the importance of a 'careful and patient approach to monetary policy' amid persistent risks tied to elevated inflation, trade policy, and geopolitical tensions.
Equities: Global equities had another weak session yesterday, falling 1.1%, when looking at face value, but underneath the surface it was a healthy rotation into defensives. Energy, healthcare and consumer staples ended the day in the green, while tech stocks declined 1.7%, and consumer discretionary names also suffered. Although the initial reaction to the large capex plans highlighted during the Q3 earnings season was positive, markets now seem to be reassessing the likelihood and implications of those investments, taking tech stocks 8% down since its late October peak. Over the past five trading sessions, cyclicals have underperformed defensives by around 4%, with attention increasingly shifting toward value stocks as well. The S&P 500 fell 0.8%, the NASDAQ dropped 1.2%, while the Russell 2000 was marginally higher at +0.3%. Overnight, Asian equities traded mixed to negative.
FI and FX: The Dollar caught a slight bid yesterday, with EUR/USD trading just below 1.16. Scandies traded to the weaker side through the first half of yesterday's session before turning around in the afternoon with both EUR/NOK and EUR/SEK closing 4-5 figures lower from intraday highs. The sour risk sentiment, with US equities extending their longest losing streak since August, benefitted bonds, with both Treasuries and Bunds trading lower across the curve. Meanwhile, SEK swap rates outperformed EUR yesterday, at the same time as 3-4bp of hikes for 2026 got stripped of, to an accumulated +10bp.
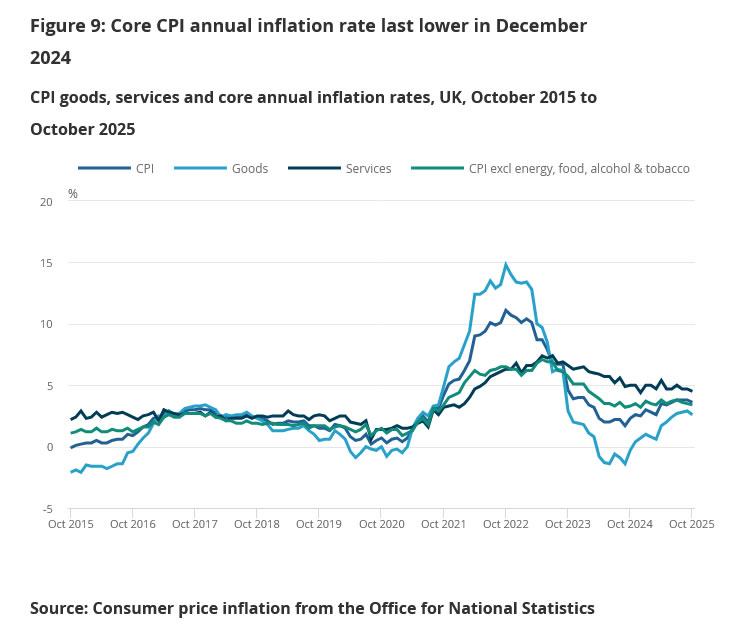
UK CPI slows to 3.6%, keeping BoE on track for December cut
UK inflation eased in October, with headline CPI slowing from 3.8% yoy to 3.6%, just above the market’s 3.5% forecast. Core inflation (excluding energy, food, alcohol and tobacco) matched expectations at 3.4% yoy, down from 3.5% previously.
Goods inflation cooled, slipping from 2.9% yoy to 2.6%, while services inflation—still the stickiest component—eased from 4.7% to 4.5%.
On a monthly basis, headline CPI rose 0.4% mom.
The figures point to steady, gradual deceleration rather than sharp disinflation, leaving the BoE’s December cut narrative largely intact. Markets are unlikely to adjust pricing meaningfully until the Autumn Budget clarifies the fiscal stance. For now, the data reinforces a picture of easing, but not yet subdued, domestic price pressures.
EUR/USD Daily Outlook
Daily Pivots: (S1) 1.1566; (P) 1.1587; (R1) 1.1603; More…
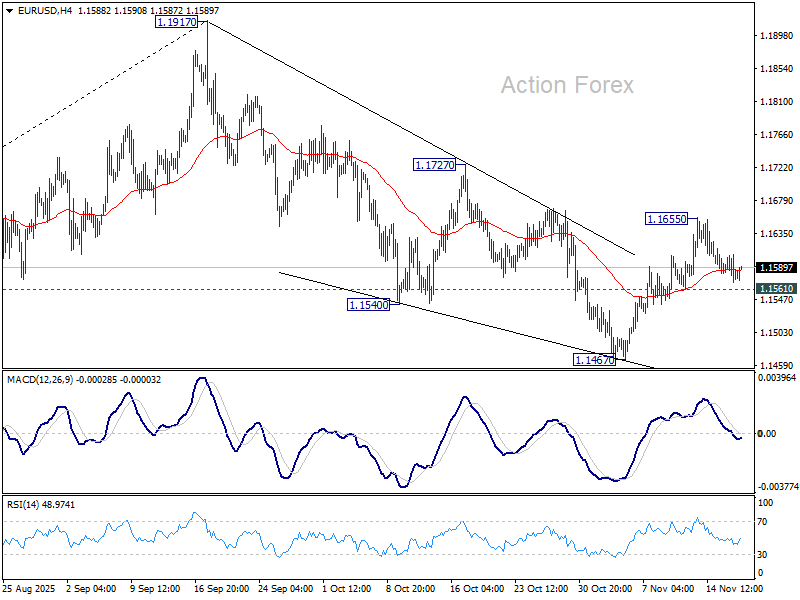
No change in EUR/USD's outlook and intraday bias stays neutral. On the upside, above 1.1655 will affirm the case that fall from 1.1917 has completed as a correction at 1.1467. Bias will be back on the upside for 1.1727 resistance first. However, break of 1.1561 will revive near term bearishness and target 1.1467 low instead.
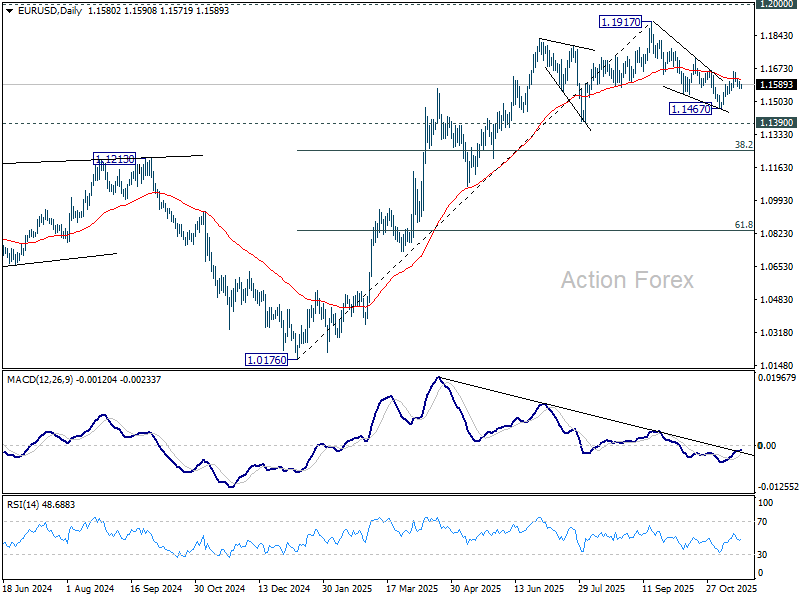
In the bigger picture, considering bearish divergence condition in D MACD, a medium term top is likely in place at 1.1917, just ahead of 1.2 key psychological level. As long as 55 W EMA (now at 1.1328) holds, the up trend from 0.9534 (2022 low) is still in favor to continue. Decisive break of 1.2000 will carry larger bullish implications. However, sustained trading below 55 W EMA will argue that rise from 0.9534 has completed as a three wave corrective bounce, and keep long term outlook bearish.
USD/JPY Daily Outlook
Daily Pivots: (S1) 154.98; (P) 155.36; (R1) 155.89; More...
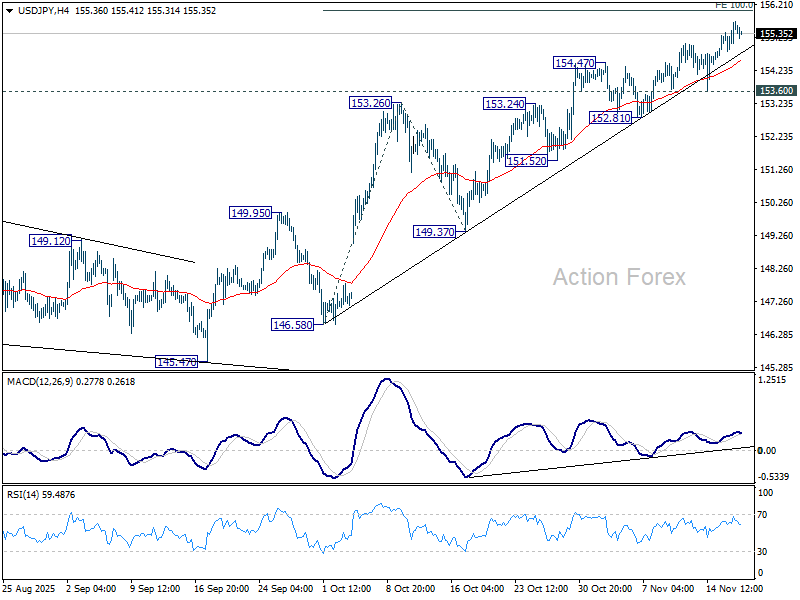
USD/JPY's rally is in progress and intraday bias stays on the upside for 100% projection of 146.58 to 153.26 from 149.37 at 156.05. Break there will pave the way to 158.85 key structural resistance. For now, outlook will remain bullish as long as 153.60 support holds, in case of retreat.
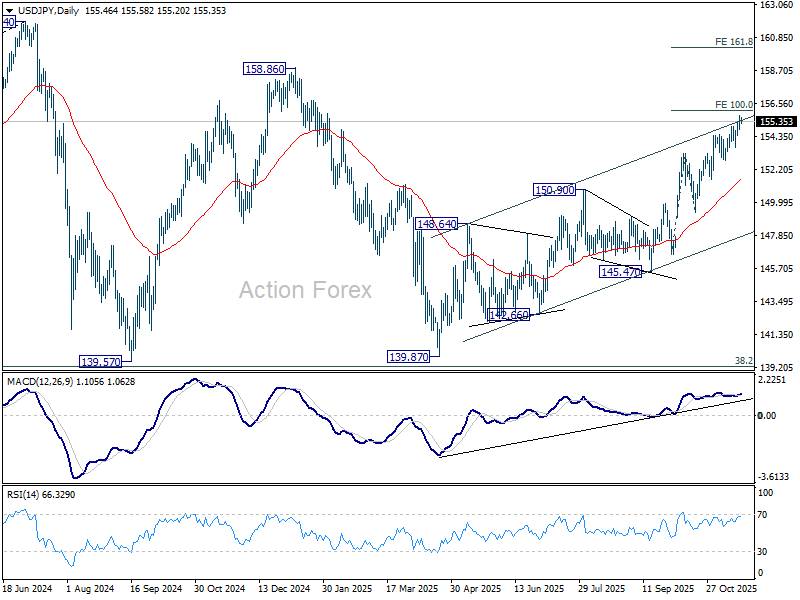
In the bigger picture, current development suggests that corrective pattern from 161.94 (2024 high) has completed with three waves at 139.87. Larger up trend from 102.58 (2021 low) could be ready to resume through 161.94 high. On the downside, break of 149.37 support will dampen this bullish view and extend the corrective pattern with another falling leg.
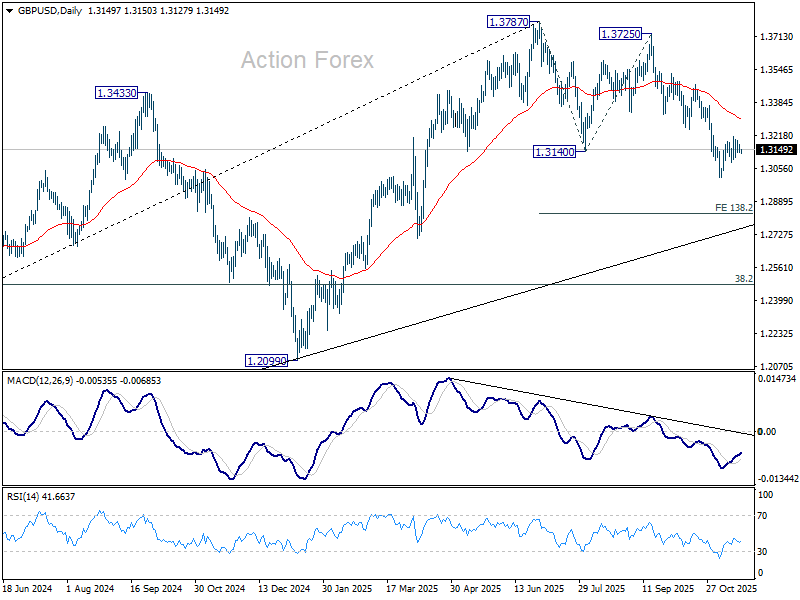
GBP/USD Daily Outlook
Daily Pivots: (S1) 1.3127; (P) 1.3152; (R1) 1.3170; More...
No change in GBP/USD's outlook and intraday bias remains neutral for more consolidations. Further decline is expected as long as 1.3247 support turned resistance holds. Break of 1.3008 will resume the fall from 1.3787, and target 138.2% projection of 1.3787 to 1.3140 from 1.3725 at 1.2831. Nevertheless, firm break of 1.3247 will suggest that fall from 1.3787 has completed as a corrective move already.
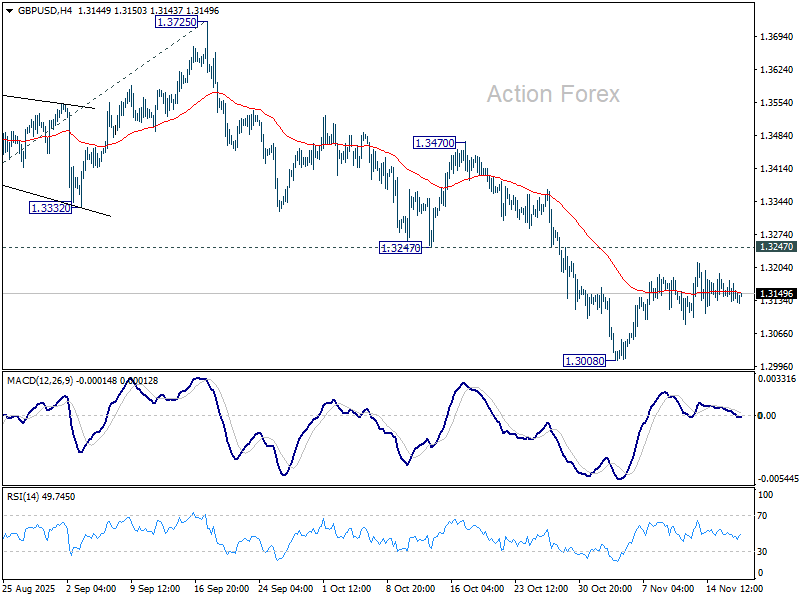
In the bigger picture, the break of 55 W EMA (now at 1.3182) is taken as the first sign that corrective rise from 1.0351 (2022 low) has completed. Decisive break of trend line support (now at 1.2824) will solidify this case and target 38.2% retracement of 1.0351 to 1.3787 at 1.2474 next. Meanwhile, in case of another rise, strong resistance should emerge below 1.4248 (2021 high) to cap upside to preserve the long term down trend.