
Sample Category Title
USD/CHF Mid-Day Outlook
Daily Pivots: (S1) 0.7941; (P) 0.7953; (R1) 0.7975; More…
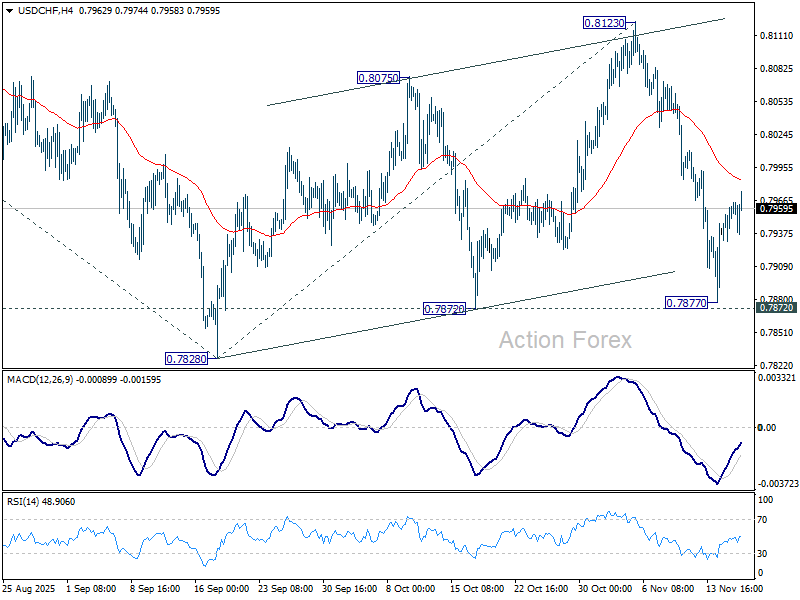
Intraday bias in USD/CHF remains neutral for the moment. As noted before, corrective rebound from 0.7828 could have completed with three waves up to 0.8123. Break of 0.7872 support will pave the way through 0.7828 to resume the larger down trend. Next near term target is 38.2% projection of 0.9200 to 0.7828 from 0.8123 at 0.7599. However, sustained break of 55 4H EMA (now at 0.7984) will mix up the outlook.
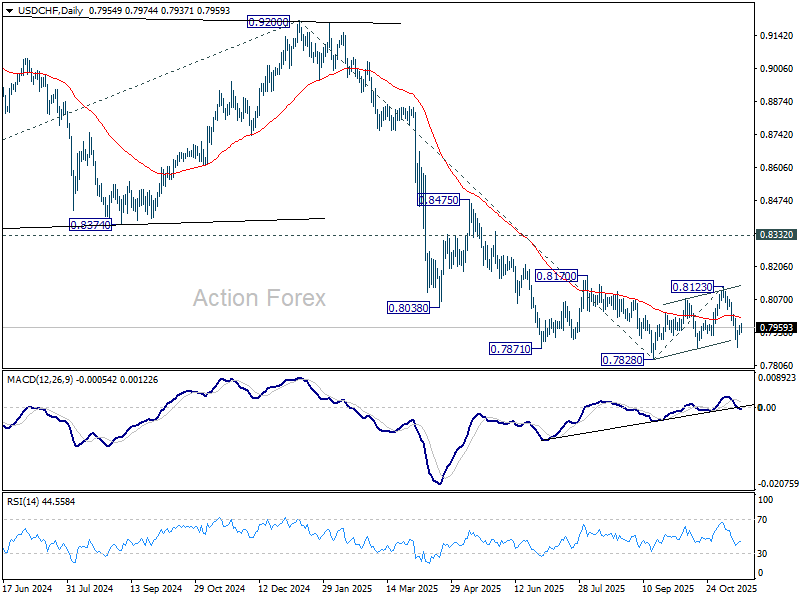
In the bigger picture, long term down trend from 1.0342 (2017 high) is still in progress. Next target is 100% projection of 1.0146 (2022 high) to 0.8332 from 0.9200 at 0.7382. In any case, outlook will stay bearish as long as 0.8332 support turned resistance holds (2023 low).
USD/JPY Mid-Day Outlook
Daily Pivots: (S1) 154.43; (P) 154.86; (R1) 155.70; More...
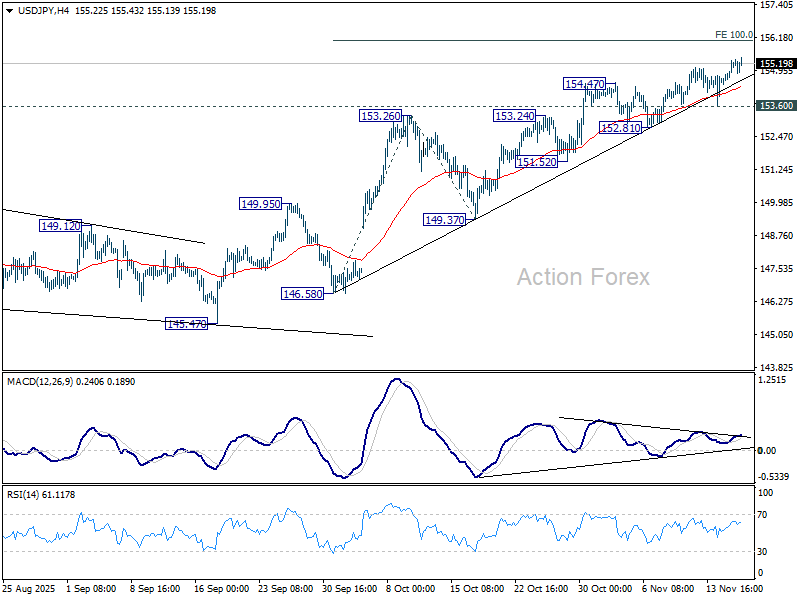
Intraday bias in USD/JPY remains on the upside for the moment. Current rise is part of the rally from 139.87. Next target is 100% projection of 146.58 to 153.26 from 149.37 at 156.05. Break there will pave the way to 158.85 key structural resistance. However, considering bearish divergence condition in 4H MACD, firm break of 153.60 support will indicate short term topping, and bring deeper pullback to 55 D EMA (now at 151.45).
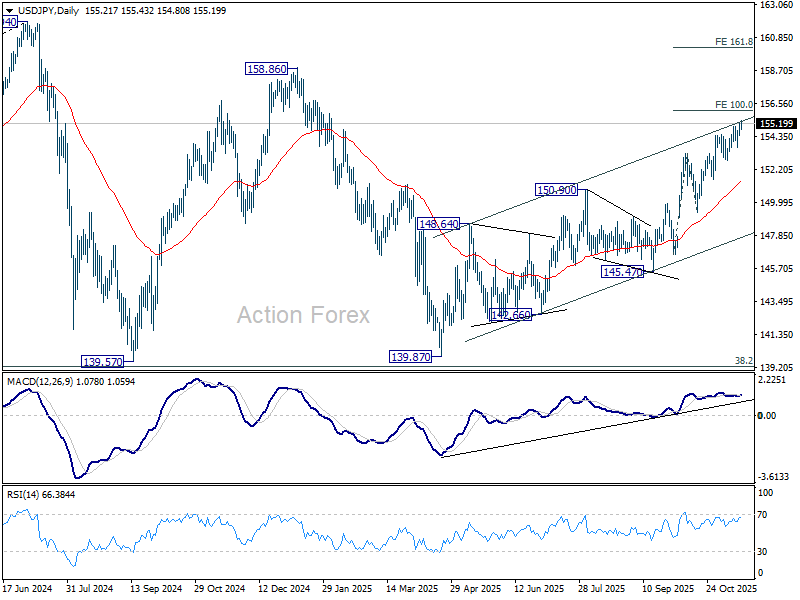
In the bigger picture, current development suggests that corrective pattern from 161.94 (2024 high) has completed with three waves at 139.87. Larger up trend from 102.58 (2021 low) could be ready to resume through 161.94 high. On the downside, break of 149.37 support will dampen this bullish view and extend the corrective pattern with another falling leg.
Tech Slide Continues, Yen Still Lacks BoJ Signal
Global markets remain under pressure today as risk sentiment deteriorates further across regions. Europe opened firmly lower, tracking the broad declines seen earlier in Asia, while U.S. futures point to another weak session. Today’s tone is one of cautious de-risking, with markets showing little appetite to buy dips ahead of several major event risks.
Technology stocks continue to drive the weakness. Selling pressure on Nvidia stayed intense ahead of the company’s third-quarter results due after Wednesday’s close. Nvidia has been the symbolic leader of the AI-driven market rally, and the reaction to its earnings could determine whether sentiment stabilizes or slips into a deeper correction. With concerns over market breadth, excessive valuations, and shaky AI fundamentals resurfacing, traders are positioning defensively.
Attention is on Thursday’s U.S. non-farm payrolls release — the first since the government reopened. Today’s initial jobless claims, at 232k, and continuing claims, at 1.957m, produced almost no market reaction. That muted response raises doubts about how strongly markets will react to the delayed NFP, though the potential for a volatility shock should not be dismissed.
In Japan, the highly anticipated meeting between Prime Minister Sanae Takaichi and BoJ Governor Kazuo Ueda offered far less clarity than markets had hoped. Traders were looking for sharper messaging on policy direction given rising political pressure on the central bank. Instead, the meeting produced broad, non-committal remarks that did little to shift expectations.
Ueda reiterated that Japan’s wage-price dynamics are improving thanks to both government policy and the BoJ’s supportive stance. He described the central bank as “gradually adjusting” monetary support to ensure a stable path toward the 2% inflation goal. Takaichi, he said, appeared to accept his assessments. Yet nothing in his comments hinted at a change in stance or timeline.
Asked about the timing of the next rate hike, Ueda repeated that decisions will be made “appropriately” based on incoming data — a stance that leaves the market no clearer about whether a December move is even on the table. Given the political backdrop, traders remain convinced that January or later is more likely.
In FX, Dollar holds the top spot for the week so far, followed by Loonie and Sterling. At the other end of the spectrum, Aussie is the weakest performer, with Yen and Swiss Franc next in line. Kiwi and Euro sit squarely in the middle.
In Europe, at the time of writing, FTSE is down -1.39%. DAX is down -1.42%. CAC is down -1.40%. UK 10-year yield is up 0.006 at 4.543. Germany 10-year yield is down -0.015 at 2.701. Earlier in Asia, Nikkei fell -3.22%. Hong Kong HSI fell -1.72%. China Shanghai SSE fell -0.81%. Singapore Strait Times fell -0.86%. Japan 10-year JGB yield rose 0.015 to 1.749.
RBA minutes show no clear bias toward next move
RBA minutes from the November 3–4 meeting underscored a Board that sees the economy as “broadly in balance” and saw no justification to adjust the cash rate at this stage. While the central projection remains aligned with the RBA’s employment and inflation objectives, policymakers stressed that the next move in rates is not predetermined. Members agreed it was “not yet possible to be confident” about whether holding steady or easing further would become the more likely scenario.
The minutes outlined several conditions that could support keeping policy unchanged. One is a stronger-than-expected recovery in "demand" that lifts employment. Another is if incoming data suggest the economy’s "supply capacity" is weaker than previously assessed — potentially due to persistently high inflation or softer-than-expected productivity growth. A third is a reassessment of whether monetary policy is still "slightly restrictive". Any of these outcomes, the RBA said, would "limit the scope for further easing".
But the Board also detailed circumstances that could justify another rate cut. A material weakening in the labor market remains the clearest trigger. A second downside risk is if GDP growth disappoints — for example, if households turn "more cautious about spending" than currently assumed. In these cases, excess capacity would likely reappear, cooling inflation and warranting additional support.
Overall, the minutes confirm a central bank in wait-and-see mode. The RBA is not ruling out further easing, but neither is it leaning strongly toward it. The next several months of data — particularly on productivity, inflation persistence, and household spending — will be crucial in determining whether the Board holds steady or reopens the easing path in 2026.
USD/JPY Mid-Day Outlook
Daily Pivots: (S1) 154.43; (P) 154.86; (R1) 155.70; More...
Intraday bias in USD/JPY remains on the upside for the moment. Current rise is part of the rally from 139.87. Next target is 100% projection of 146.58 to 153.26 from 149.37 at 156.05. Break there will pave the way to 158.85 key structural resistance. However, considering bearish divergence condition in 4H MACD, firm break of 153.60 support will indicate short term topping, and bring deeper pullback to 55 D EMA (now at 151.45).
In the bigger picture, current development suggests that corrective pattern from 161.94 (2024 high) has completed with three waves at 139.87. Larger up trend from 102.58 (2021 low) could be ready to resume through 161.94 high. On the downside, break of 149.37 support will dampen this bullish view and extend the corrective pattern with another falling leg.
Dollar Preparing for Battle
- The hawks in the Fed are pulling the blanket over themselves, but the doves are not giving up without a fight.
- USD may fall on a sell-the-news trade and CHF has become one of the favourites.
The decline in the chances of a Fed rate cut in December from 72% to 48% over the past couple of weeks should have sent the EURUSD into a knockout. However, the futures market anticipates that by the end of the cycle, the federal funds rate will have fallen to 3.25%, down from its current level of 3.75%. Moreover, the question of December remains open. ‘Dove’ Christopher Waller continues to insist on a rate cut amid signs of weakness in the labour market. On the contrary, the Fed ‘hawks’ are inclined to leave everything as it is.
Kansas City Fed President Jeffrey Schmid’s concerns about inflation go beyond tariffs. Rising energy and healthcare costs, as well as higher insurance premiums, suggest that inflation will not return to 2% from its current 3% for some time. Cleveland Fed President Beth Hammack notes that inflation has exceeded the Fed’s target for more than four years. The scale of the tariff increase means that high prices cannot be considered a temporary phenomenon.
A decisive battle is expected between the FOMC’s ‘hawks’ and ‘doves’ in December. October served as a rehearsal. Following the previous meeting, Jerome Powell was forced to dash the market’s illusions about a rate cut at the end of the year. Investors fear that the Fed’s overly hawkish rhetoric in the minutes will dash hopes for easing next month. These speculations are supporting dollar purchases.
Following the publication of the minutes on 20 November, the US employment figures for September will be released. They will be released with a huge delay, but the trend is important here. If the labour market continues to cool, this will once again make easing in December the main scenario, playing into the hands of EURUSD buyers. Conversely, positive non-farm payrolls will strengthen the dollar.

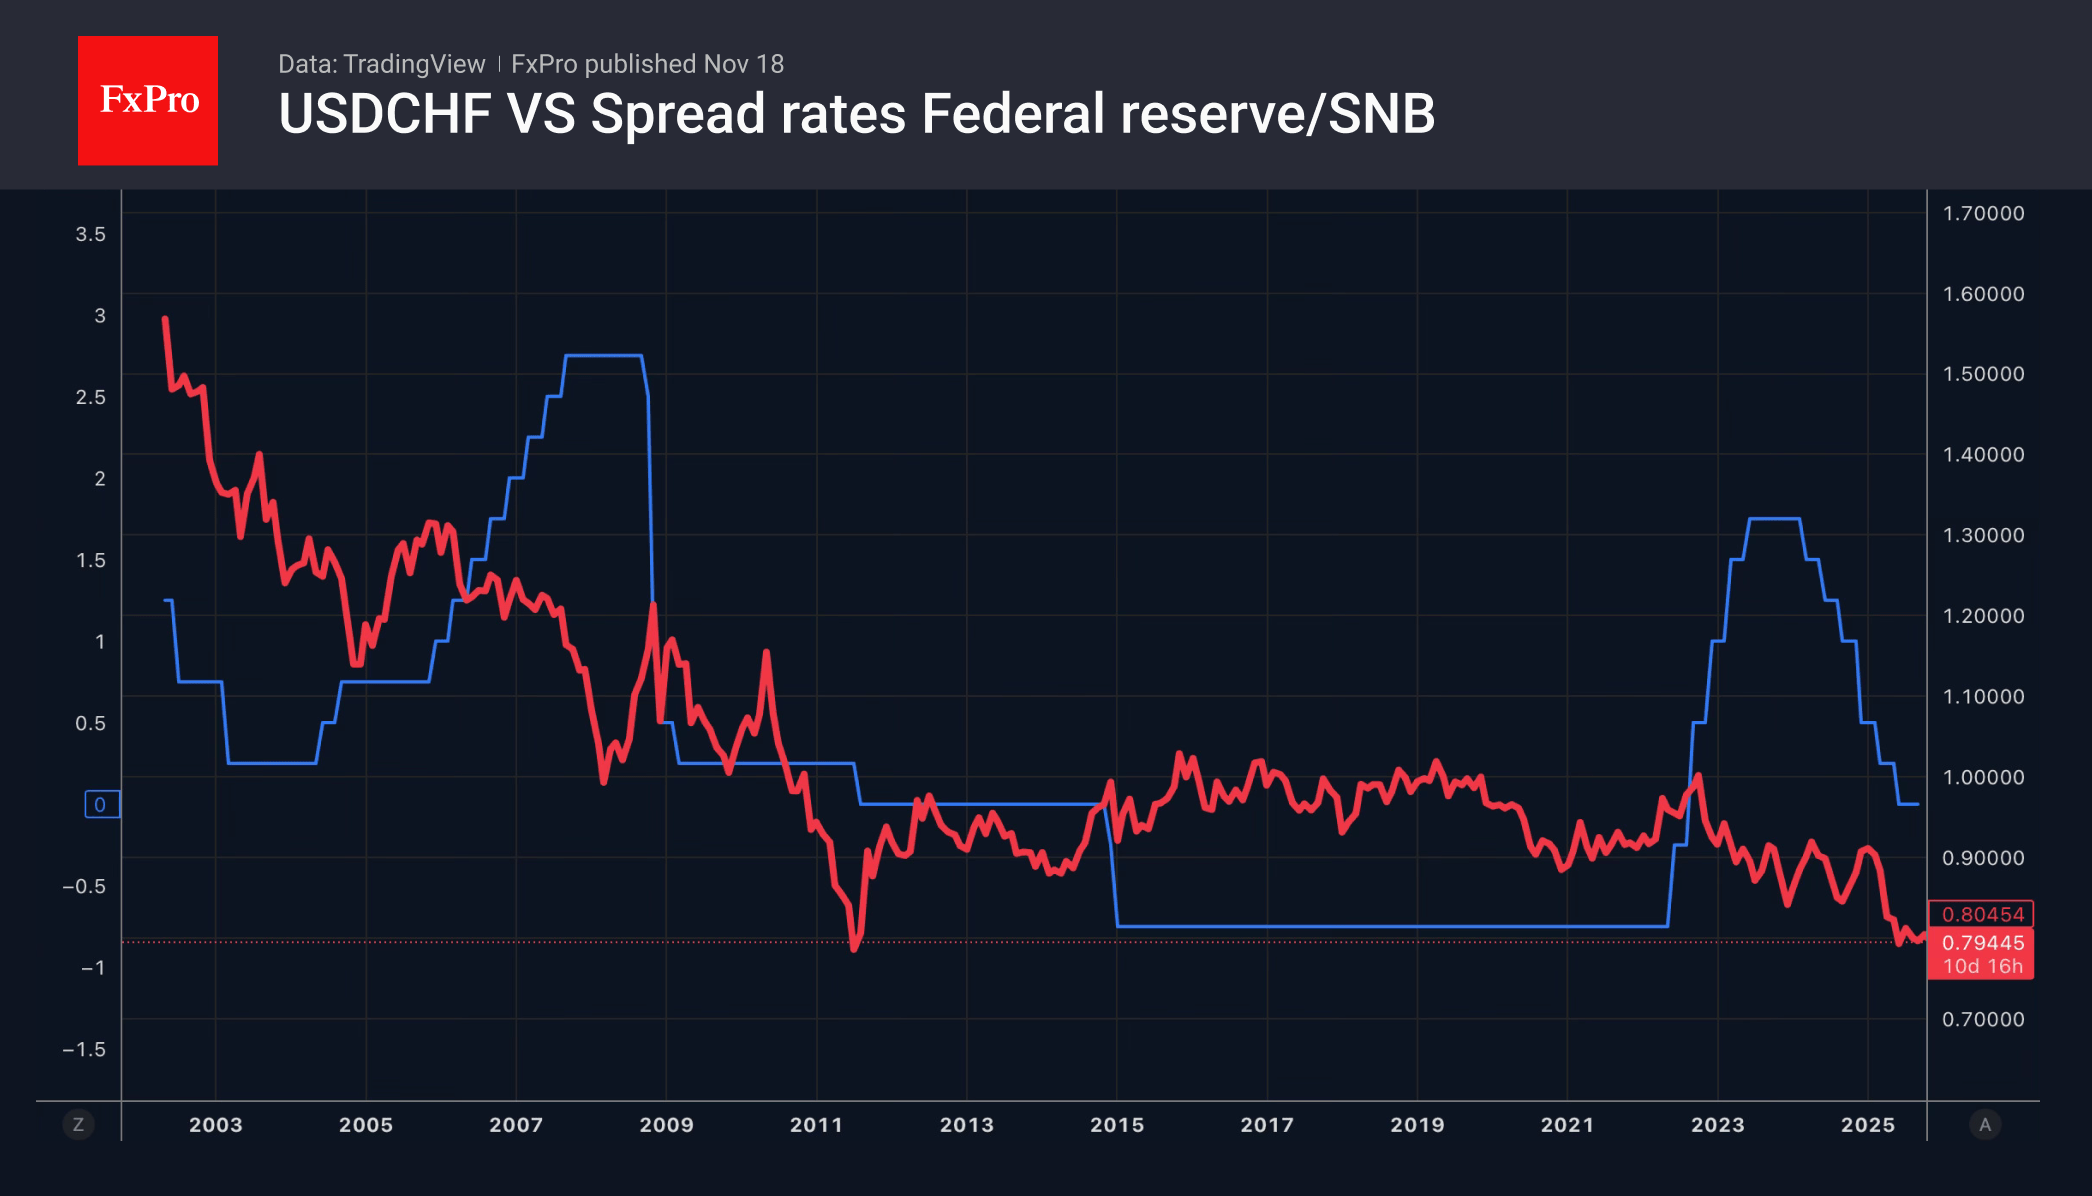
Meanwhile, the White House has finally lowered tariffs on Swiss goods from 39% to 15%. Expectations surrounding this event have made the franc the main favourite on the Forex market. However, according to Commerzbank, the USDCHF peak is unlikely to be too deep. Most of the good news is already priced in. The future of the pair will depend on the interest rate differential between the Fed and the Swiss National Bank.
EUR/USD Declines as Market Awaits Key US Employment Data
The EUR/USD pair extended its losses for a third consecutive session, falling to 1.1591 on Tuesday. The downward pressure persists as investors await a backlog of delayed US economic data, expected to provide crucial signals on the Federal Reserve's interest rate path. The market's primary focus is the delayed September employment report, which traders will scrutinise for signs of a softening labour market.
The rhetoric from Federal Reserve officials remains mixed, contributing to the market's indecision. Several officials have recently expressed scepticism about the need for a December rate cut, citing persistent inflationary pressures. However, this was counterbalanced by Governor Chris Waller, who confirmed his support for a cut, and Vice Chair Philip Jefferson, who advocated for a gradual approach due to rising labour market risks.
This conflicting guidance has led to a repricing of rate expectations. Futures markets now imply only a 43% probability of a 25-basis-point cut in December, a significant decline from the odds priced at the start of the month. The US dollar has found broad support, strengthening against commodity-linked currencies like the Australian and New Zealand dollars.
Technical Analysis: EUR/USD
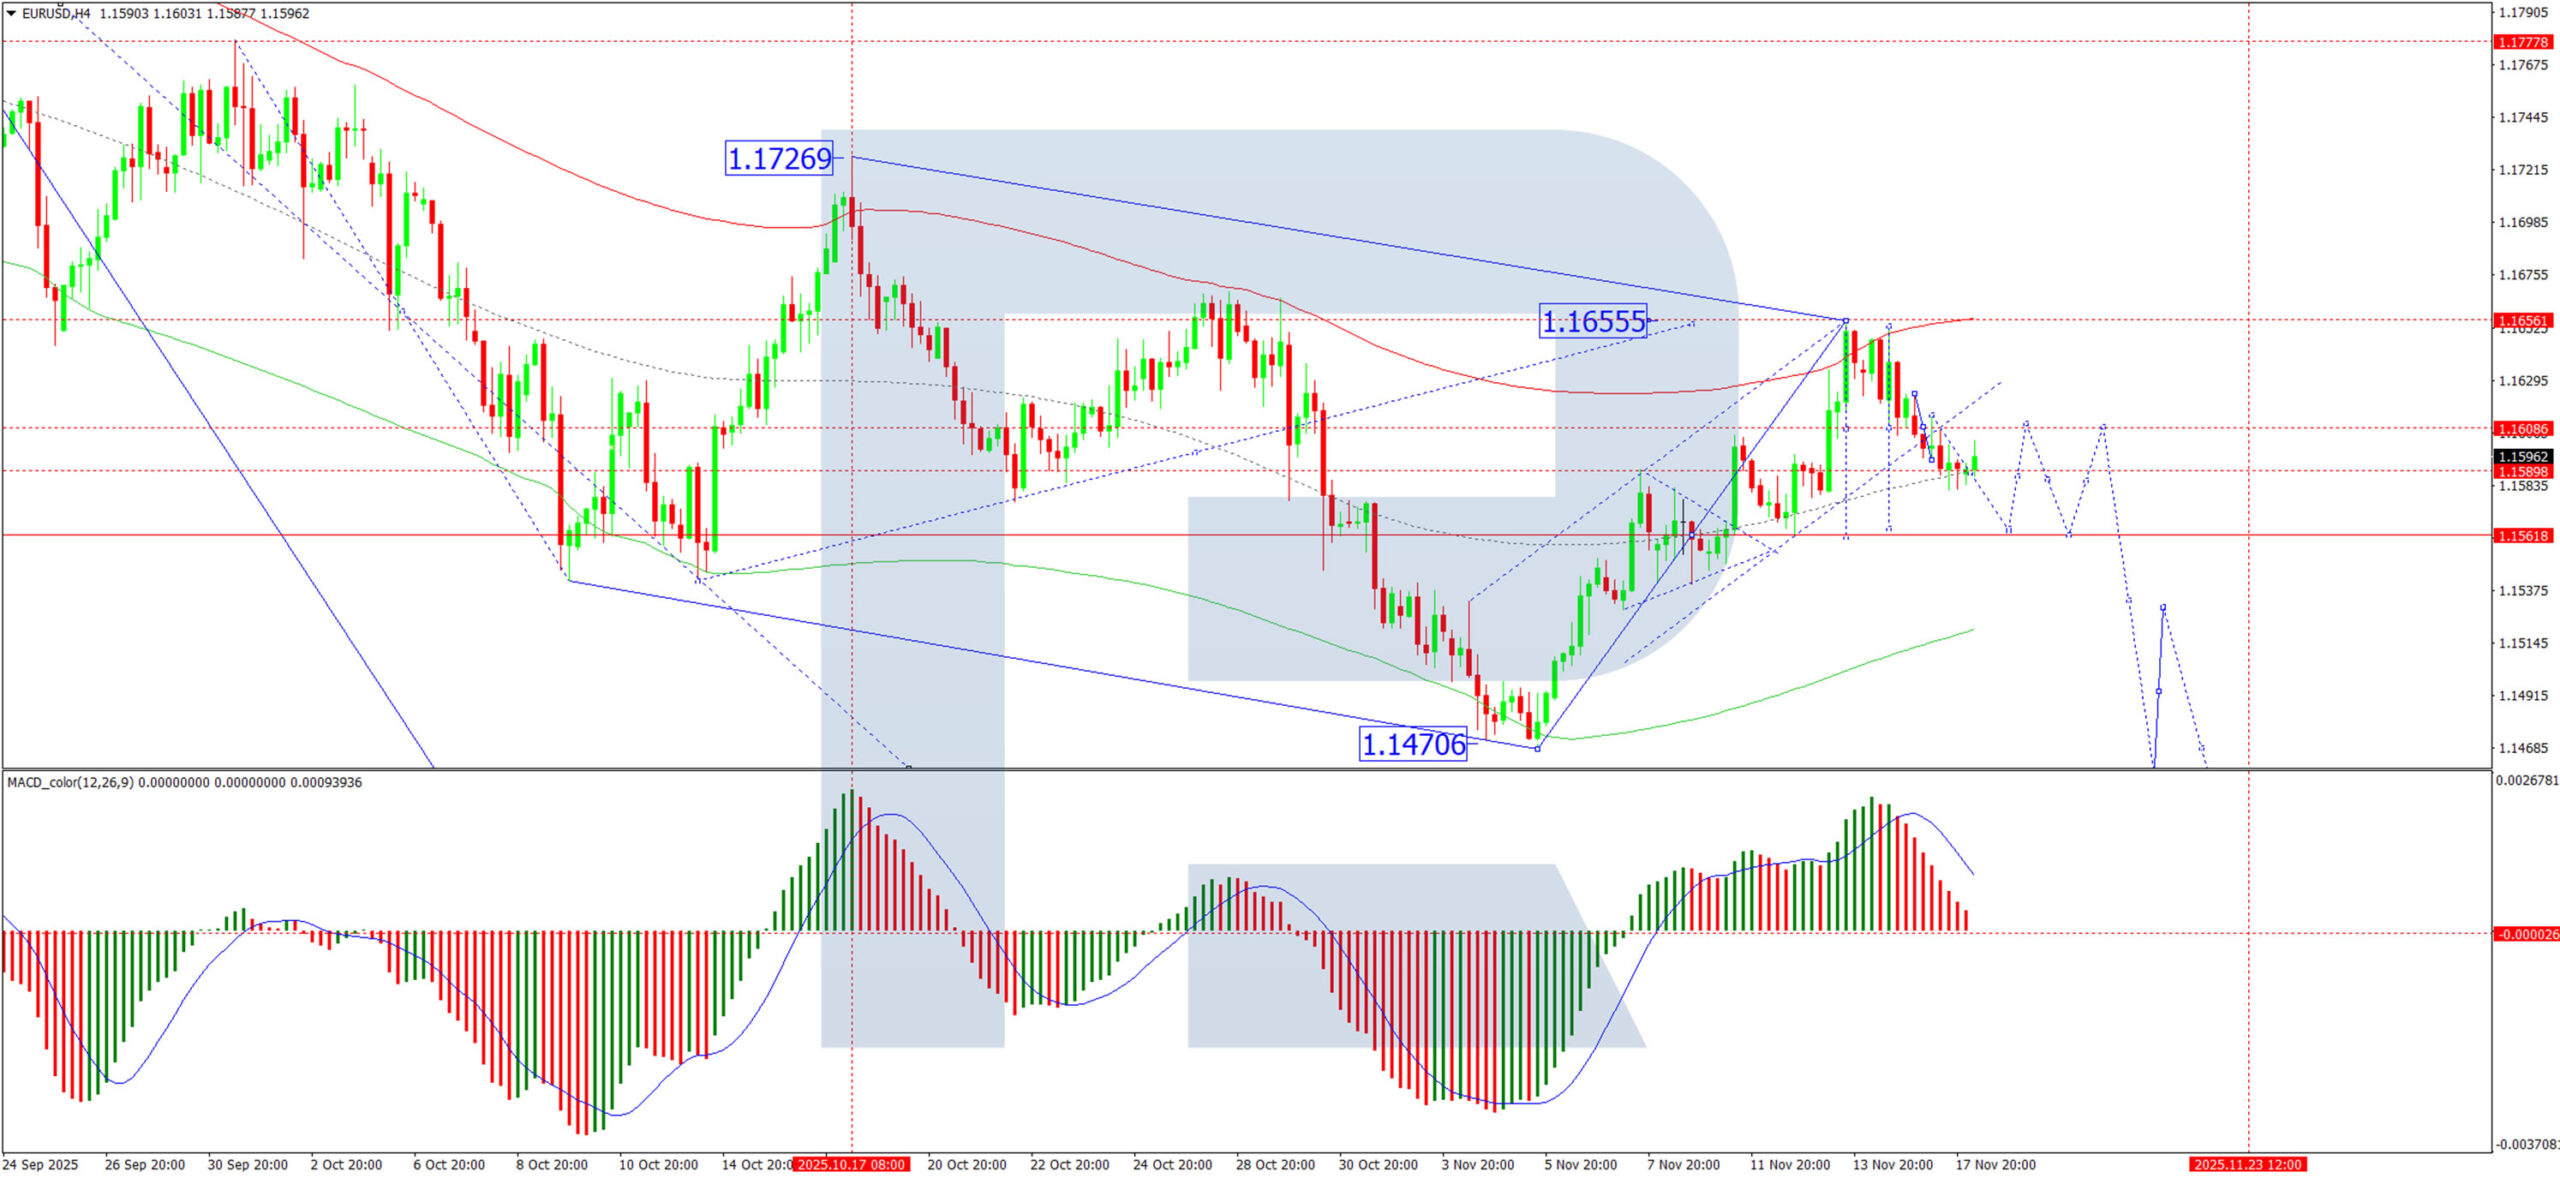
H4 Chart:
On the H4 chart, EUR/USD has breached its growth wave channel at 1.1605, opening the path for a downward move. We anticipate an initial decline to 1.1564, followed by a technical pullback to retest the 1.1605 level from below. This retest is likely to present a fresh selling opportunity before the downtrend resumes towards the primary target of 1.1560. The MACD indicator confirms this bearish outlook. Its signal line, while above zero, is pointing decisively downward, indicating that selling momentum is overpowering any residual strength.
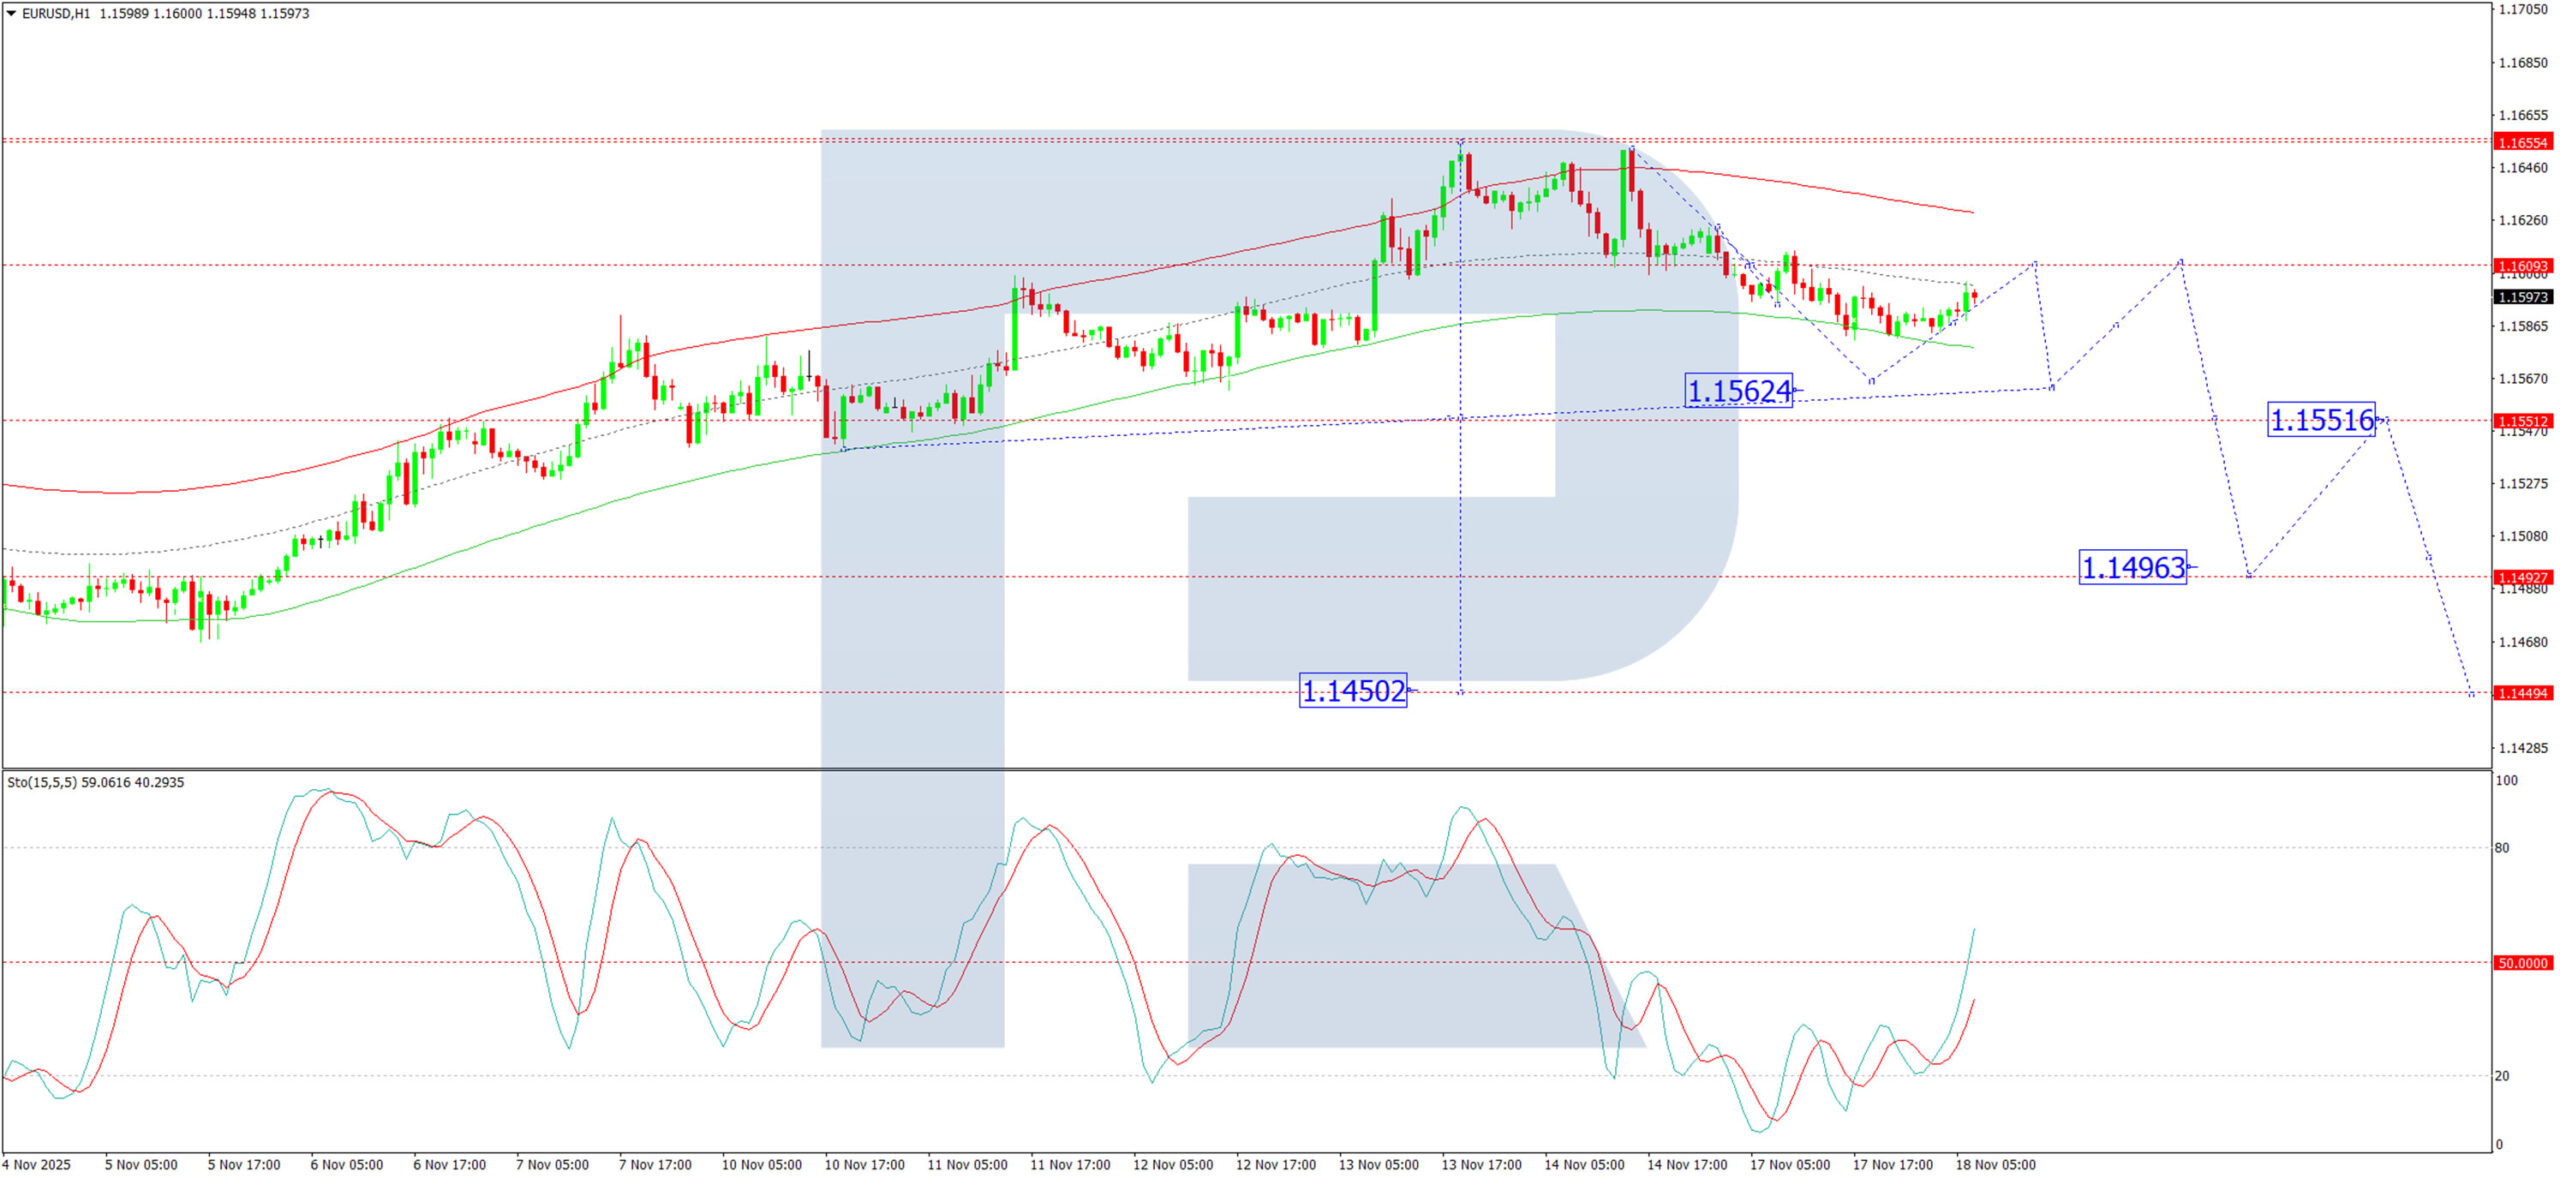
H1 Chart:
On the H1 chart, the pair has broken downwards from a consolidation range around 1.1600, confirming the second leg of a bearish impulse. The immediate target for this move is 1.1560. Upon reaching this level, a corrective bounce back towards 1.1600 is a distinct possibility. The Stochastic oscillator supports this corrective view. Its signal line is rising from the 20 level towards the 50 level, suggesting that short-term downward pressure may be exhausted, paving the way for a temporary rebound.
Conclusion
The EUR/USD remains under pressure amid a strengthening US dollar and uncertain Fed policy. While conflicting comments from officials have created volatility, the overall technical structure is bearish. The breach below 1.1605 suggests further losses are likely, with an initial target at 1.1560. Any near-term rebounds towards the 1.1600/05 resistance zone are expected to be temporary, offering potential opportunities to re-enter the prevailing downtrend.
Crypto Market Accelerates Decline
Market Overview
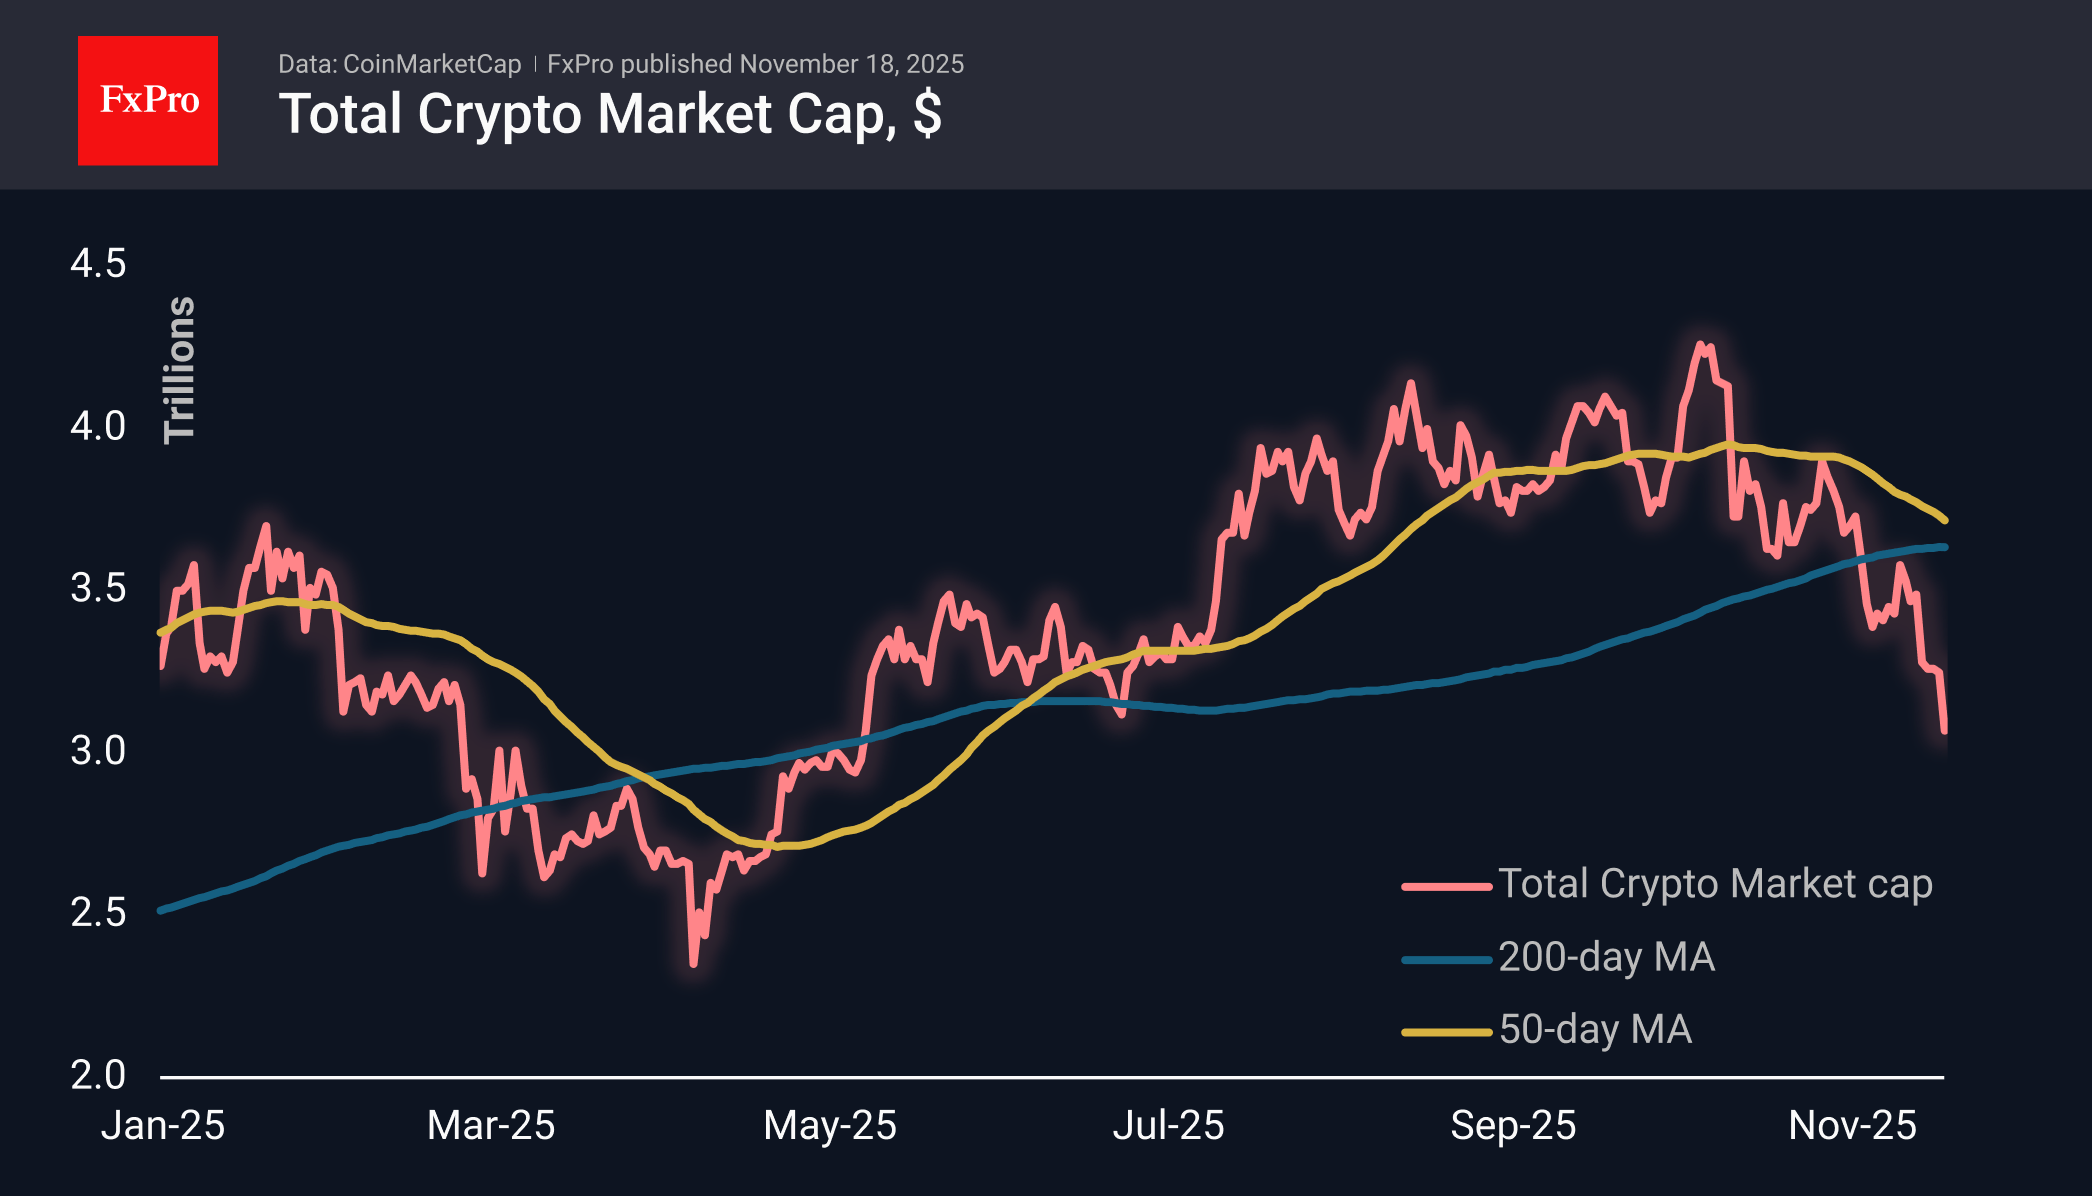
The crypto market is experiencing a sharp decline, losing another 4% over the past 24 hours and falling back to $3.07 trillion, its lowest level since early May. The decline is accelerating relative to the trend observed since 10 October. At this stage, the market is being dragged down by major coins — Bitcoin, Ethereum, XRP — which are losing more than 5%, while some altcoins remain in the shadows. It is unlikely that this should be considered a sign of strength for coins such as Monero (+2.7%), Tron (-1.8%) or Bitcoin Cash (-2.4%). It would be more accurate to say that the bears have not yet reached them.
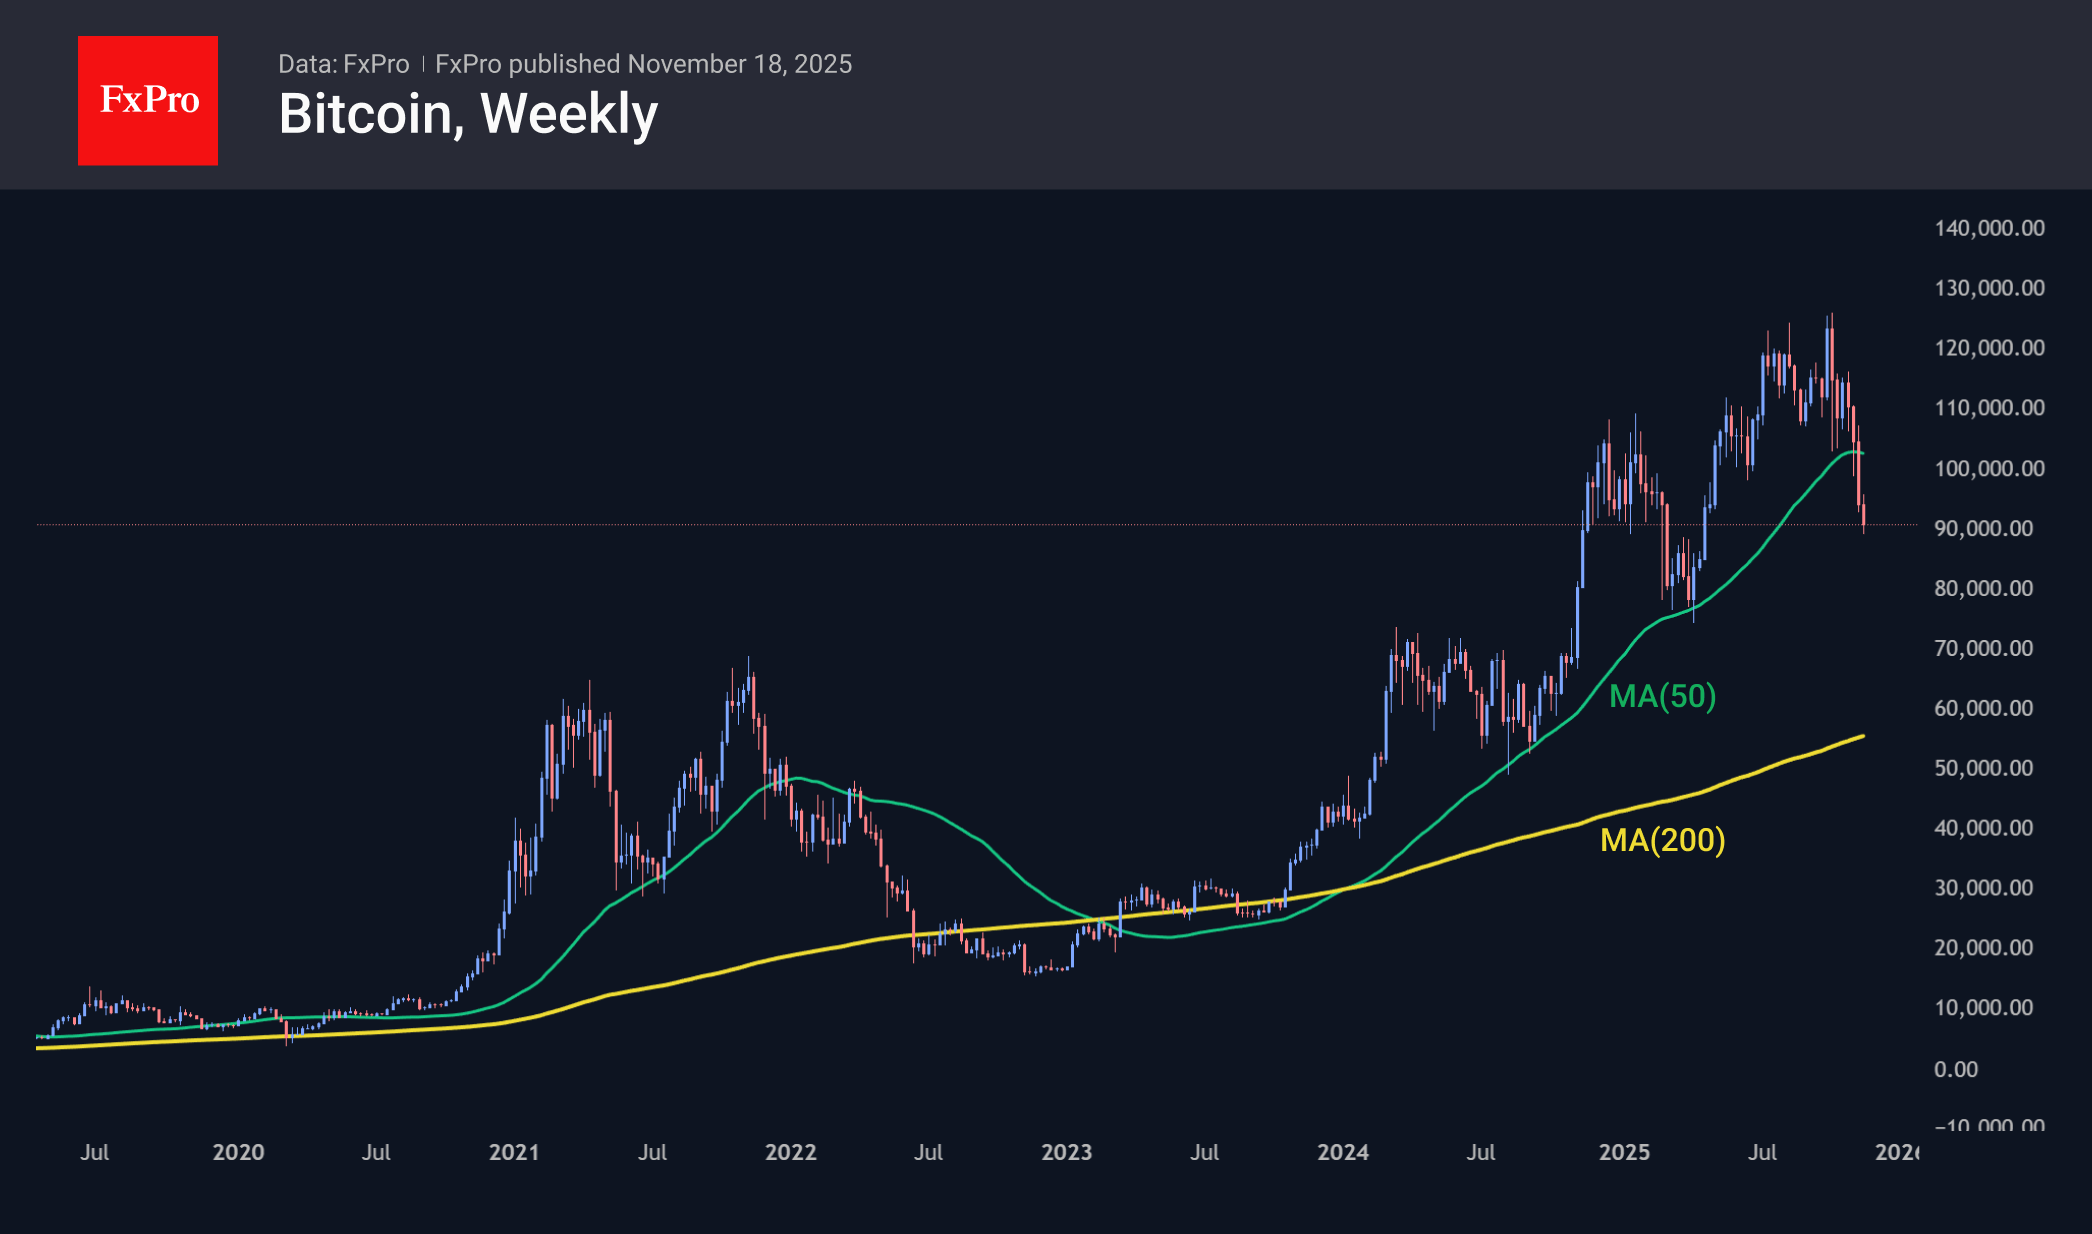
Bitcoin fell below $90K, trading at its lowest levels since the end of April. As expected, the dip below the 50-week moving average at the end of last week triggered sellers, confirming the breakdown of the bullish trend that had lasted for the previous two years. Now, the working scenario appears to be a chance for BTC to dip to its 200-week moving average. In 2022, this path took 9 weeks and over 30 weeks to form the bottom.
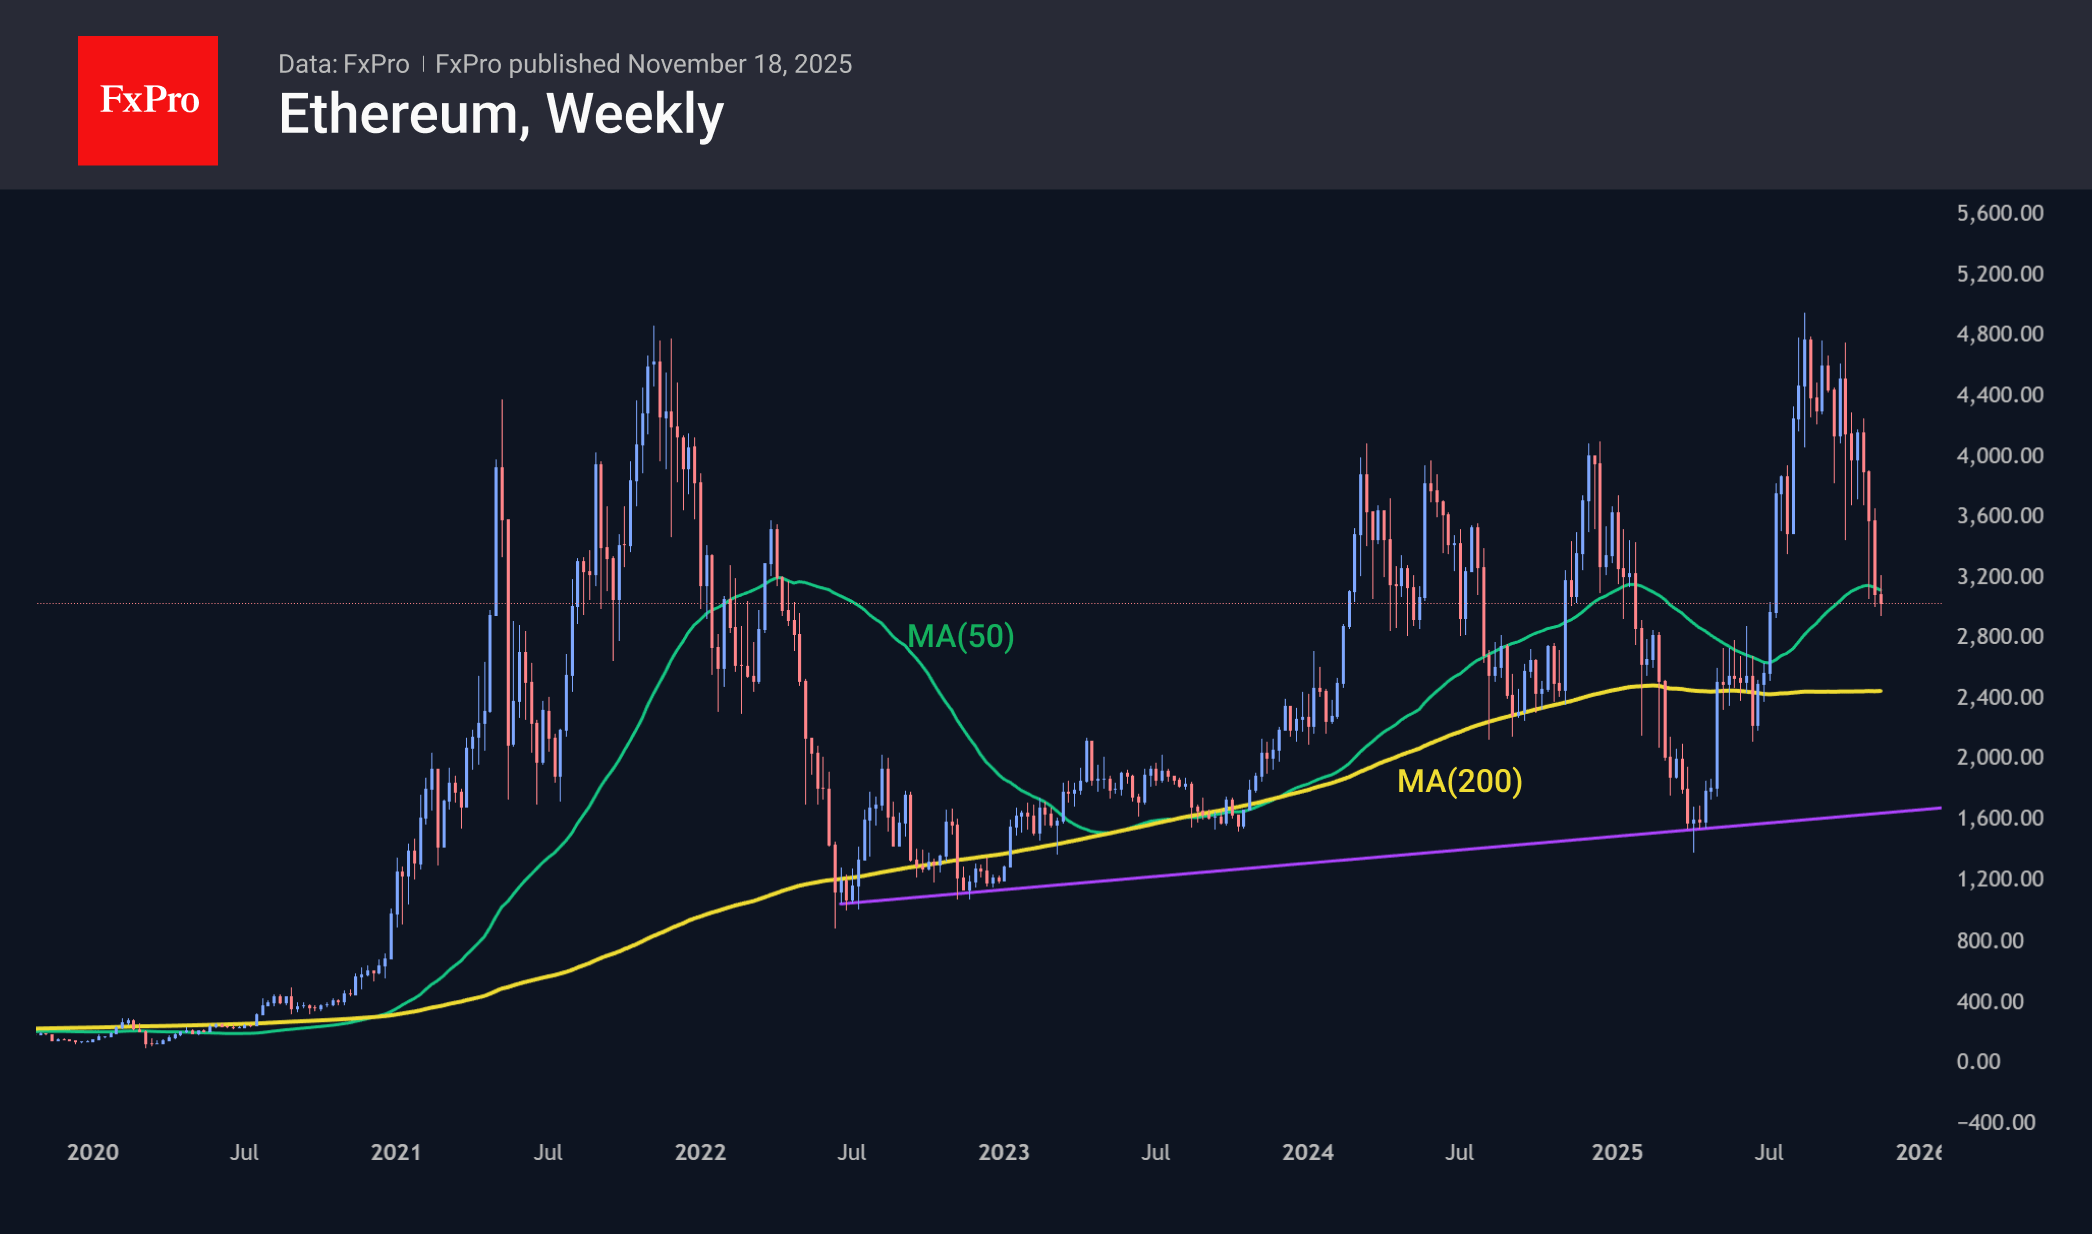
Ethereum fell below $3,000, following Bitcoin, which rolled back below its 50-week moving average. In this case, the 200-week average (approximately $2,300) will deter sellers, and we are considering a decline to $1,700 as a working pessimistic scenario.
News Background
According to CoinShares, global investment in crypto funds declined by $2.036 billion last week, marking the third consecutive week of outflows. Investments in Bitcoin fell by $1.378 billion, in Ethereum by $689 million, in XRP by $16 million, and in Solana by $8 million. Investments in Sui rose by $6 million, in Litecoin by $3 million, and in ETFs with multiple crypto assets by $31 million.
The fall of Bitcoin from its record highs in October was triggered by the capitulation of short-term holders, rather than the distribution of coins by long-term investors, according to XWIN Research.
Ethereum is entering a Supercycle phase like the one that brought Bitcoin a hundredfold increase since 2017, said BitMine CEO Tom Lee. In his opinion, the market decline is attributed to issues with several large market makers attempting to provoke liquidations in Bitcoin.
The inflow of stablecoins to Binance reached $9 billion in 30 days. The indicator is close to historical peaks, which previously preceded strong market movements, notes CryptoOnchain analyst. In his opinion, capital in standby mode can quickly change the market dynamics in favour of the ‘bulls’.
Strategy’s business model is entirely dependent on funds buying its shares and is built on ‘fraud,’ said Peter Schiff, a well-known cryptocurrency critic and gold advocate. Since July, Strategy’s shares have fallen by more than 50%, and recently, its capitalisation has fallen below the value of its assets.
Nasdaq 100 Under Pressure
As the chart shows, the Nasdaq 100 index (US Tech 100 mini on FXOpen) fell today (point 3) to its lowest level in a month, making it the weakest performer among the major US indices. The sell-off in the technology sector has been driven by a double blow:
→ A reassessment of expectations for the Federal Reserve’s next rate move. According to market observers, the probability of a Fed rate cut on 10 December continues to decline and now stands at 43%, compared with 62% a week earlier.
→ Growing scepticism about the valuations of companies linked to artificial intelligence. A Bank of America fund managers’ survey revealed heavy overcrowding in tech: 54% cited “long Magnificent 7” as the most crowded trade, while 45% viewed an AI bubble as the biggest tail risk.
Technical Analysis of the Nasdaq 100 Chart
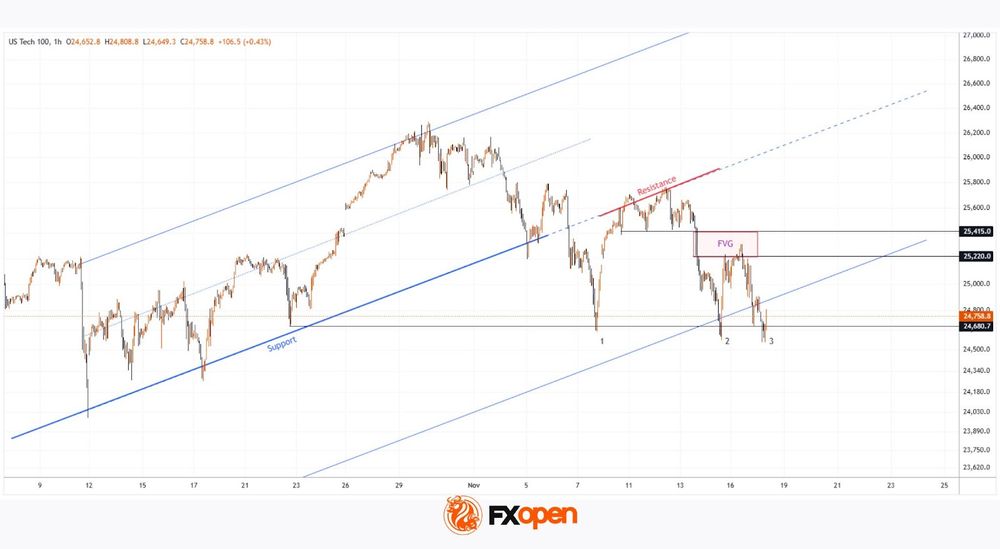
When analysing the hourly chart of the Nasdaq 100 (US Tech 100 mini on FXOpen) on 10 November, we identified an ascending channel. However, mounting selling pressure has resulted in:
→ the channel being extended downwards;
→ its former lower boundary (which acted as support) now acting as the median line and serving as resistance.
From the demand perspective:
→ The lower boundary of the expanded channel may prevent a deeper bearish move.
→ The chart shows a sequence of false bearish breakouts (1–2–3), where the price dips slightly below the previous low only to reverse sharply upward — signs of a Liquidity Grab pattern that may indicate buyer aggression.
From the supply perspective:
→ The 25220–25415 zone appears to be a confirmed FVG area, where a clear market imbalance emerged and sellers strongly dominated.
Bulls may attempt to push the Nasdaq 100 (US Tech 100 mini on FXOpen) back into the ascending channel, but whether this scenario plays out will largely depend on Nvidia’s quarterly earnings report — a key event for the technology sector, scheduled for release tomorrow.
Trade global index CFDs with zero commission and tight spreads. Open your FXOpen account now or learn more about trading index CFDs with FXOpen.
This article represents the opinion of the Companies operating under the FXOpen brand only. It is not to be construed as an offer, solicitation, or recommendation with respect to products and services provided by the Companies operating under the FXOpen brand, nor is it to be considered financial advice.
Bitcoin Price Falls Below $90k
Today, the price of Bitcoin dropped below the psychologically significant $90,000 level for the first time since late April, with the decline from last month’s all-time high now approaching -30%.
Why is Bitcoin Falling?
One of the main reasons is the highly leveraged nature of the cryptocurrency market. According to Coinglass, $1 billion worth of positions — mostly longs — were liquidated over the past 24 hours, putting pressure on the price and triggering a cascading effect in the BTC/USD decline.
On the fundamental side, the media highlight growing doubts that the US Federal Reserve will cut interest rates any time soon. The prospect of a prolonged period of tight monetary policy continues to weigh on risk assets, including Bitcoin. This has led to outflows from spot Bitcoin ETFs (around $1 billion last week) and rising market anxiety — the Binance Fear and Greed Index stands at 15, signalling extreme fear.
Technical Analysis of the BTC/USD Chart
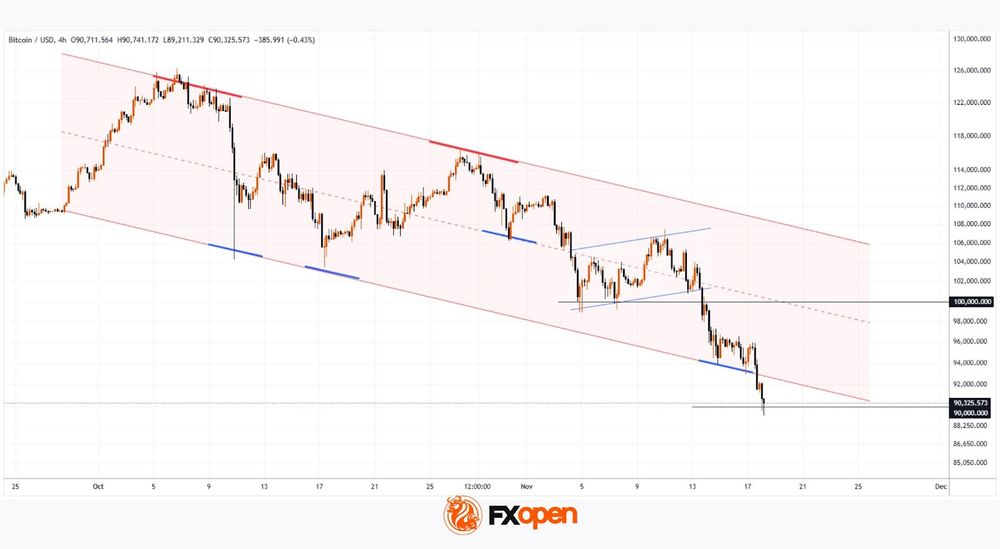
Following the explosive rally at the start of October, Bitcoin has been forming a descending channel, and today BTC/USD slipped below its lower boundary.
Bulls may hope that the drop beneath the psychological $90k level will spark a rebound (similar to the price action after the dip below $100k in early November, which resulted in a period of consolidation shaped like a Bull Flag).
Analysts at Santiment also point out that many cryptocurrencies have entered a zone of short-term “extreme oversold” conditions, which could increase the likelihood of a temporary recovery — potentially with a retest of the $100k area.
However, even if a rebound does occur, it is fair to say that the bullish sentiment that characterised early 2025 has been dealt a serious blow.
FXOpen offers the world's most popular cryptocurrency CFDs*, including Bitcoin and Ethereum. Floating spreads, 1:2 leverage — at your service. Open your trading account now or learn more about crypto CFD trading with FXOpen.
*Important: At FXOpen UK, Cryptocurrency trading via CFDs is only available to our Professional clients. They are not available for trading by Retail clients. To find out more information about how this may affect you, please get in touch with our team.
This article represents the opinion of the Companies operating under the FXOpen brand only. It is not to be construed as an offer, solicitation, or recommendation with respect to products and services provided by the Companies operating under the FXOpen brand, nor is it to be considered financial advice.
USD/JPY: Potential minor top at 155.30, USD at risk of bearish reversal towards 154.20/153.65
Key takeaways
- The Japanese yen has been the weakest major currency over the past month, with USD/JPY climbing nearly 3%—outpacing the US Dollar Index’s 0.9% gain—amid political pressure for looser monetary policy.
- USD/JPY’s surge above 155.00 has heightened FX-intervention risk, prompting verbal warnings from Japan’s Finance Minister over rapid, one-sided yen depreciation.
- A high-stakes meeting between BoJ Governor Ueda and Prime Minister Takaichi later today could trigger short-term volatility, with technical signals pointing to rising odds of a minor bearish reversal unless USD/JPY breaks above 155.30.
In the past month (based on a rolling basis), the Japanese yen has been the weakest major currency against the US dollar. The USD/JPY rose by almost 3% as of Tuesday, 18 November 2025, at the time of writing, surpassing the 0.9% return seen in the US Dollar Index over the same period (see Fig. 1).
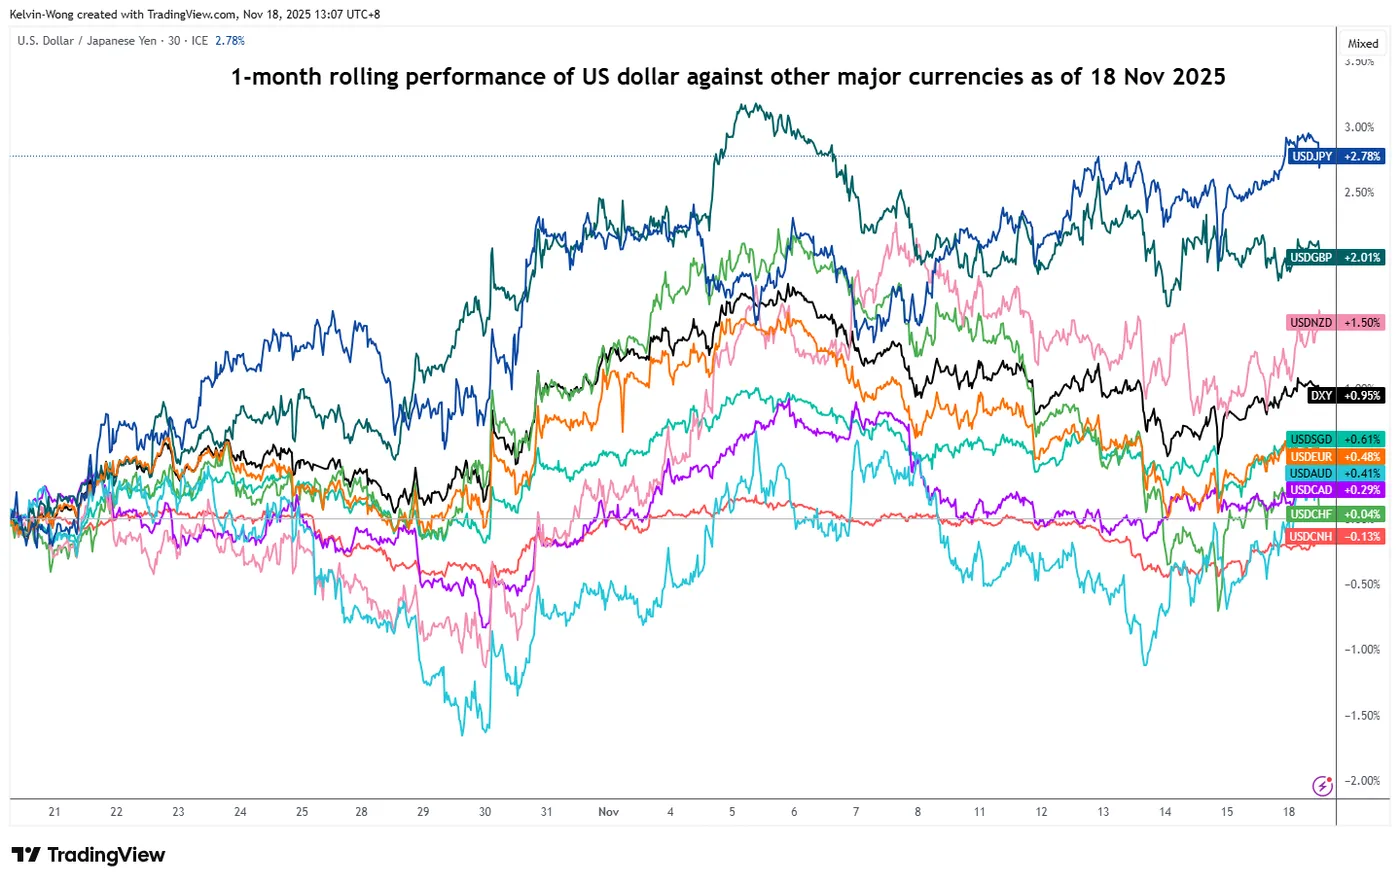
Fig. 1: 1-month rolling performances of major currencies against the US dollar as of 18 Nov 2025 (Source: TradingView)
The current bout of weakness seen in the Japanese yen has been attributed to political jawboning by the new Japanese Prime Minister, Takaichi’s penchant for an accommodating monetary policy to drive economic growth, going against the Bank of Japan (BoJ)’s current monetary policy stance of gradually rising interest rates as inflation trend in Japan has stablished above BoJ’s 2% long-term target.
FX intervention risk has increased with BoJ Ueda-PM Takaichi meeting on the horizon
The USD/JPY has surged past the 155.00 psychology level on Monday, 17 November, from the 7 November 2025 low of 152.82, and it continued to trade higher in today’s Asia session, 18 November, as it printed an intraday high of 155.38 to record a 10-month high.
The sharp rise in USD/JPY has triggered a verbal warning from Finance Minister Katayama, who reiterated concerns over rapid, one-sided yen moves in the FX market.
Separately, a closely watched meeting between BoJ Governor Ueda and Prime Minister Takaichi is scheduled for 3:30 p.m. local time. Any post-meeting comments related to monetary policy could spark meaningful short-term volatility in USD/JPY.
Let’s now outline the short-term trajectory for USD/JPY over the next 1 to 3 days, along with the key technical elements and levels to monitor.
Preferred trend bias (1-3 days) – Minor bearish reversal below 155.30
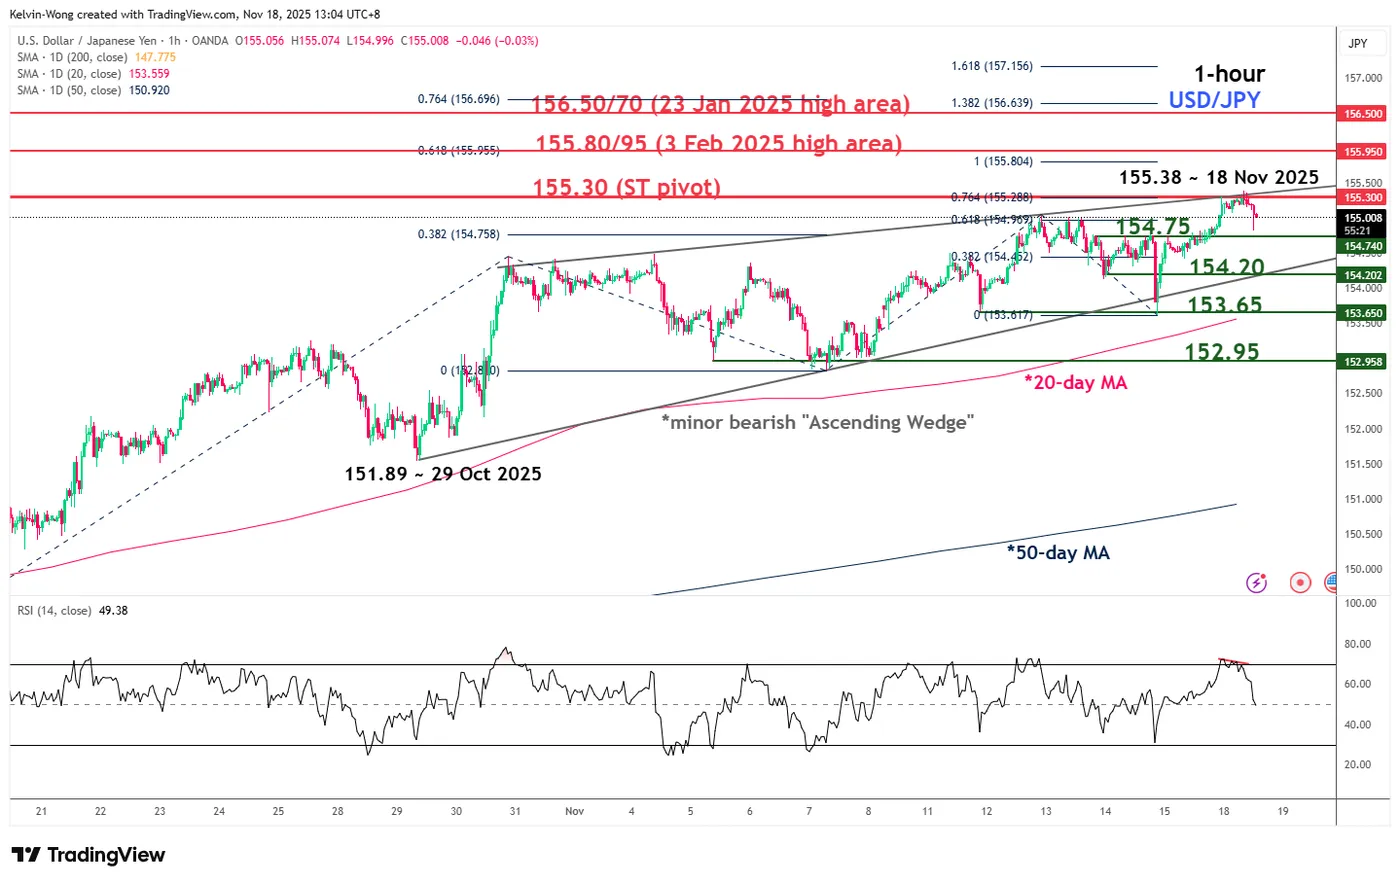
Fig. 2: USD/JPY minor trend as of 18 Nov 2025 (Source: TradingView)
Bearish bias with 155.30 as key short-term pivotal resistance for the USD/JPY. A break below 154.75 may expose near-term weakness towards the next intermediate supports at 154.20 and 153.65 (also the 20-day moving average) (see Fig. 2).
Key elements
- The minor uptrend phase of USD/JPY from its 29 October 2025 low of 151.89 to Tuesday, 18 November 2025, intraday high of 155.38 may have reached a terminal exhaustion point, as price action has hit the upper boundary of the bearish “Ascending Wedge” configuration.
- In conjunction, the hourly RSI momentum indicator has traced out a bearish divergence before exiting its overbought region on Tuesday, 18 November 2025, during the Asia session.
- These observations suggest that short-term upside momentum has started to wane, which increases the odds of a minor bearish reversal on the USD/JPY.
Alternative trend bias (1 to 3 days)
However, a clearance above 155.30 key resistance invalidates the bearish reversal scenario for a further squeeze up towards the next intermediate resistances at 155.80/155.95 and 156.50/156.70.
Dollar Hardly Profits from Deterioration in Risk Sentiment
Markets
There was no really dominant theme to guide broader trading yesterday. Even as the US shutdown has halted it still will take time for markets to be able to rely on (timely & accurate) official data. In this respect the time of flying blind isn’t really over yet. On FI markets, yield changes in US Treasuries and EMU/German bonds were limited. US yields changed between +0.4 bps (2-y) and -1.2% bps (30-y). With less than 50% of a December rate cut discounted and comments from Fed members still showing elevated disagreement, there is little incentive for markets to push in either direction. EMU/German yields also changed by less than 1 bp across the curve. The EC autumn economic forecasts expecting EMU economic growth at 1.3%-1.2%-1.4% over 2025-2026-2027 and inflation holding near 2% only confirmed that there is little reason to expect additional ECB easing in the foreseeable future. The 2-y EMU swap yield at 2.20% closed at the highest level since end March. The 10-y swap at 2.75% even nears the mid-March top. At least for now, the adagio ‘no news, is good news’ for risk sentiment doesn’t work anymore. Both US and EMU equity indices struggle to avoid a break below first relevant support levels. For the S&P 500 a break below 6631/6550 and of the EuroStoxx a break below 5554/5487, would signal some cracks in the broader picture. Will tomorrow’s Nvidia results be able to bring some clarity? At least of now, low visibility on the pace on further Fed easing probably also prevents the dollar from fully taking up its safe haven role. DXY yesterday regained some ground (close 99.59) but firmly holds with recent short-term range (99.00/100.36). Similar picture for EUR/USD (close 1.1592). The yen still underperformed (USD/JPY 155) as markets ponder the impact of a stimulative policy, both for the currency as for Japanese bond markets, with ultra-long yields (30-, 40- and especially 20-y) nearing/touching record levels. Last week’s sell-off in UK Gilts eased yesterday ‘eased’, and sterling temporarily settled just north of the 0.88 barrier. Even so, with the budget debate still ongoing and risk sentiment fragile, sterling is likely to stay in the defensive.
Sentiment in Asia remains outright risk-off this morning (e.g. Nikkei -3.25%). At the same time, a further rise in Japanese LT yields (e.g. 40-y at 3.75%; +6.5 bps and testing the May top, 20-y at record 2.8%) illustrates that the theme of fiscal sustainability remains at work. To some extent, it probably also prevents (core) bonds to fully play any safe haven role. We continue to keep a close eye at the ultra-long end of the curve as a further rise in yields even might be an additional negative for broader risk sentiment. For now, the dollar hardly profits from the deterioration in risk sentiment, probably also as the uncertainty on the valuation especially in US tech stocks is one of the sources of overall market uncertainty. For now, the likes of EUR/USD might hold to recent ranges (1.15-1.17). Or will the weekly ADP payrolls data unlock this stalemate?
News & Views
A group of lawmakers in Japan’s ruling Liberal Democratic Party, oddly called “the Responsible and Expansionary Fiscal Policy Caucus”, pushed prime minister Takaichi to come up with an extra budget that is significantly larger than what has been floated recently. Local media over the weekend reported that Takaichi’s promised package could total around JPY 17tn, or +/- 3% of GDP. The Caucus, however, argues its size should be way higher, to the tune of JPY 25tn. That would be the biggest in 20 years, excluding the pandemic period between 2020-2022. The group in its proposal shrugged off any of the market concerns about fiscal sustainability or rising bond yields, calling them “excessive and unsupported by data or global consensus”. The long end of the Japanese yield curve in any case again significantly underperforms, with yields at the 40-yr bucket adding 7 bps and now trading less than 2 bps away from its May record high.
PM Carney of Canadia narrowly won an important vote on the budget yesterday. His proposal secured the slimmest of majorities in a 170-168 vote after a handful of opposition members abstained and the Green Party leader voted in favour. Carney’s Liberal Party fell short of winning a majority of the 343 seats in the House of Commons in April’s election. Had the vote failed, Canada was headed for its second election in less than a year. The budget can now proceed and more votes are to come. But Monday’s result indicates that it will eventually be approved. Carney’s proposal foresees an extra C$ 167.3bn in total deficits over five years and seeks amongst others to cushion the blow from US tariffs, raise defense spending and fund housing programs.