Sample Category Title
Not Buying
All of a sudden, economic data pointing to slowing economies and rising debt is making investors increasingly uncomfortable — and with good reason. Japan’s economy printed its first quarterly contraction in six quarters, shrinking 0.4% q/q (–1.8% annualized) in Q3. Meanwhile, China’s property crisis lingers, consumer spending remains weak and a 25% drop in shipments to the US is difficult to replace in the short run. European growth continues to limp along — military-spending boosts don’t yet show up in headline GDP, and even Switzerland is not immune. The Swiss GDP contracted 0.5% in Q3 — and believe it or not - state workers are striking in Vaud and Geneva today!
The good news is, all of the economic angst doesn’t automatically translate into poor investor sentiment. Markets run on different vibes — and slowing fundamentals don’t always spook risk appetite.
The bad news is that some of the more bullish vibes — AI enthusiasm, massive government stimulus, dovish central-bank expectations — are starting to fade.
First, appetite for AI is under pressure from circularity worries and bubble fears. The US Nasdaq recently closed below its 50-day moving average (for the first time since late April), and Chinese and South Korean AI-tech players are also seeing outflows. This is happening even though South Korea’s giants (Samsung, SK, Hyundai, LG) have promised around $550 bn in investment over the next five years in AI, chips, energy, and biotech.
Second, the dovish Federal Reserve (Fed) expectations have been crumbling on realization that the Fed may not cut rates come December. Then there’s the Fed. Dovish expectations are crumbling. The market is increasingly doubting a rate cut in December — futures suggest a cut is less likely than once hoped, and even positive political news (like Trump reducing tariffs on beef, tomatoes, and bananas) may not be enough to give the Fed the green light.
Finally, Japan just rolled out a $110 billion stimulus package under PM Takaichi — targeting growth through tax cuts, direct aid, and investments in AI, chips, defense, and shipbuilding. Normally, that kind of stimulus would ignite a sugar rush for markets. But instead of rallying, the Nikkei barely flinched. The focus has shifted to bond yields: the 30-year Japanese yield spiked above 3.30%, making the spending expensive. In FX markets, USD/JPY has returned above 155, with potential pressure toward 160 even amid the threat of intervention.
So now, all eyes are on Nvidia. When it reports its Q3 results tomorrow after the bell, analysts expect another stellar quarter: revenue of ~ $54 bn (implying ~50–60% YoY growth) and a gross margin guidance near 73.3%. But even with a blowout quarter, there’s no guarantee that bulls come rushing back — especially after the news that big names like SoftBank and Peter Thiel are already scaling back their exposure.
From here, for the rest of the OpenAI-linked players in the market, careful stock-picking might be the game. Debt-heavy growers (I’m looking at you, Oracle) are falling out of favour, while big, cash-rich companies like Google may fare better. Oracle’s collapse since its September highs — and even its 30-year bonds taking a beating — is a clear warning. Google, in contrast, has extended gains in that same period. But what “doing better” will mean in a tougher AI-investment environment is yet to be seen.
Nasdaq futures are leading losses again this morning — a pretty good signal that today’s session may not offer relief. Crude oil is stuck around $60pb, with top sellers showing no urgency to let the bulls run, while gold offers no relief; rare are the bulls willing to buy above the $4000 now that the momentum has weakened.
So let’s pray that Nvidia gets something extraordinary out of its hat on Wednesday.
Focus on ADP Employment Amid Signs of Hiring Delays
In focus today
In the US, the ADP Weekly Employment figures are published. Last week's release showed private sector payrolls turning negative at -11k per week in the four weeks leading up to 25 October, indicating weakening job growth momentum. Though the data lacks detail, firms appear to have delayed hiring seasonal holiday workers, typically seen in October-November. Such delays could distort seasonal adjustment factors, affecting both weekly and monthly employment data.
In Hungary, the central bank (MNB) is expected to keep the key rate unchanged at 6.50% for the 14th consecutive month. Despite government pressure for monetary easing, as PM Orban trails in most polls ahead of the April elections, Governor Varga has stated the need for a "careful and patient approach to monetary policy". He highlighted the importance of supporting the forint to curb inflation through the exchange rate channel. With inflation still running above the upper end of the tolerance band (4%), it is highly unlikely that we will see any cuts from the MNB anytime soon, which is also reflected in both money market pricing and current consensus forecasts.
Economic and market news
What happened yesterday
Equities: Global equities pulled back yesterday. The S&P 500 fell 0.9%, with communication services and utilities being the only sectors in the green - signalling a defensive rotation. Dow Jones was down -1.2% while Stoxx 600 declined 0.5%. Notably, this happened without any new economic data on the health of the US economy or the labour market across major markets, despite some central bank officials being more concerned about the labour market or put in the words of Fed's Waller, the labour market is nearing "stall speed". Key events to watch this week is tomorrow's NVIDIA earnings report and Thursday's job data thus limited risk sentiment ahead of the releases.
FI and FX: EUR/USD edged marginally lower yesterday but continues to hover around 1.16. Scandies remain in synch, with EUR/NOK back above 11.70 after a brief visit below and EUR/SEK centred around 11.00. EUR/JPY briefly touched on 180 for a new all-time high, whilst USD/JPY edged above 155 for a 10-month high. The US treasury curve bull flattened modestly whereas Bunds bull steepened slightly. Equities in deep red over the night as risk sentiment has taken a hit.
GBP/JPY Daily Outlook
Daily Pivots: (S1) 203.40; (P) 203.96; (R1) 204.79; More...
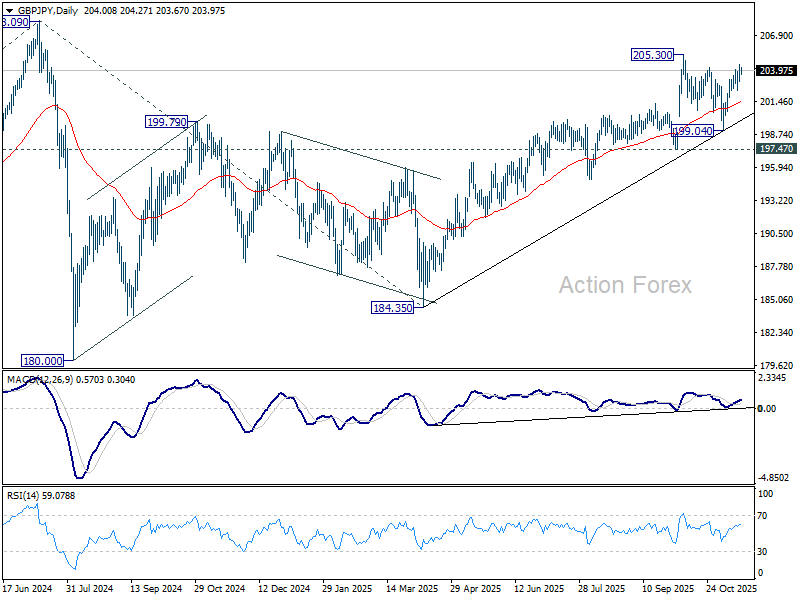
Intraday bias in GBP/JPY remains on the upside for the moment. Break of 204.22 support should confirm that correction from 205.30 has completed. Break of 205.30 will resume the rally from 185.43 to 208.09 high. this will now remain the favored case as long as 203.31 support holds, in case of retreat.
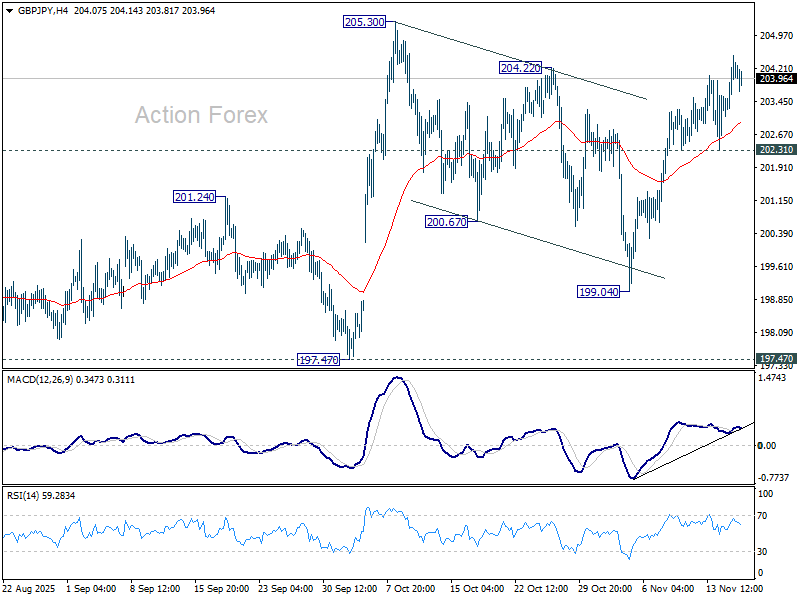
In the bigger picture, price actions from 208.09 (2024 high) are seen as a corrective pattern which might have completed at 184.35. Firm break of 208.09 high will resume the up trend from 123.94 (2020 low). Next target is 61.8% projection of 148.93 to 208.09 from 184.35 at 220.90. However, decisive break of 197.47 support will dampen this view and extend the corrective pattern with another fall.
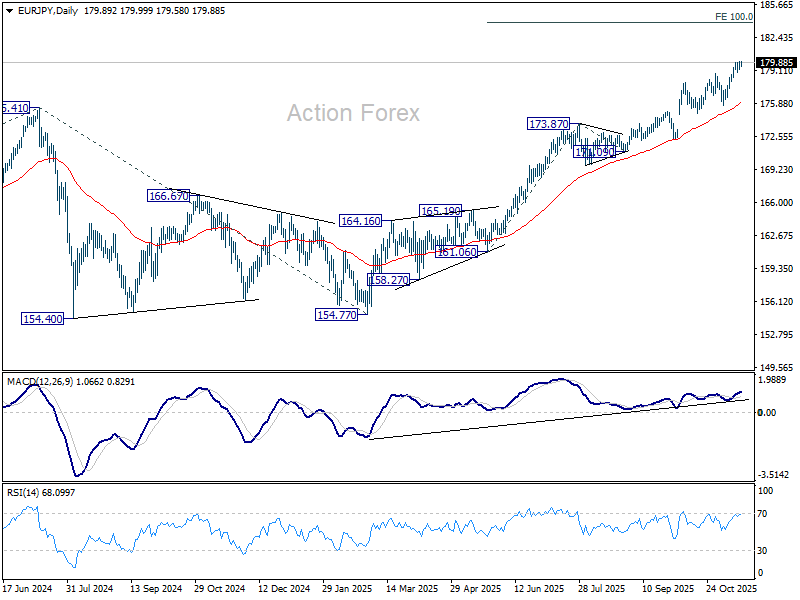
EUR/JPY Daily Outlook
Daily Pivots: (S1) 179.47; (P) 179.74; (R1) 180.23; More...
Intraday bias in EUR/JPY is back on the upside with breach of 179.95. Current rally should target 100% projection of 161.06 to 173.87 from 171.09 at 183.90 next. However, considering bearish divergence condition in 4H MACD, firm break of 178.95 support should confirm short term topping, and turn bias to the downside for 175.67 support.
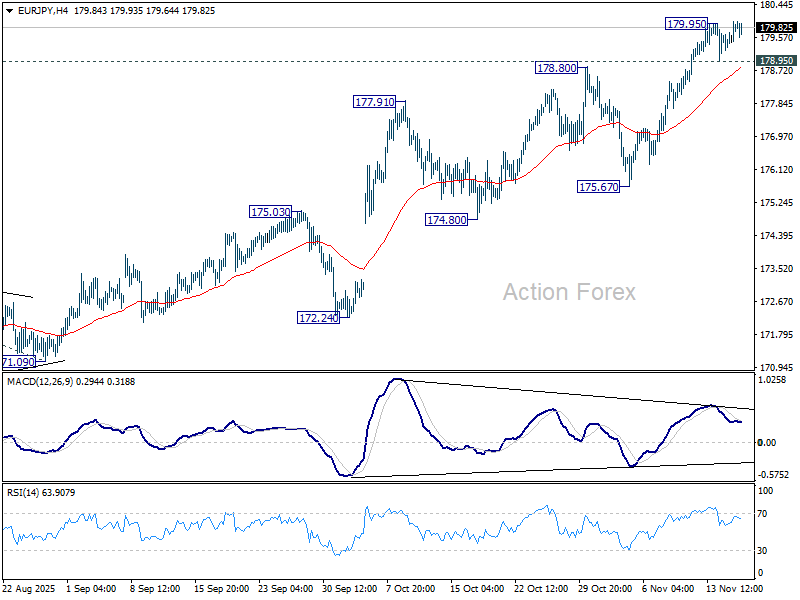
In the bigger picture, up trend from 114.42 (2020 low) is in progress and should target 61.8% projection of 124.37 to 175.41 from 154.77 at 186.31. Outlook will continue to stay bullish as long as 55 W EMA (now at 169.00) holds, even in case of deep pullback.
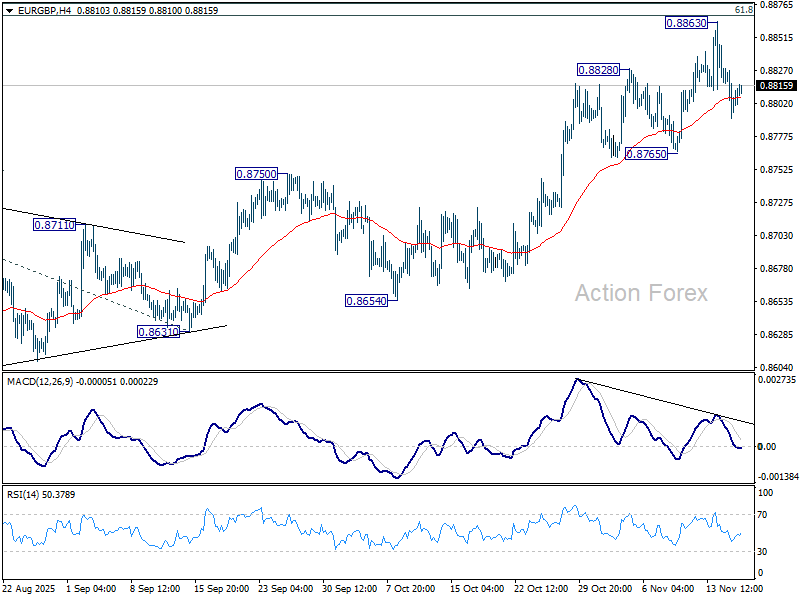
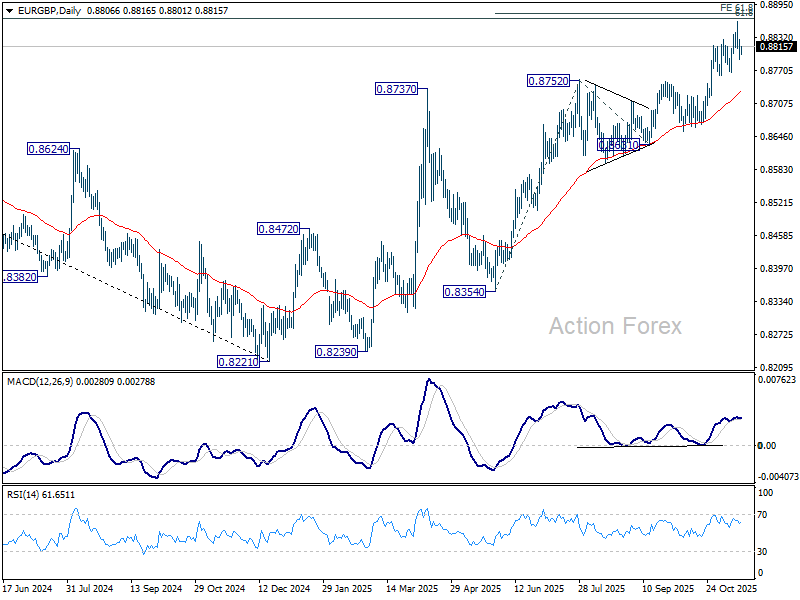
EUR/GBP Daily Outlook
Daily Pivots: (S1) 0.8791; (P) 0.8813; (R1) 0.8832; More…
Range trading continues in EUR/GBP and intraday bias stays neutral. Considering bearish divergence condition in 4H MACD, firm break of 0.8765 support will confirm short term topping. Deeper fall should then be seen back to 55 D EMA (now at 0.8731) even still as a correction. On the upside, however, sustained trading above 0.8867 fibonacci level will carry larger bullish implications. Next near term target will be 100% projection of 0.8354 to 0.8752 from 0.8631 at 0.9029.
In the bigger picture, rise from 0.8221 medium term bottom is still seen as a corrective move. Upside should be limited by 61.8% retracement of 0.9267 to 0.8221 at 0.8867. Sustained trading below 55 W EMA (now at 0.8589) should confirm that this corrective bounce has completed. However, decisive break of 0.8867 will suggest that EUR/GBP is already reversing whole decline from 0.9267 (2022 high). That should pave the way back to 0.9267.
EUR/AUD Daily Outlook
Daily Pivots: (S1) 1.7786; (P) 1.7829; (R1) 1.7894; More...
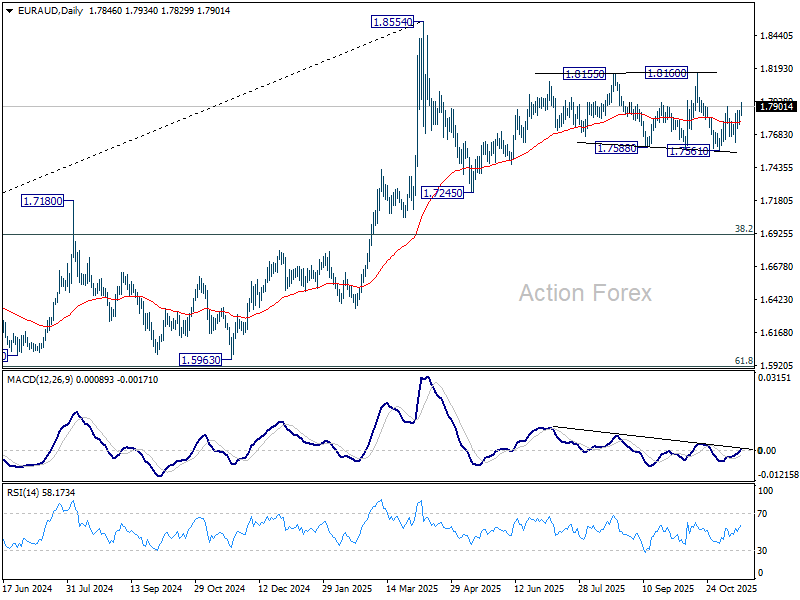
EUR/AUD's rebound from 1.7561 resumed by breaking through 1.7895. Intraday bias is back on the upside for 1.8160 resistance. Firm break there will resume the rally from 1.7245. On the downside, however, break of 1.7627 will turn bias back to the downside for 1.7561 support instead.
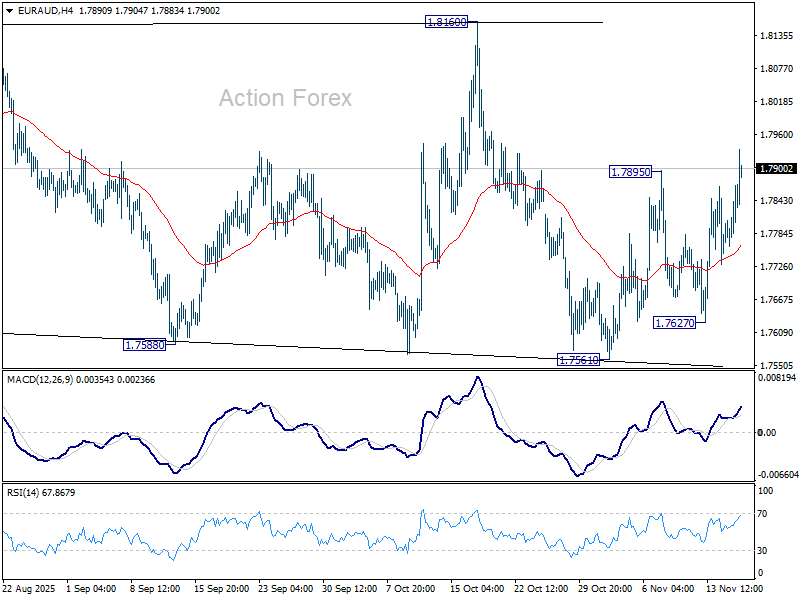
In the bigger picture, price actions from 1.8554 medium term top are seen as a corrective pattern. Sustained break of 55 W EMA (now at 1.7426) will suggest that it's correcting the whole rally from 1.4281 (2022 low). In this case, deeper decline would be seen to 38.2% retracement of 1.4281 to 1.8554 at 1.6922. Nevertheless, strong rebound from 55 W EMA will likely bring resumption of the up trend sooner.
EUR/CHF Daily Outlook
Daily Pivots: (S1) 0.9216; (P) 0.9224; (R1) 0.9235; More....
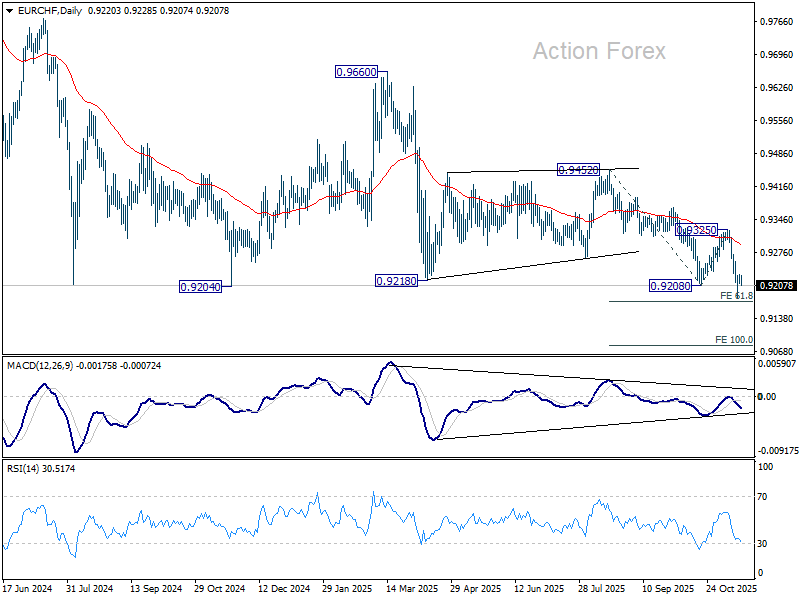
EUR/CHF is staying in consolidations above 0.9178 and intraday bias remains neutral. Upside of recovery should be limited below 0.9325 resistance to bring another fall. Firm break of 0.9178 will extend the larger down trend and target 100% projection of 0.9452 to 0.9208 from 0.9325 at 0.9082.
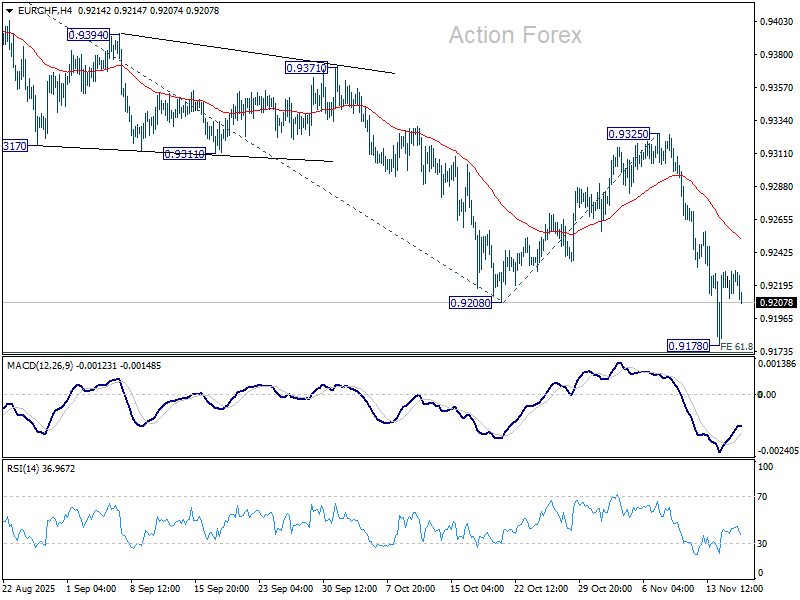
In the bigger picture, outlook remains bearish with EUR/CHF staying well inside long term falling channel after multiple rejection by 55 W EMA (now at 0.9377). Next target is 61.8% projection of 1.1149 to 0.9407 from 0.9928 at 0.8851. Break of 0.9452 resistance is needed to be the first sign of medium term bottoming. Otherwise, outlook will stay bearish in case of strong rebound.
AUD/USD Daily Report
Daily Pivots: (S1) 0.6510; (P) 0.6531; (R1) 0.6557; More...
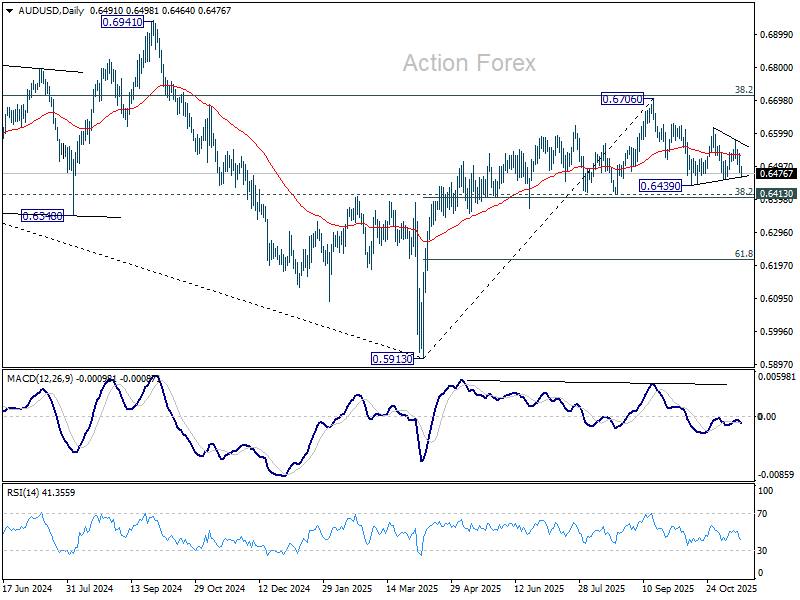
AUD/USD dives sharply today but still stays in range of 0.6457/6579. Intraday bias remains neutral first. On the downside, break of 0.6457 will target 0.6413 cluster (38.2% retracement of 0.5913 to 0.6706 at 0.6403). Decisive break there will carry larger bearish implications. On the upside, break of 0.6579 will bring stronger rise to 0.6616 resistance. Firm break there will target a retest of 0.6706 high.
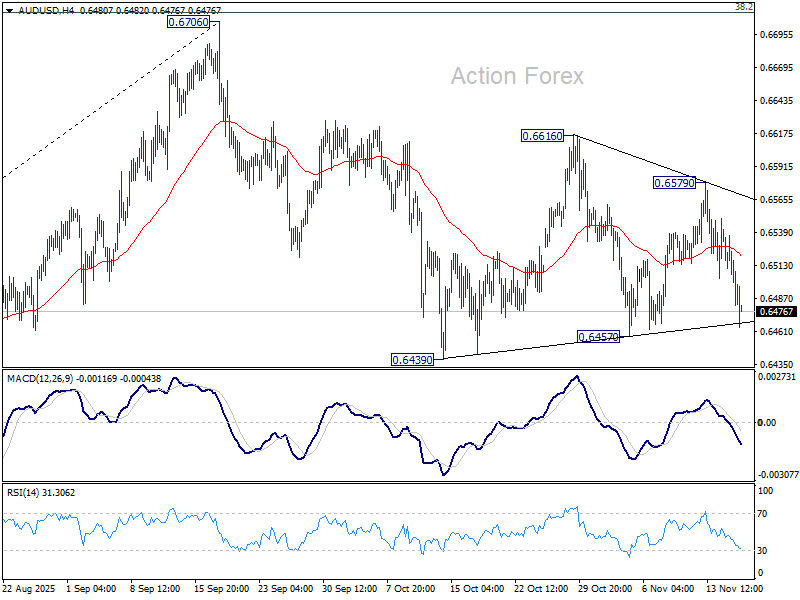
In the bigger picture, there is no clear sign that down trend from 0.8006 (2021 high) has completed. Rebound from 0.5913 is seen as a corrective move. Outlook will remain bearish as long as 38.2% retracement of 0.8006 to 0.5913 at 0.6713 holds. Break of 0.6413 support will suggest rejection by 0.6713 and solidify this bearish case. Nevertheless, considering bullish convergence condition in W MACD, sustained break of 0.6713 will be a strong sign of bullish trend reversal, and pave the way to 0.6941 structural resistance for confirmation.
USD/CAD Daily Outlook
Daily Pivots: (S1) 1.4028; (P) 1.4044; (R1) 1.4072; More...
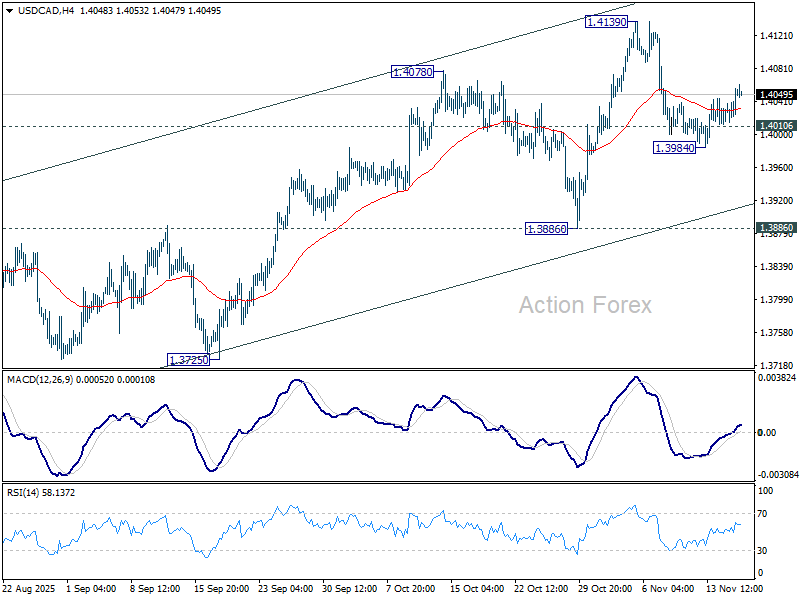
The extended rebound for 1.3984 suggests that pullback from 1.4139 has already completed. Intraday bias in USD/CAD is back on the upside for retesting 1.4139. Firm break there will resume the whole rally from 1.3538. On the downside through, below 1.4016 will resume the fall from 1.4139 through 1.3984 instead.
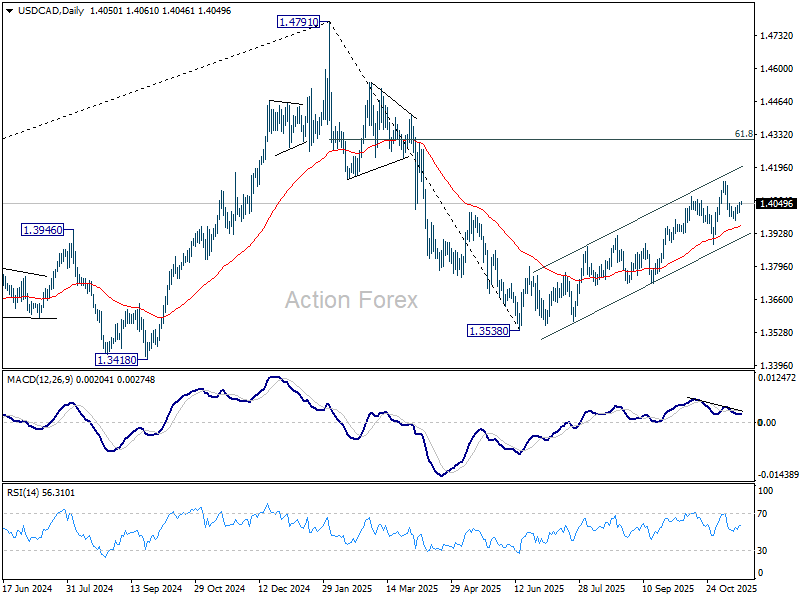
In the bigger picture, price actions from 1.4791 medium term top is likely just unfolding as a correction to up trend from 1.2005 (2021 low), with rise from 1.3538 as the second leg. A third leg should follow before up trend resumption. That is, range trading is set to extend for the medium term. For now, this will remain the favored case as long as 1.3886 support holds. However, firm break of 1.3886 will revive the case that fall from 1.4791 is indeed a larger scale correction.
EUR/USD Daily Outlook
Daily Pivots: (S1) 1.1576; (P) 1.1600; (R1) 1.1619; More…
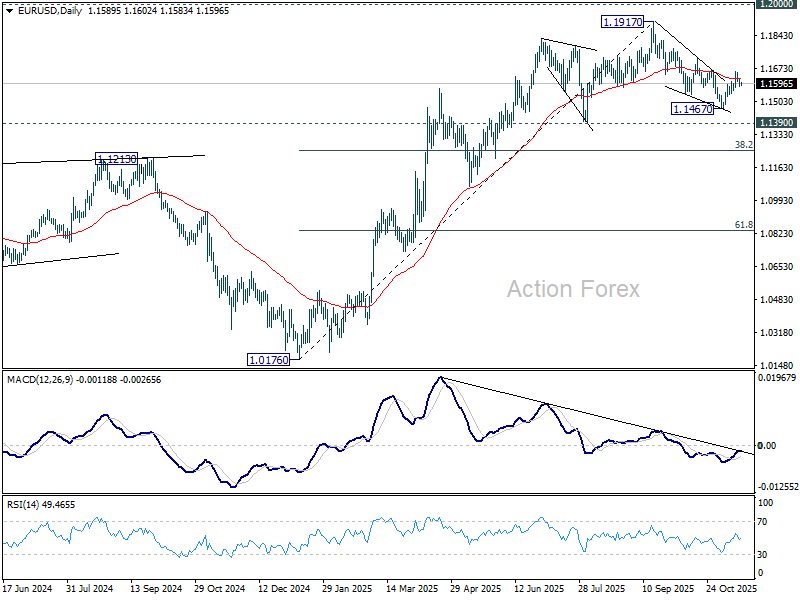
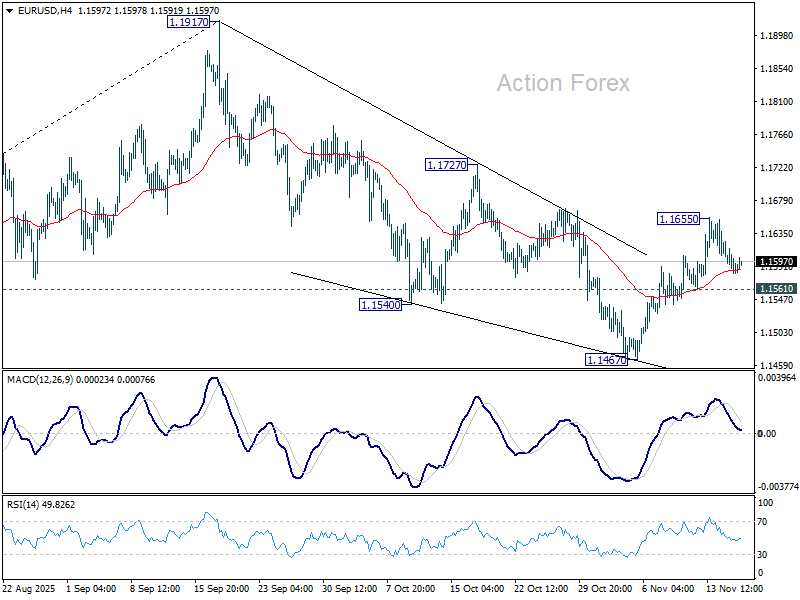
Intraday bias in EUR/USD remains neutral and outlook is unchanged. Fall from 1.1917 could have completed as a three wave correction at 1.1467. Above 1.1655 will target 1.1727 resistance first. Firm break there will solidify this bullish case and bring retest of 1.1917 high. However, break of 1.1561 will revive near term bearishness and target 1.1467 low instead.
In the bigger picture, considering bearish divergence condition in D MACD, a medium term top is likely in place at 1.1917, just ahead of 1.2 key psychological level. As long as 55 W EMA (now at 1.1328) holds, the up trend from 0.9534 (2022 low) is still in favor to continue. Decisive break of 1.2000 will carry larger bullish implications. However, sustained trading below 55 W EMA will argue that rise from 0.9534 has completed as a three wave corrective bounce, and keep long term outlook bearish.