
Sample Category Title
EU Autumn forecast: Eurozone growth upgraded, inflation easing ahead
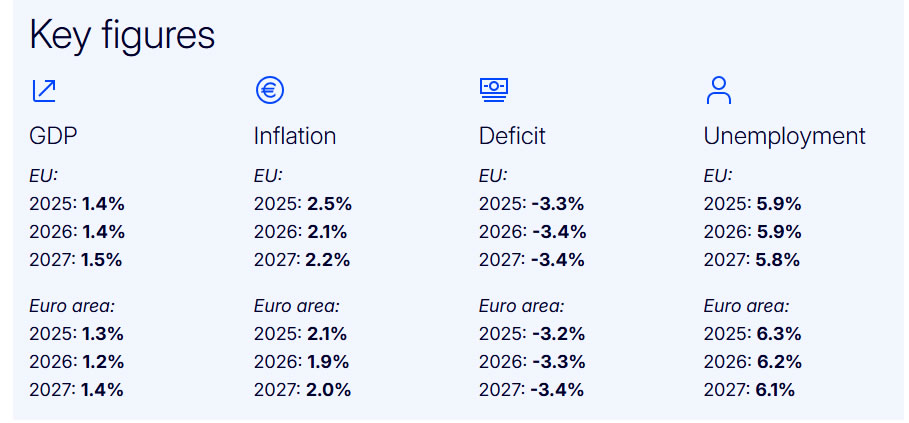
The European Commission’s Autumn forecast showed a firmer growth profile for the Eurozone, with 2025 GDP now expected to rise 1.3%—a notable upgrade from April’s 0.9%. Growth is set to dip only marginally to 1.2% in 2026 before accelerating to 1.4% in 2027. The Commission said early-year momentum, boosted by exports brought forward in anticipation of tariff increases, demonstrated the EU economy’s capacity to absorb external shocks.
On prices, the Commission sees inflation steadily moderating, falling to 2.1% in 2025 and 1.9% in 2026 after averaging 2.4% last year. It highlighted that inflation is “nearing the ECB target” and that financing conditions have improved meaningfully, creating a more supportive backdrop for consumption and investment.
Overall, the forecast pointed to modest but stable growth as the dominant theme for the coming years. Despite a complex global environment, the Commission believes the Eurozone is positioned for a gradual reacceleration, with cooling inflation and easier financial conditions helping anchor the recovery.
Gold (XAU/USD): 9% Dead Cat Bounce Rally at Risk of Reversal, Watch US$4,036 Downside Trigger
Key takeaways
- The recent 9% rally in gold (XAU/USD) from US$3,886 to US$4,245 is likely a short-term corrective rebound within a larger medium-term downtrend after the all-time high of US$4,381 on 20 October 2025.
- Rising 10-year US Treasury real yield, which broke above 1.77% and remains supported, increases the opportunity cost of holding gold, constraining its upside momentum.
- Short-term gold is at risk of a bearish breakdown below US$4,036, with key resistance at US$4,155; a break above this level could trigger a squeeze toward US$4,203/4,267.
The recent 9% rally seen in the gold (XAU/USD) from its 28 October 2025 low of US$3,886 to last Thursday, 13 November 2025, high of US$4,245 is likely a minor corrective rebound, aka “dead cat bounce”, within a larger medium-term corrective decline structure that the precious yellow metal is likely still undergoing after gold hit its current all-time high of US$4,381 on 20 October 2025.
Let’s break it down from a technical and intermarket analysis perspective.
10-year US Treasury real yield bullish breakout above 1.78%
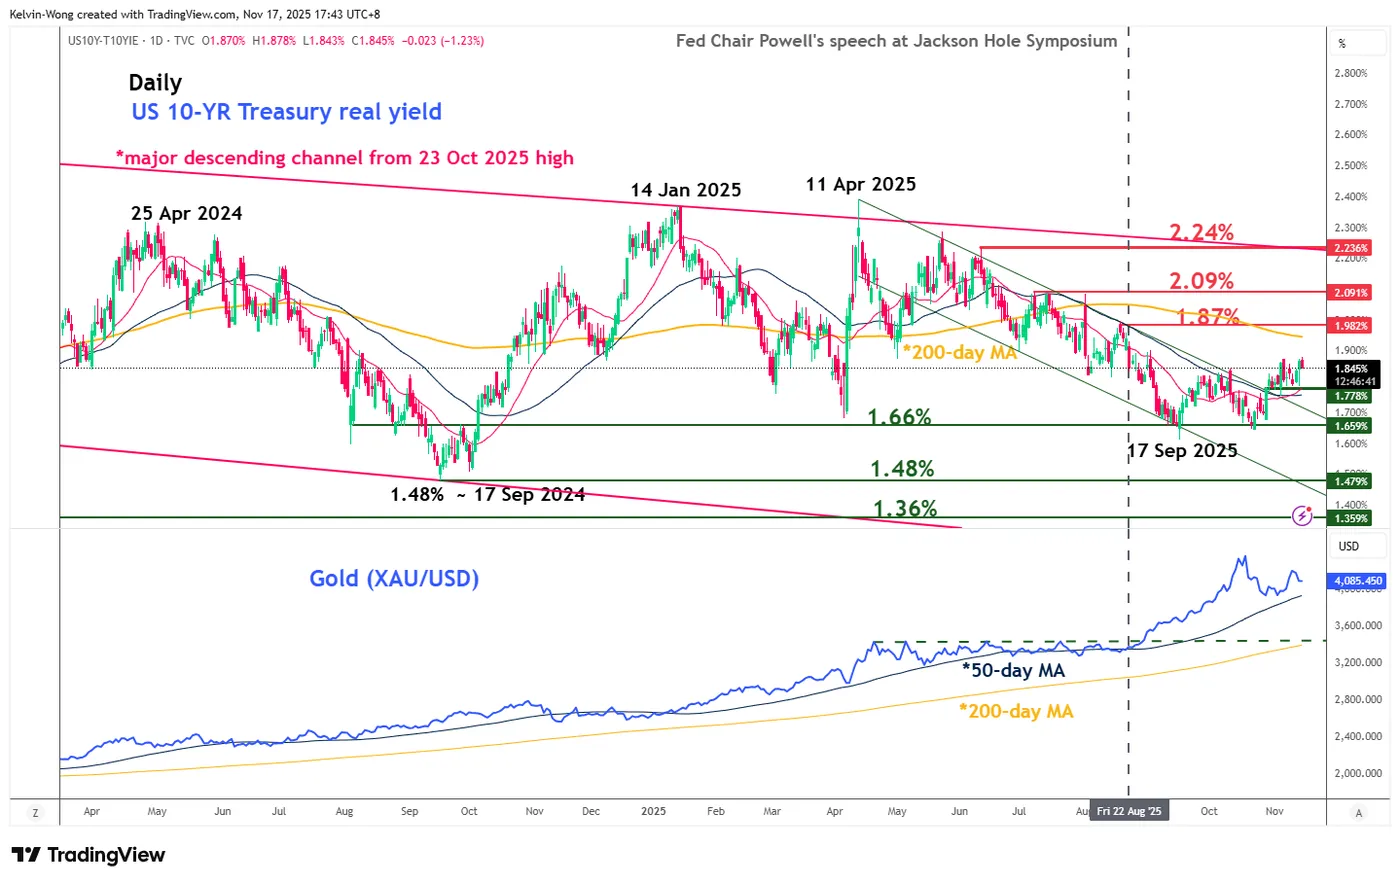
Fig. 1: 10-year US Treasury real yield medium-term & major trends as of 17 Nov 2025 (Source: TradingView)
The opportunity cost of holding gold, especially for leveraged speculative long positions, has increased in the past four weeks.
The 10-year US Treasury real yield has found medium-term support at 1.66% and broke decisively above its prior medium-term descending channel resistance at 1.77% on 30 October.
It has continued to trade firmly above 1.77% in the past two weeks, which coincides with the 20-day and 50-day moving averages.
These observations suggest that the 10-year US Treasury real yield has room for further upside within its major downtrend phase that is still intact below the major pivotal resistance of 2.24%, with the next medium-term resistances coming in at 1.87% and 2.09% (see Fig. 1).
A further rise in the 10-year US Treasury real yield raises the opportunity cost of holding gold, which could constrain upside momentum in the yellow metal.
Next, we outline the short-term trajectory for gold (XAU/USD) over the next 1 to 3 days, along with the key technical elements and levels to monitor.
Preferred trend bias (1-3 days) – At risk of bearish breakdown below US$4,036
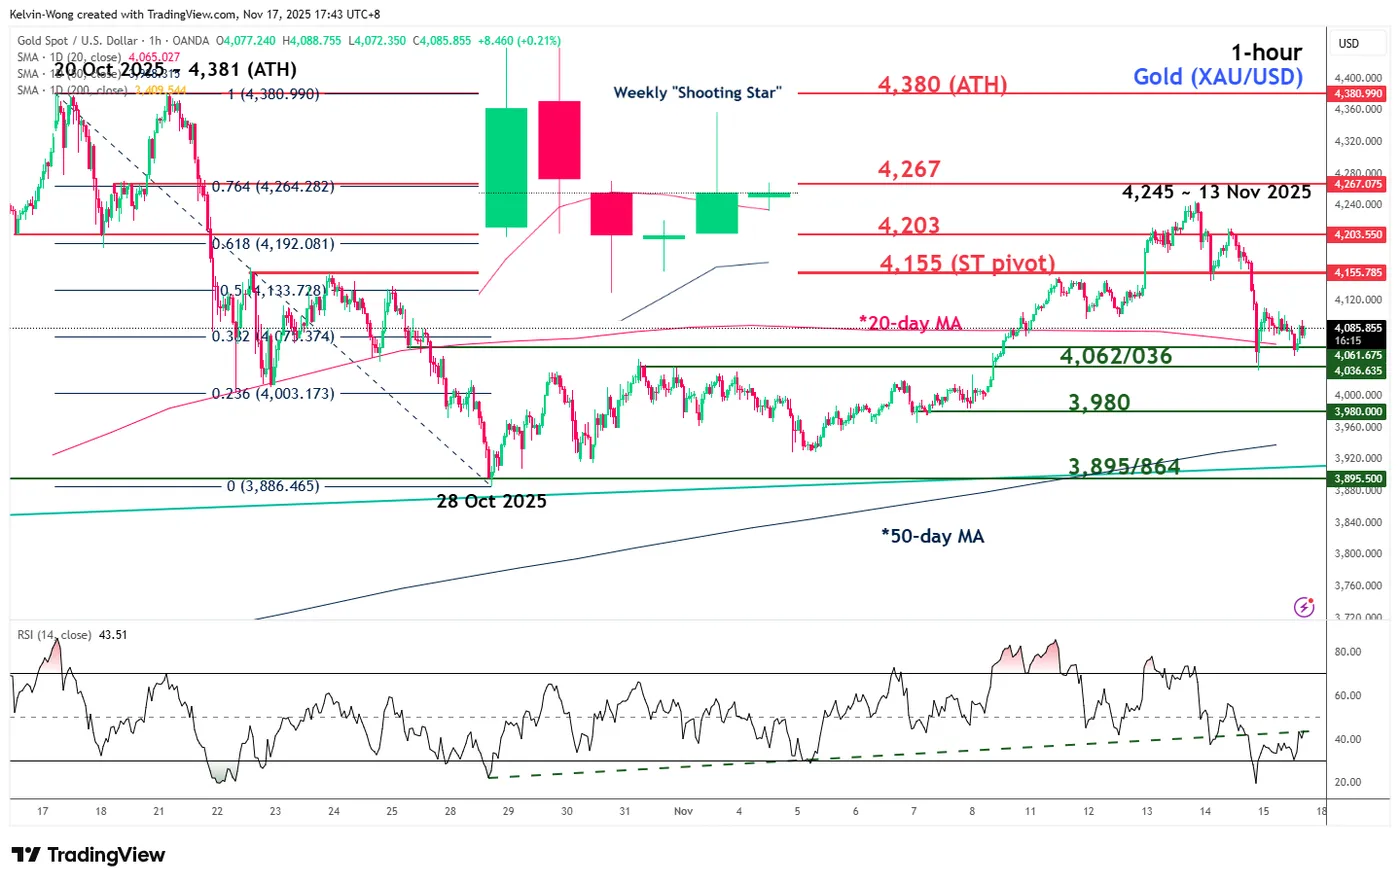
Fig. 2: Gold (XAU/USD) minor trend as of 17 Nov 2025 (Source: TradingView)
Short-term pivotal resistance for gold (XAU/USD) stands at US$4,155, and a break below US$4,036 is likely to unleash the second leg of its medium-term corrective decline phase to expose the next intermediate supports at US$3,980 and US$3,895/3,864 in the first step (see Fig. 2).
Key elements
- Gold (XAU/USD) has staged a bearish reversal on last Friday, 14 November, and ended the week with a weekly bearish “Shooting Star” candlestick pattern.
- Before the bearish reversal occurred last Friday, the hourly RSI momentum indicator of gold (XAU/USD) had traced out a bearish divergence condition at its overbought region (above the 70 level) on Thursday, 13 November.
- These observations indicate that the 9% rally in gold (XAU/USD) from the 28 October 2025 low to the 13 November 2025 high lacks the momentum needed to trigger a sustained bullish impulsive move.
Alternative trend bias (1 to 3 days)
On the other hand, a clearance above US$4,155 key resistance invalidates the bearish scenario for a squeeze up towards the next intermediate resistances at US$4,203 and US$4,267.
Gold Price Balanced Amid Heightened Uncertainty
As the XAU/USD chart shows, last week gold prices fell sharply, interrupting the previous upward trend. This decline was driven by two main factors:
→ End of the US government shutdown. This is believed to have reduced short-term economic risks and lessened demand for gold as a “safe-haven” asset.
→ Hawkish statements from Federal Reserve officials, which lowered market expectations for rate cuts. This pushed up US Treasury yields, traditionally putting downward pressure on non-yielding assets like gold.
This week, the market is awaiting a wave of delayed US economic reports that were postponed during the shutdown, including:
→ Labour market data (Non-Farm Payrolls)
→ Inflation data (CPI)
These releases are expected to give traders greater clarity on the future trajectory of Fed interest rates.
Technical Analysis of XAU/USD
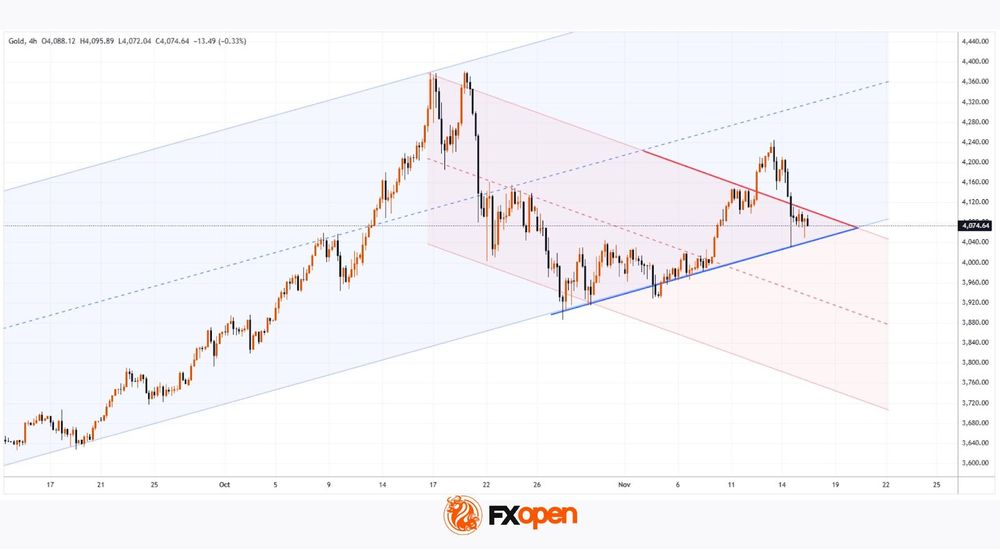
From a technical perspective, the price is currently trading at the intersection of two key lines:
→ Resistance line from the upper boundary of the descending channel originating at the all-time high. Buyers attempted to break through this level last week but were unsuccessful.
→ Support line from the lower boundary of the ascending channel, in place since early autumn.
Given the above, it is reasonable to suggest that:
→ the market is in a balanced position, with traders adopting a wait-and-see approach;
→ a breakout from the symmetrical triangle could indicate the direction of the next significant move in gold prices.
Start trading commodity CFDs with tight spreads. Open your trading account now or learn more about trading commodity CFDs with FXOpen.
This article represents the opinion of the Companies operating under the FXOpen brand only. It is not to be construed as an offer, solicitation, or recommendation with respect to products and services provided by the Companies operating under the FXOpen brand, nor is it to be considered financial advice.
Crypto Set for Short-Term Rebound, Not Full Recovery
Market Overview
The crypto market cap has lost 9.5% over the past seven days. The decline took place on weekdays last week, with the level stabilising around $3.25 trillion over the weekend. Among altcoins, the standout is the unsinkable Zcash at $700, nearing its highs, and weak Solana and Ethereum, which have lost 45% and 40% from their August and September highs, respectively.
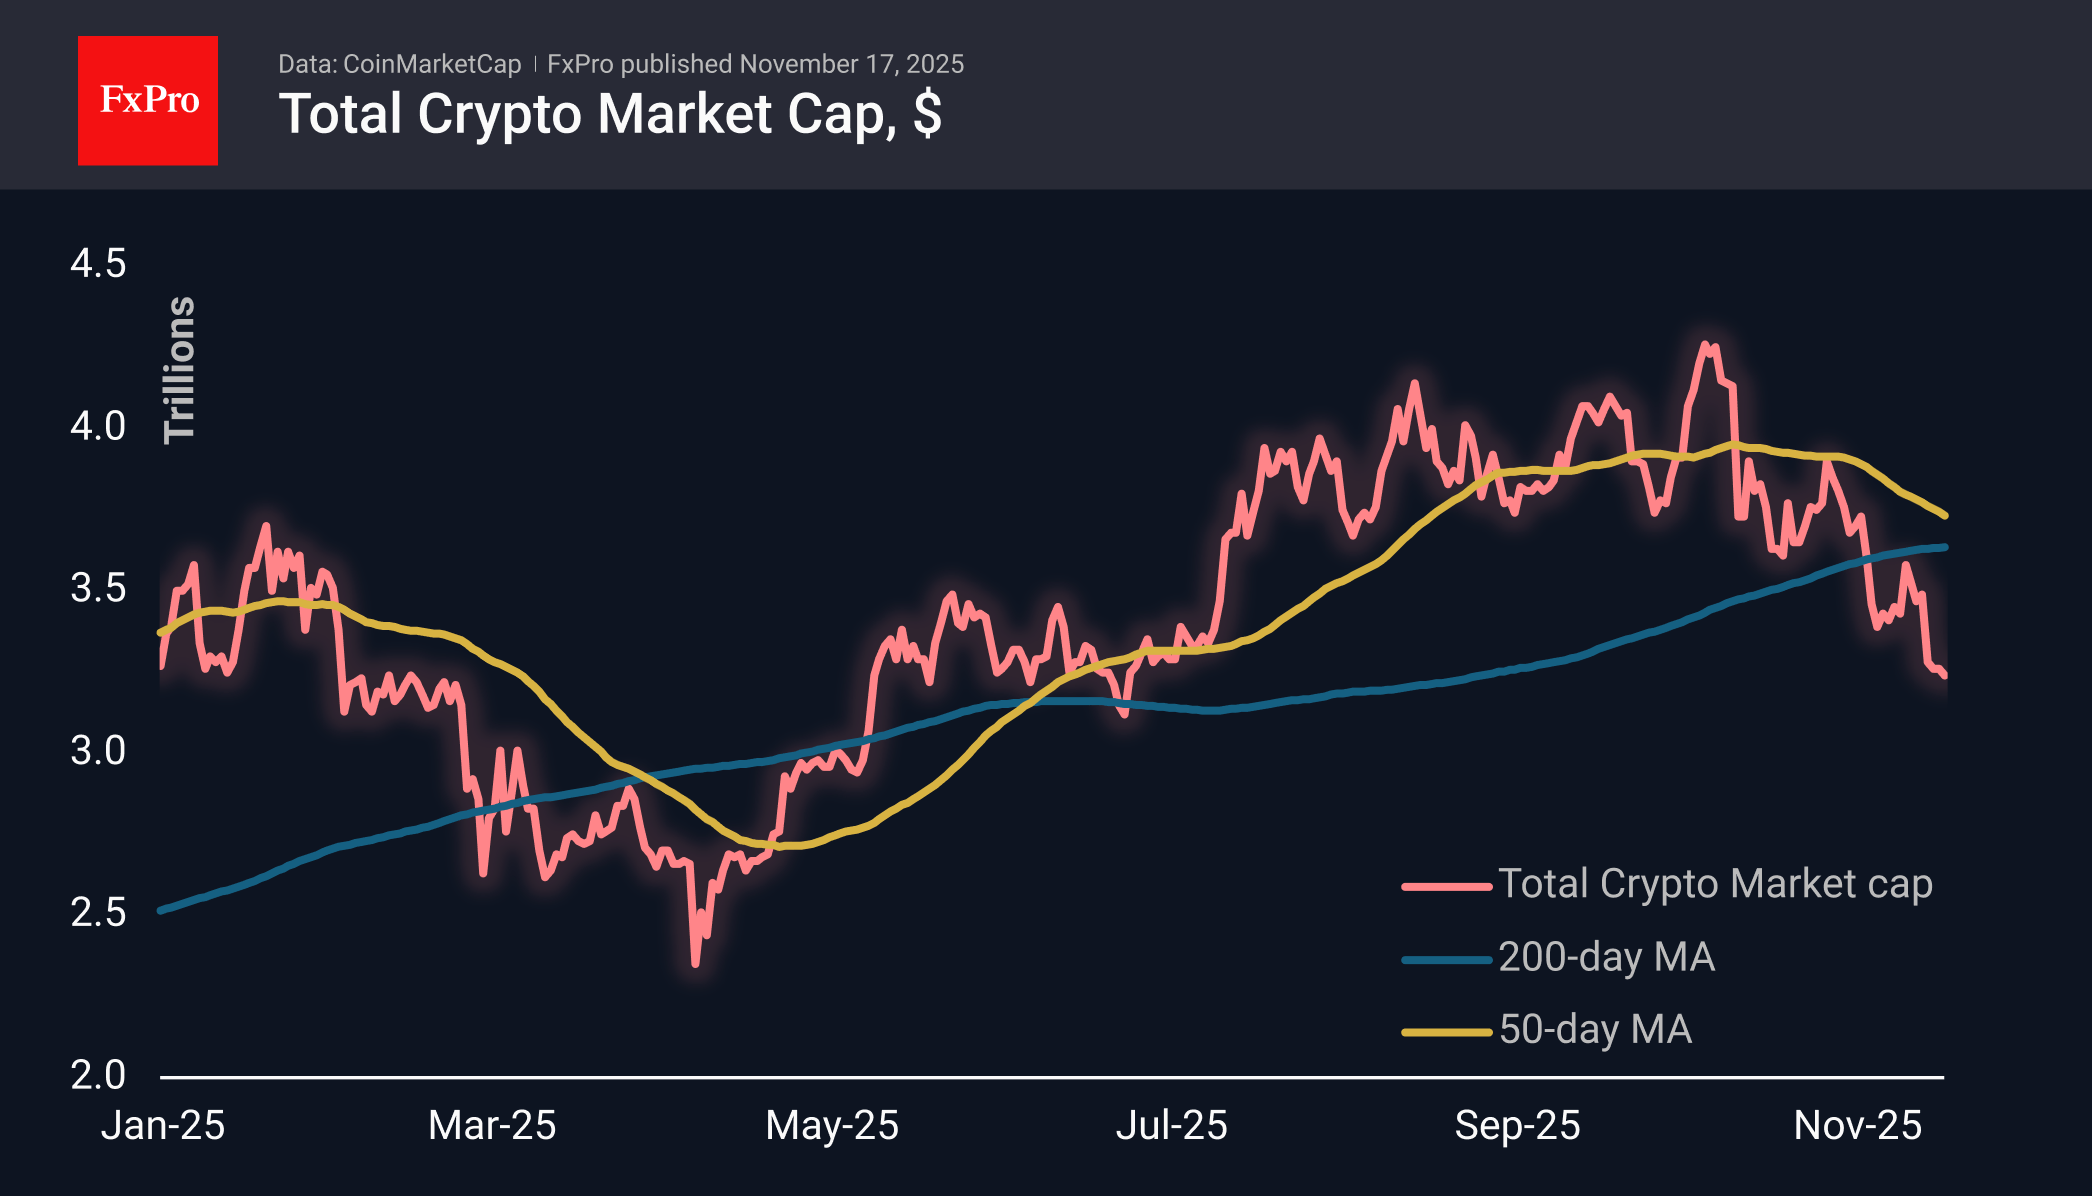
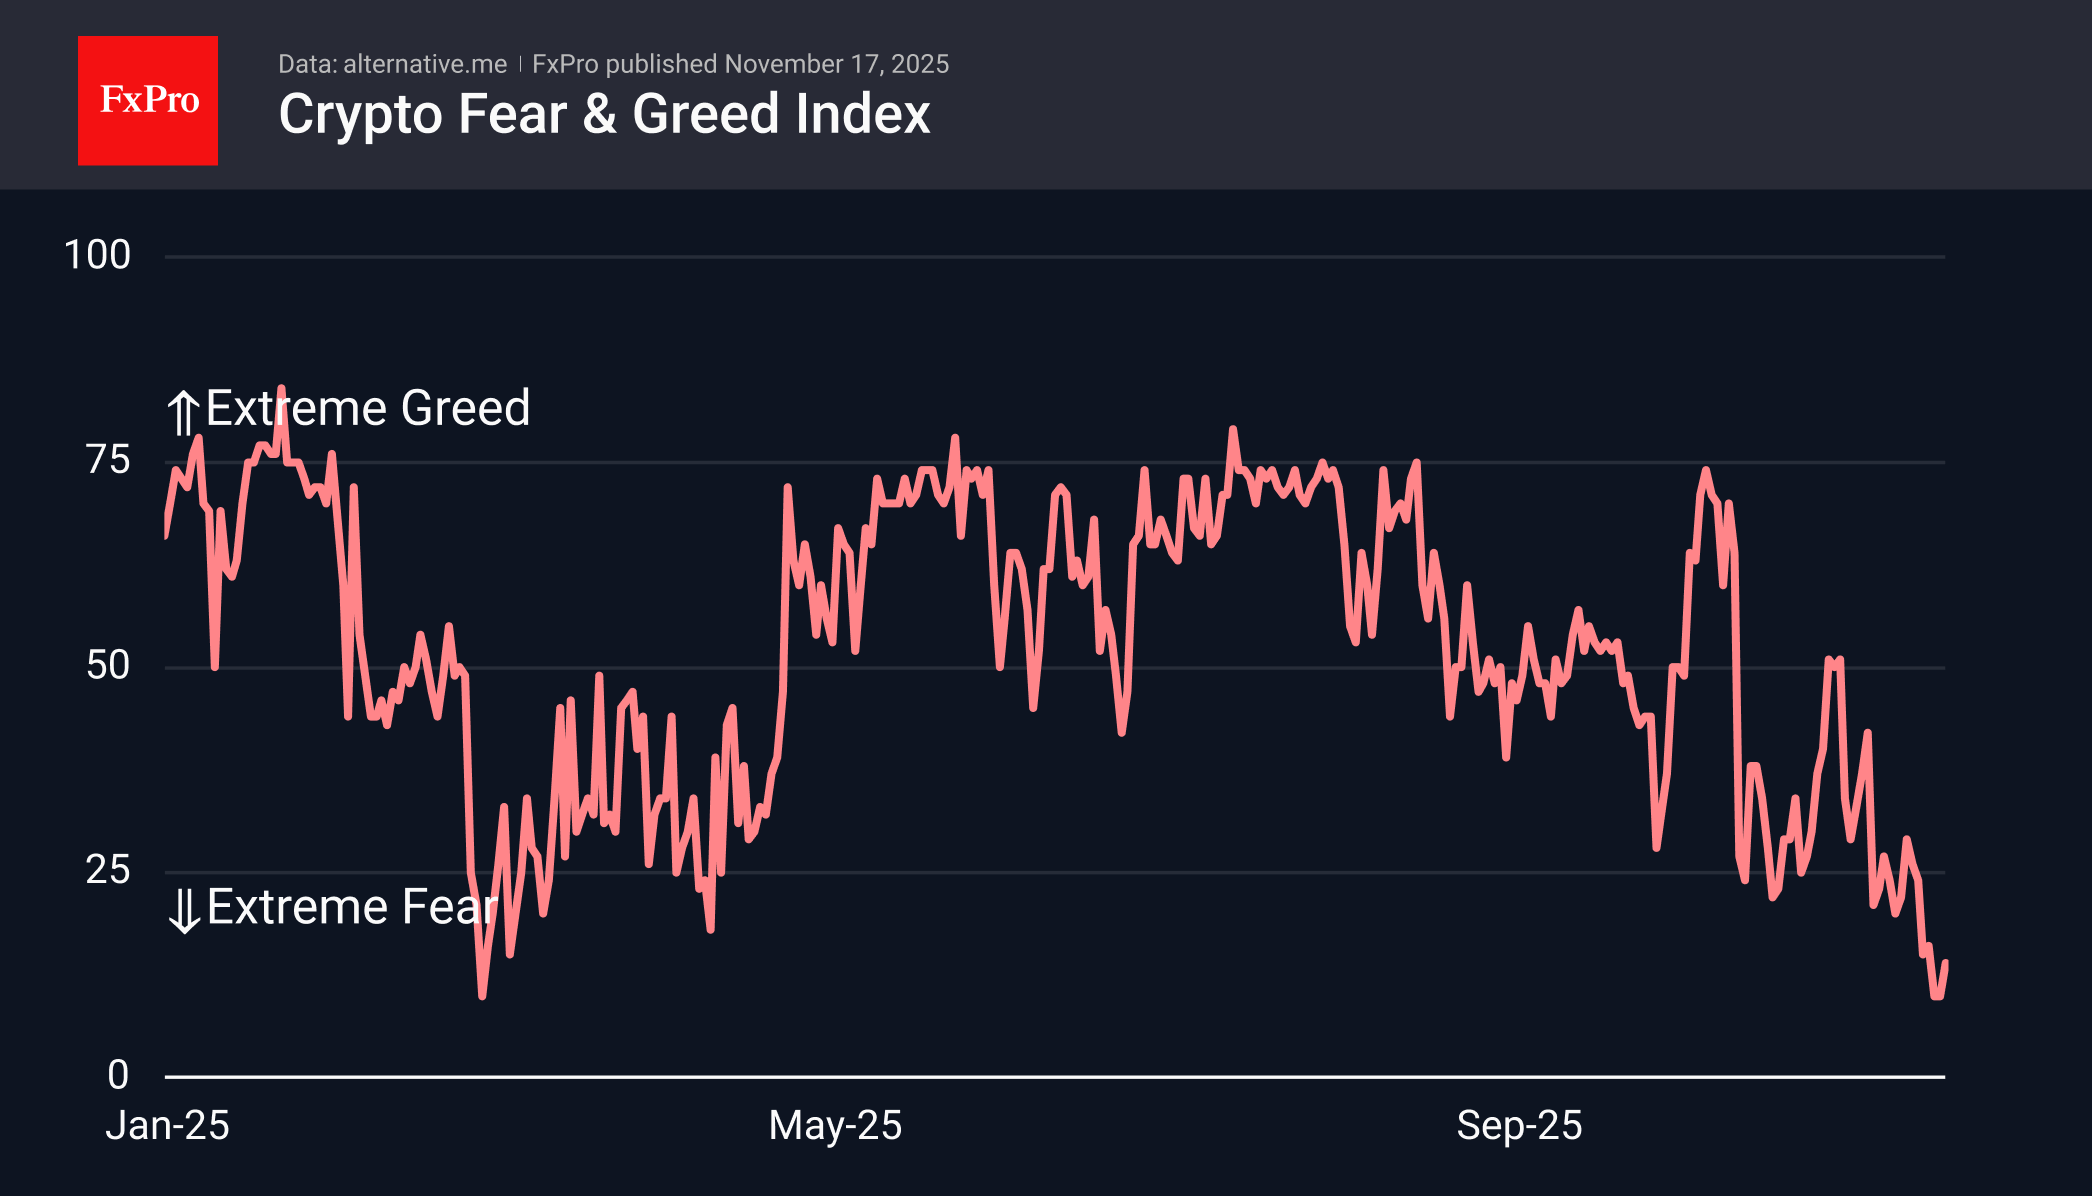
The crypto sentiment index recorded values of 10 on Saturday and Sunday, marking a return to the lows of late February this year. Although this was a good point to buy on the rebound in the following days, the downward trend continued for almost a month and a half. Market dynamics since the beginning of October have been reminiscent of those seen at the end of January. This is good news for short-term buyers but may cause medium-term buyers to stay on the sidelines for a while.
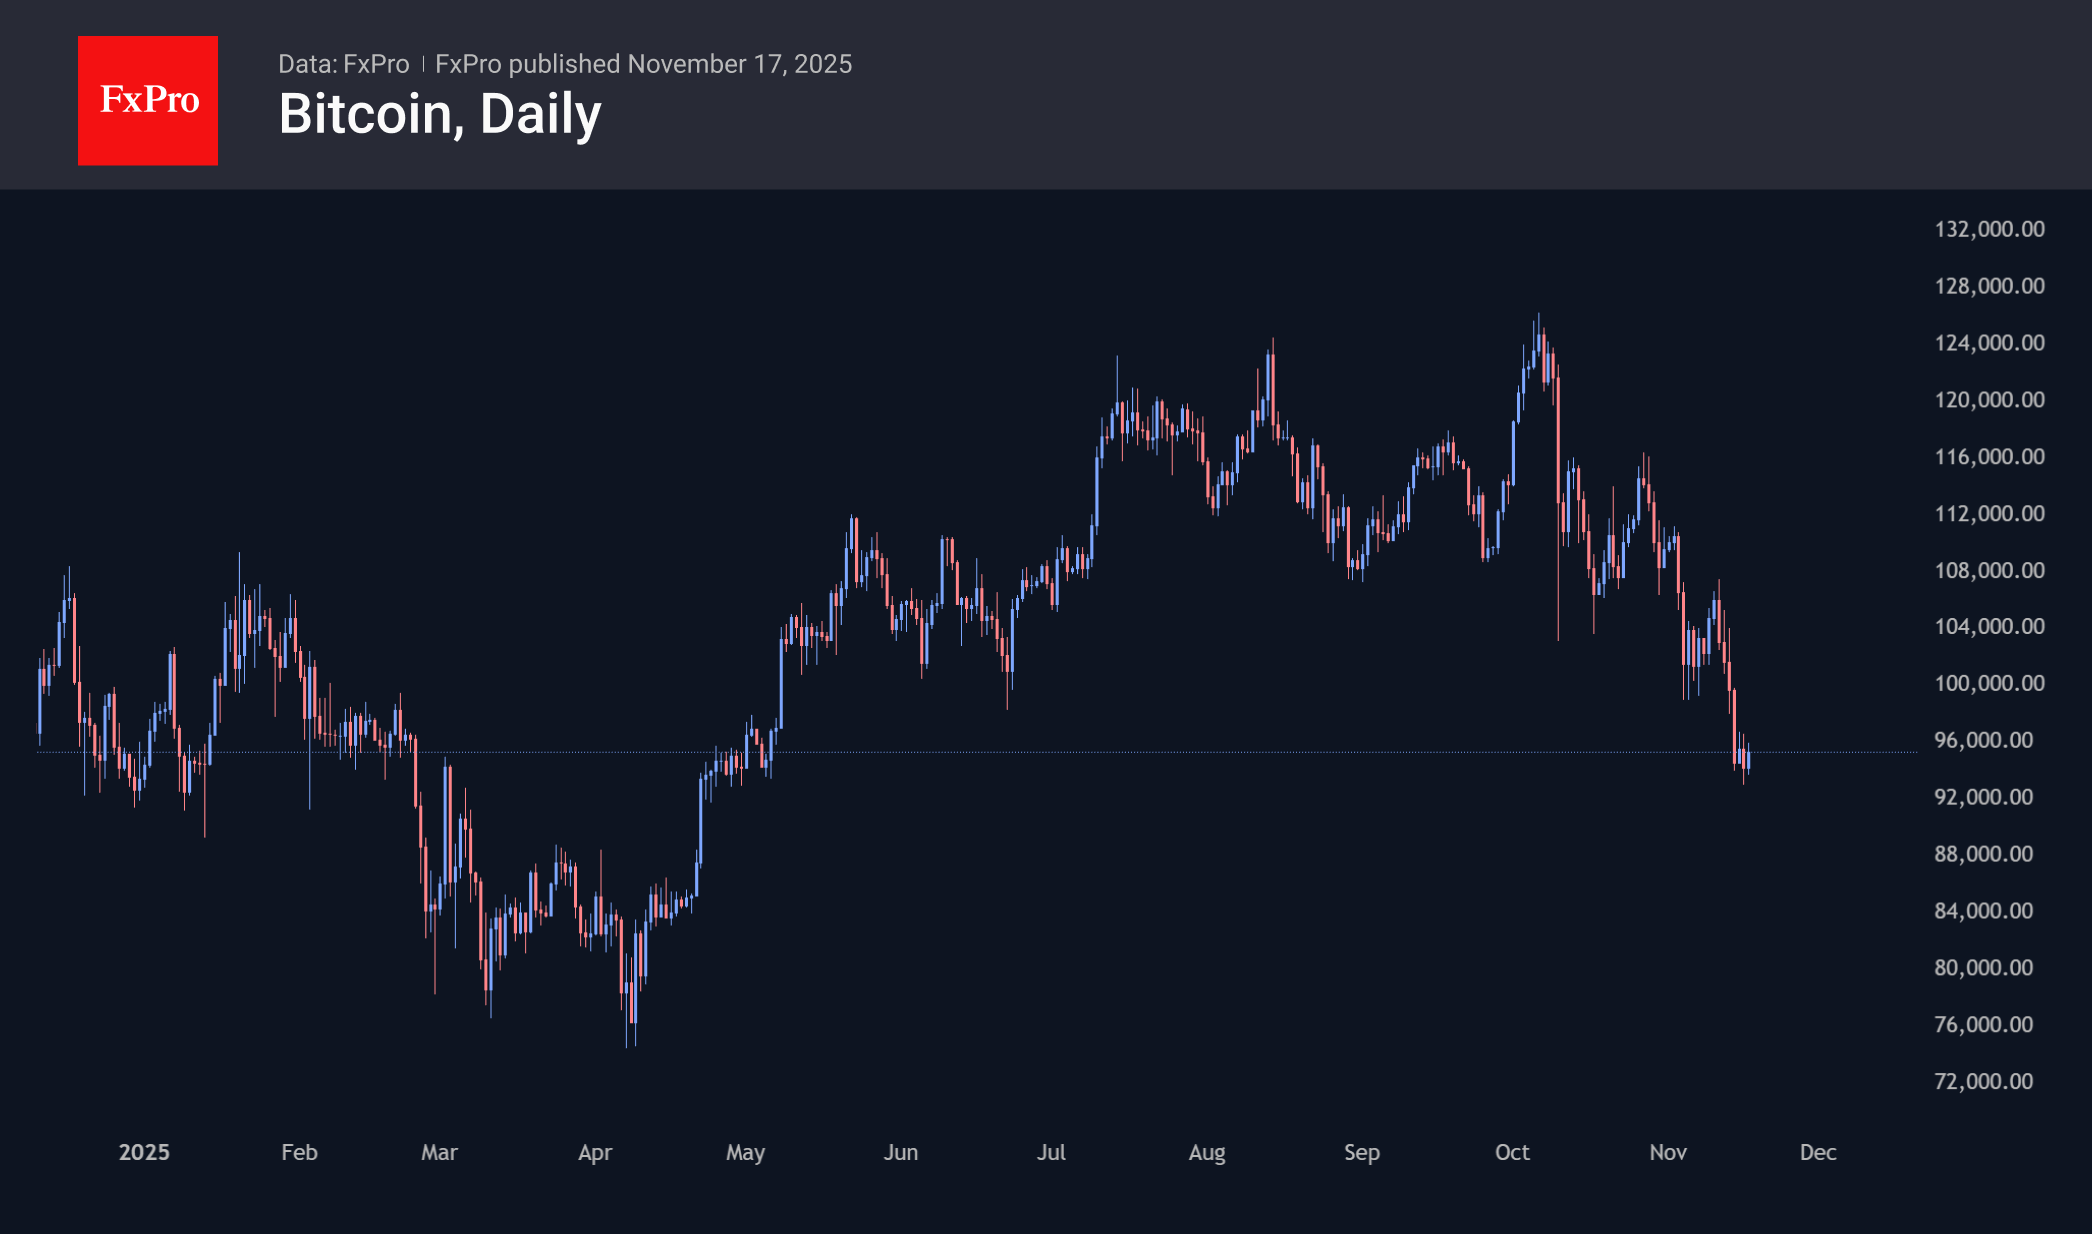
Bitcoin slipped below $93K during illiquid trading early in the day, but found impressive buyer interest there, rising to $95.6K. Whether this is a short-term rebound or the beginning of a recovery can only be determined after it consolidates above $100,000. There is a high chance that the strategy of selling on rebounds will remain prevalent.
News Background
Outflows from spot Bitcoin ETFs in the US continue for the third week in a row. According to SoSoValue, net outflows from spot BTC ETFs totalled $1.11 billion last week, slightly lower than the previous week’s outflows, resulting in a total inflow of $58.85 billion into these products since January 2024.
Net outflows from spot Ethereum ETFs in the US continue for the second week in a row, amounting to $728.6 million. The cumulative net inflow since the launch of ETFs in July 2024 has fallen to $13.13 billion.
Inflows into the recently launched Solana spot ETFs in the US have continued for the third consecutive week, totalling $382.1 million. However, during this time, the price has fallen by a third, reinforcing the idea that entering traditional financial markets does not necessarily promise price growth.
Long-term Ethereum holders have increased their sales to 45,000 ETH per day, the highest level since February 2021, according to Glassnode. Long-term Bitcoin holders are also actively selling their holdings. According to CryptoQuant, they have dumped 815,000 BTC on the market over the past month.
Miner Bitfarms has announced a gradual phase-out of Bitcoin mining and a transition to developing infrastructure for artificial intelligence. The company reported a net loss of $46 million in its third-quarter report.
USD/JPY Extends Gains as Japanese Government Advocates for Dovish Policy
The USD/JPY pair advanced to 154.72 on Monday, trading near its highest levels since February, despite the release of Japanese economic data that surpassed forecasts.
Japan's GDP contracted by 0.4% quarter-on-quarter in Q3 2025, a reversal from the 0.6% growth recorded in Q2. However, this outcome was better than the 0.6% decline anticipated by economists.
The yen's weakness persists primarily due to Prime Minister Sanae Takaichi's public call for the Bank of Japan (BoJ) to maintain its ultra-low interest rate policy. The government believes this accommodative stance is essential to underpin economic growth and support a gradual rise in inflation.
This puts the government at odds with the central bank. BoJ Governor Kazuo Ueda struck a more balanced tone, noting that consumption remains stable amid rising household incomes and a tight labour market. He observed that core inflation is steadily approaching the 2% target, a development that would justify an early policy tightening.
This creates a visible and rare public imbalance between the dovish government's fiscal priorities and the central bank's potential inclination towards monetary normalisation.
Technical Analysis: USD/JPY
H4 Chart:
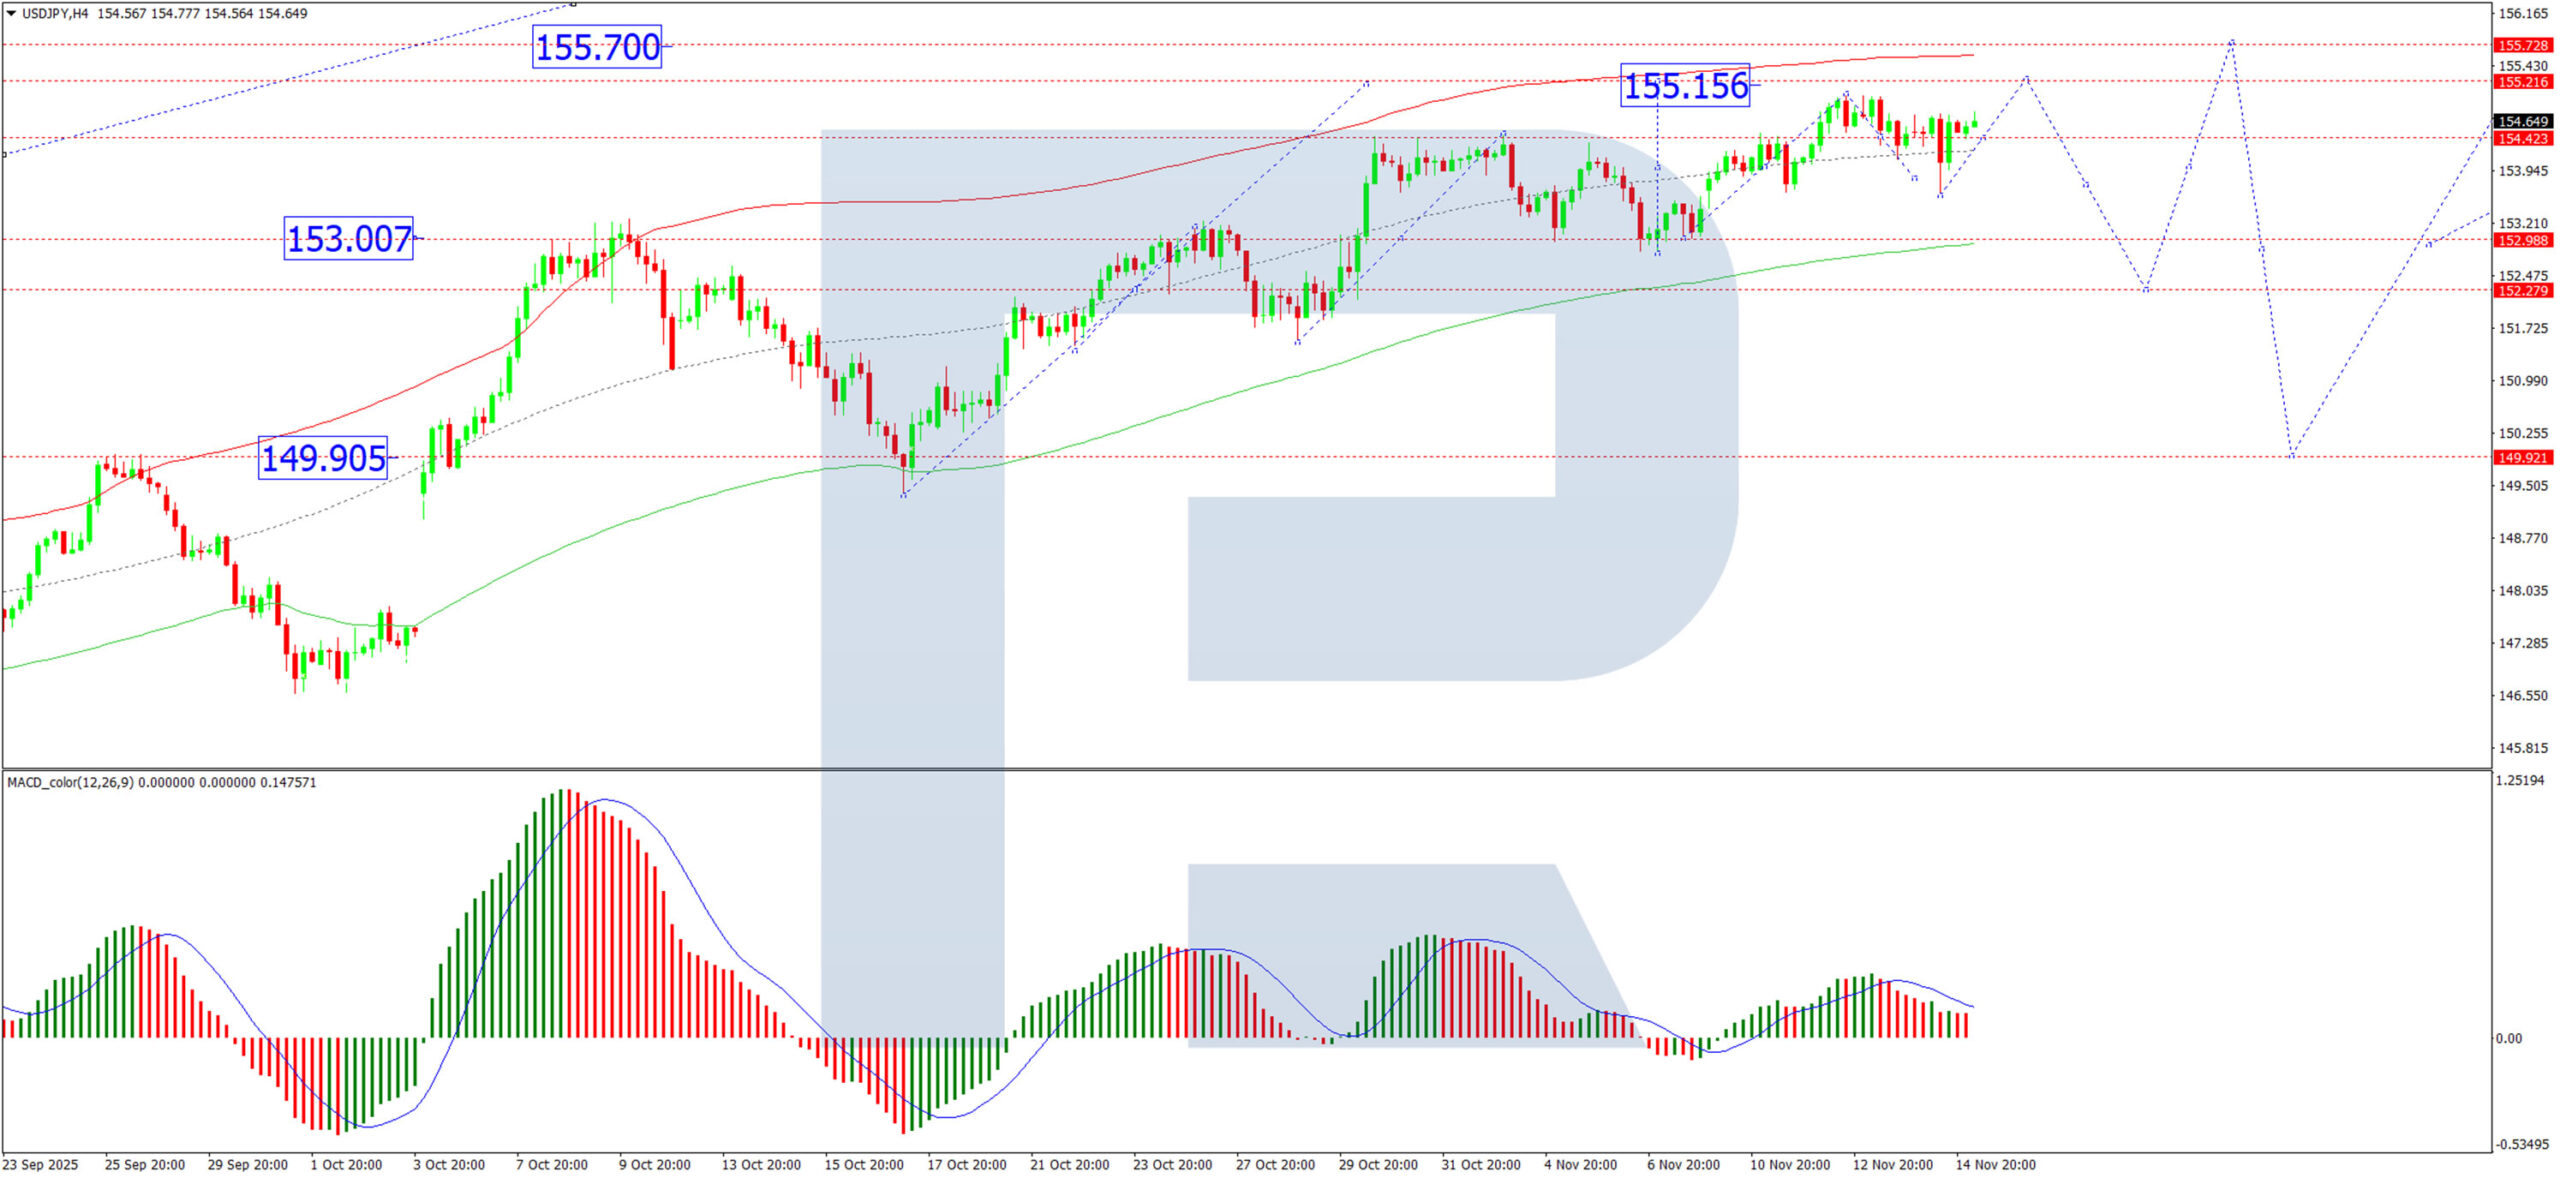
On the H4 chart, USD/JPY completed a growth wave to 155.00 and a subsequent correction to 153.63. The pair is now forming a tight consolidation range around this support level. An upward breakout from this range is expected to initiate the next leg of the rally, targeting 155.15 as an initial objective. This bullish scenario is confirmed by the MACD indicator, whose signal line is positioned above zero and pointing firmly upwards, indicating sustained positive momentum.
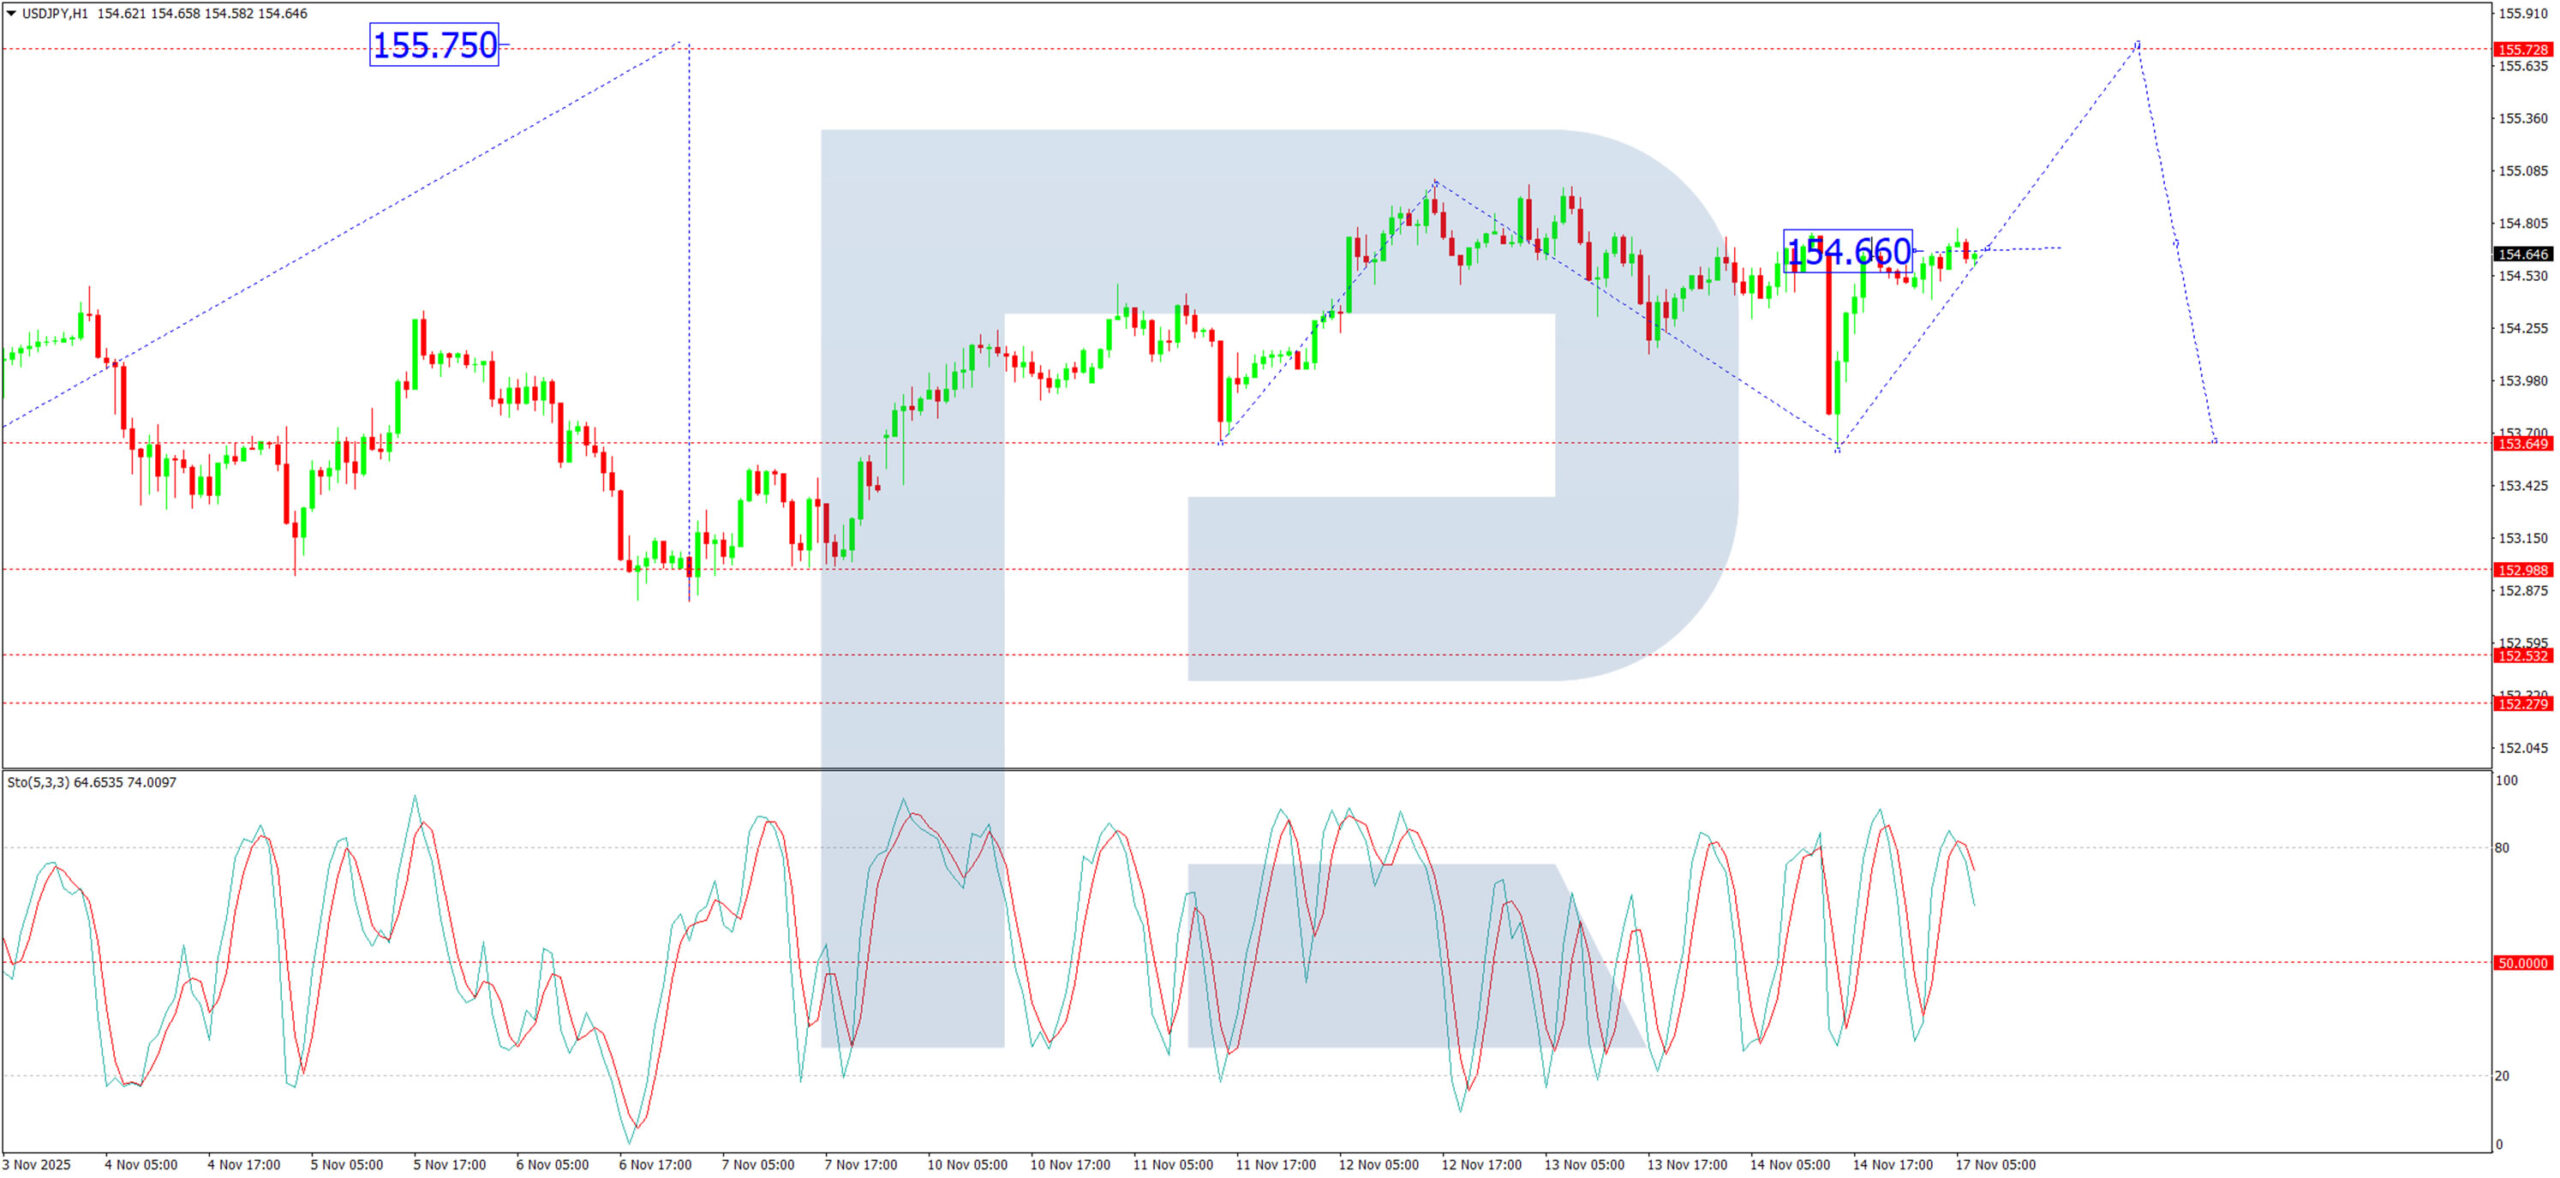
H1 Chart:
On the H1 chart, the pair reached a local high at 155.00 and completed a corrective structure to 153.63. A fresh growth impulse to 154.66 has since been completed, forming a new compact consolidation range. An upward breakout from this range is anticipated, opening the path for a move towards a minimum target of 155.75. The Stochastic oscillator supports this outlook. Its signal line is above 50 and rising sharply towards 80, reflecting strong short-term bullish momentum.
Conclusion
USD/JPY continues to climb, driven by a fundamental divergence between a dovish Japanese government and the BoJ, which is cautiously laying the groundwork for a future rate hike. Technically, the structure remains firmly bullish. The completion of the recent correction suggests the pair is poised for further gains, with immediate targets at 155.15 and 155.75.
Disclaimer:
Any forecasts contained herein are based on the author’s particular opinion. This analysis may not be treated as trading advice. RoboForex bears no responsibility for trading results based on trading recommendations and reviews contained herein.
AUD/USD and NZD/USD Hold Ground as Markets Watch Fresh Upside
AUD/USD started a fresh increase above 0.6500 and 0.6550. NZD/USD is also rising and might aim for more gains above 0.5700.
Important Takeaways for AUD USD and NZD USD Analysis Today
- The Aussie Dollar started a decent increase above 0.6500 against the US Dollar.
- There is a key bullish trend line forming with support at 0.6510 on the hourly chart of AUD/USD at FXOpen.
- NZD/USD is consolidating gains above the 0.5645 pivot level.
- There is a major bullish trend line forming with support at 0.5655 on the hourly chart of NZD/USD at FXOpen.
AUD/USD Technical Analysis
On the hourly chart of AUD/USD at FXOpen, the pair started a fresh increase from 0.6500. The Aussie Dollar was able to clear 0.6550 to move into a positive zone against the US Dollar.
There was a close above 0.6500 and the 50-hour simple moving average. Finally, the pair tested 0.6580. A high was formed near 0.6580 and the pair recently started a short-term downside correction. There was a minor decline below 0.6550.
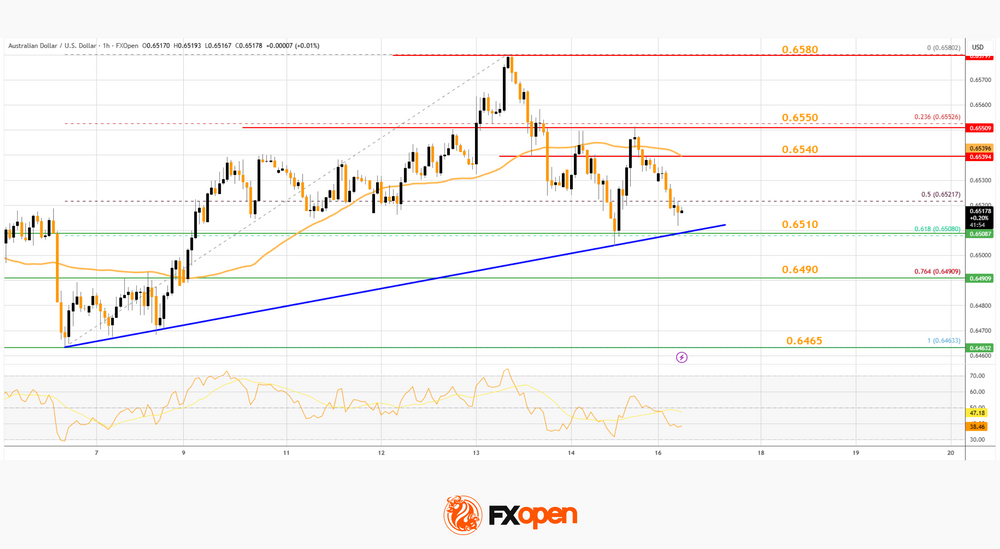
There was a move below the 50% Fib retracement level of the upward move from the 0.6463 swing low to the 0.6580 high. On the downside, initial support is near a key bullish trend line at 0.6510 and the 61.8% Fib retracement.
The next area of interest could be 0.6490. If there is a downside break below 0.6490, the pair could extend its decline toward the 0.6465 zone. Any more losses might signal a move toward 0.6420.
On the upside, the AUD/USD chart indicates that the pair is now facing resistance near 0.6540 and the 50-hour simple moving average. The first major hurdle for the bulls might be 0.6550. An upside break above 0.6550 might send the pair further higher. The next stop is near 0.6580. Any more gains could clear the path for a move toward 0.6620.
NZD/USD Technical Analysis
On the hourly chart of NZD/USD on FXOpen, the pair started a fresh increase from 0.5600. The New Zealand Dollar broke the 0.5650 barrier to start the recent rally against the US Dollar.
The pair settled above 0.5650 and the 50-hour simple moving average. It tested 0.5690 and is currently consolidating gains. There was a minor pullback below 0.5670 and the 23.6% Fib retracement level of the upward move from the 0.5606 swing low to the 0.5691 high.
The NZD/USD chart suggests that the RSI is now below 50. On the downside, immediate support is near the 0.5655 level and a major bullish trend line. The first key zone for the bulls sits at 0.5645 and the 50% Fib retracement.
The next key level is 0.5625. If there is a downside break below 0.5625, the pair might slide toward 0.5605. Any more losses could lead NZD/USD into a bearish zone to 0.5550.
On the upside, the pair might struggle near 0.5670. The next major resistance is near the 0.5690 level. A clear move above 0.5690 might even push the pair toward 0.5740. Any more gains might clear the path for a move toward the 0.5800 handle in the coming days.
Trade over 50 forex markets 24 hours a day with FXOpen. Take advantage of low commissions, deep liquidity, and spreads from 0.0 pips. Open your FXOpen account now or learn more about trading forex with FXOpen.
This article represents the opinion of the Companies operating under the FXOpen brand only. It is not to be construed as an offer, solicitation, or recommendation with respect to products and services provided by the Companies operating under the FXOpen brand, nor is it to be considered financial advice.
USD/JPY Treading Water Around 154.7
Markets
Friday’s fresh sell-off in the UK gilt market served as a chill reminder that deteriorating public finances are here to stay as a market theme. Not only in the UK, but globally. The UK yield curve bear steepened with yields rising by 8.2 bps (2-yr) to 16.4 bps (30-yr). Sterling eventually managed to erase intraday losses, closing almost unchanged at EUR/GBP 0.8822 after briefly moving above 0.8850 for the first time since April 2023. The government’s U-turn on raising income taxes in next year’s Budget (Nov 26 release) set things in motion. The positive connotation to not having to raise taxes again and break the election manifesto (after gently preparing for that hard message for over a month) paled compared with the feeling that Labour lost control over the fiscal narrative. The lack of visibility for UK households and firms and the lack of vision from the ruling party increases uncertainty and questions the ability to get finances back on track. Markets whipsawed after Bloomberg reported that more favorable projections by the Office for Budget Responsibility triggered the government’s change of heart but that intraday rebound didn’t last for long. The OBR estimates the budget gap to be £20bn rather than the long-feared £35bn (without restoring existing fiscal buffers). Chancellor Reeves later said that she won’t lower the thresholds at which people pay the basic and higher rate of the income tax but rathe extend the freeze at current levels. Markets considered this as kicking the can down the road and now expect a mixed bag of small, non-structural, measures to plug the budget hole. The political episode highlights the fragility of the Starmer-Reeves leadership with internal revolt building.
European and US markets followed the bear steepening signal. EUR swap rates ended 1 bp (2-yr) to 3.1 bps (30-yr) higher. From a technical point of view, the 2-yr swap rate closed at its highest level since the end of March (2.19%) with money markets no longer erring on the side of an additional ECB rate cut. The 10-yr swap rate (2.75%) had only one higher close since July 2024. The 30-yr swap rate (3.04%) extended its push beyond 3% to reach the highest level since November 2023. The US yield curve closed 1.6 bps (2-yr) to 3.6 bps (30-yr) higher. The risk correction came to a halt on Friday as bottom fishers showed up, helping main US equities to close unchanged (S&P 500) to slightly higher (Nasdaq) after incurring opening losses of almost 2%. EUR/USD is still going nowhere just north of 1.16. Today’s economic calendar only contains the US Empire Manufacturing Survey and EC forecasts. We don’t expect them to set the tone for global trading. We keep a close eye at interest rate markets to see if last week’s bear steepening moves get more traction.
News & Views
The central bank of Spain is projecting a budget deficit of 2.3% for 2026, down from 2.5% this year. That would mean a lower shortfall than Germany’s expected 3.1% for the first time in almost 20 years in what is another sign of how intra-EMU fiscal fortunes have significantly changed over the last couple of years. The (semi-)core struggles to rein in outsized deficits (eg. France, Belgium) or simply opens the taps (eg. Germany) while the periphery is taking a grip on public finances. For Spain in particular its fast-growing economy has been a boon. GDP since 2022 expanded at an average clip of +/- 4% y/y compared to less than 0.5% for Germany. It allowed the government to pencil in a primary surplus for this year, its first since 2007.
Japanese GDP contracted in Q3 of this year, but less than feared. The economy shrank by 0.4% Q/Q or 1.8% in yearly terms, compared to the -0.6% and -2.4% expected. The Q2 print in addition saw a slight upward revision to 0.6% and 2.3% respectively. The GDP decline came on the back of a sharp drop in residential investment, fixed capital formation and net exports which anemic private (accounting for around half of the economy) and government consumption was unable to offset. The Japanese yen barely budged on the release with USD/JPY treading water around 154.7. Yields, however, do rise, especially at the long end of the curve. This may be inspired by growing expectations for the promised big fiscal package by PM Takaichi to support the economy, to be announced over the summer. Japan’s 20-yr yield – in focus due to the upcoming auction on Wednesday – rises to a new multidecade high of 2.75%.
BoJ’s Ueda warns against keeping policy too loose for too long
BoJ Governor Kazuo Ueda warned that maintaining ultra-loose monetary policy for an extended period could introduce risks to achieving inflation target in a stable manner. Minutes from his meeting with the Council on Economic and Fiscal Policy recorded Ueda stressing that stable achievement of the 2% goal required both pushing inflation up and preventing an unintended overshoot.
He noted that “keeping policy too loose for too long carries risks,” framing the central bank’s current approach as one aimed at ensuring a "smooth landing" while carefully assessing economic conditions.
The meeting also marked the first public appearance of Ueda alongside Prime Minister Sanae Takaichi since she took office.
Diplomacy for Sale
The Swiss are known to be slow. It took the Palais Fédéral a few months to acclimate to the new diplomacy and send – instead of Karin Keller-Suter, who could sometimes be irritating but would never kiss the ring – a handful of rich businessmen with arms full of gifts, ranging from Rolex watches to gold bars specifically curved for President Trump. And the magic worked. The Swiss export tariff was pulled from 39% to 15%.
Anything that’s for sale, the Swiss could buy. But make no mistake: at Friday’s apéro, the good news from the US tariffs was counterbalanced by the franc’s persistent strength. The strong franc sure sounds like a First World Problem – and it is – but it has concrete implications for businesses. While iPhones, toys, cars, and whatever else you can think of made outside Switzerland will be cheap for the Swiss this Christmas, it’s also hurting demand and costing jobs in Switzerland. Your Gruyère cheese could be the best in the world, but when it costs nearly $40 a kilo, it’s hard to digest.
This is why the SMI didn’t know how to react on Friday. It gapped lower at the open, then zigzagged up and down, but nothing suggested the clouds had cleared.
So what’s next? Can the Swiss franc appreciate indefinitely? The answer seems to be yes. The Swiss National Bank (SNB) cut rates to 0% this year, and the latest data suggest it has tried to intervene in FX markets by directly selling francs to weaken it. Nothing worked. From here, direct FX intervention seems more likely than another rate cut this year. There’s no guarantee the latter would reverse the franc’s appreciation. But in theory, the SNB can print as many francs as it wants and sell them. And the EURCHF is currently hovering around 0.92 – levels that usually bring the SNB into play.
And why is the franc so strong? Appetite for other currencies is weak. Even gold doesn’t offer much peace of mind in times of market turbulence. The US dollar is better bid this morning, as the US finally provides data for hungry investors to chew on. The probability of a 25bp Federal Reserve (Fed) cut in December has dropped to 43%, down from above 90% after the US government shutdown. And there’s now room for the doves to jump back on the wagon – but for that, Thursday’s jobs data should be soft enough to reverse the “no-cut” pricing. What counts as “soft enough”? Hard to say, as there are no forecasts yet for September. My analysis: we’ll see.
Last week ended slightly positive as dip-buyers jumped in before the closing bell, helping the S&P500 close above its 50-DMA. Nasdaq futures are leading gains this morning on hope that Nvidia will throw another set of strong results on the table this Wednesday, scaring the bears away. Jensen Huang sounds so confident the numbers won’t disappoint. But will investors keep buying? Possibly. Berkshire Hathaway reportedly built a new stake in Google, while Michael Burry closed his short positions and shuttered his fund. There may be more air to pump in.
Would improved appetite save Bitcoin? I don’t know. I rarely comment on Bitcoin – it rarely moves on anything tangible, and it annoys me. What’s clear is that momentum remains Bitcoin’s bigger trend – pointing at deeper losses. How deep? My Fibonacci retracement on the 2023–2025 rally suggests it could sink to around $82–83K without breaking the past two years’ bullish trend.
My guess is that, whatever happens to Bitcoin, the blockchain will thrive. If you missed the memo, JPMorgan has rolled out its own deposit token, JPM Coin, which – unlike Bitcoin, backed by thin air – represents US dollar deposits safely held at JPMorgan. Why is this cool? Because these tokens slash settlement times, boost liquidity, and let clients operate 24/7. Real-time, round-the-clock money movement… unlike the current system that shuts down on weekends like it’s 1998.
This is another giant domino falling toward the institutionalization of tokenized money. In ten years, it might not be Bitcoin that replaces money, but tokens quietly rewiring the entire financial system. And honestly? We’ll only be happy. One day, we’ll look back and say: “Remember when payments took two days and the system went to sleep on weekends? How absurd.”
Markets Brace for a Flood of US Data Releases
In focus today
There is no exciting news releases scheduled for today, but this marks the start of a week packed with significant macroeconomic events.
Midweek brings key releases, including the UK October CPI and the FOMC minutes on Wednesday. On Thursday, attention will shift to euro area November consumer confidence. To round off the week, Friday will deliver euro area and US November flash PMIs alongside the ECB's Q3 negotiated wages data.
The focus this week will not least also turn to the delayed release of US data following the end to the US government shutdown last week. Also, central bank signals, growth indicators and on Wednesday the Nvidia earnings release will be important.
Economic and market news
What happened overnight
In Japan, Q3 GDP contracted by 0.4% q/q, beating consensus of a 0.6% decline. This translates to an annualised contraction of 1.8% y/y for the quarter, primarily attributed to a sharp drop in exports amid US tariffs having an impact. Automakers experienced a significant plunge in shipment volumes, reversing earlier gains from front-loaded exports. Additionally, housing investments weighed on growth. Despite these challenges, the economy remains on a relatively stable footing. Sustained wage growth will be crucial for the Bank of Japan to consider further interest rate hikes.
What happened Friday
In euro area, GDP grew by 0.2% q/q in Q3, slightly improving on the 0.1% growth recorded in Q2 and broadly in line with expectations. The data reaffirms a picture of sub-trend yet resilient activity. However, growth remains uneven across the region. France and Spain continue to drive momentum, with Spain's strong performance standing out, while Germany lags, stagnating for the third consecutive year due to weak industrial output, subdued exports, and sluggish private consumption.
Employment in the euro area rose by 0.1% q/q in Q3, a marginal improvement compared to the previous quarter. The labour market remains relatively resilient, although signs of cooling are evident as firms retain staff despite weak demand. This modest increase highlights a subdued employment environment, which aligns with a cautious outlook on wage pressures and broader corporate activity.
In Sweden, the October Labour Force Survey revealed a rise in unemployment to 9.3%, though its volatility and a weaker sample group warrant caution in interpretation. Despite this, the outlook appears more optimistic, with signs of a swifter-than-expected recovery. However, the Riksbank's shift from focusing on high unemployment to addressing inflation risks may be delayed. Encouragingly, early indicators suggest a strengthening labour market, and the Public Employment Service's more stable measure showed unemployment declining to 6.8% in October.
In the UK, Gilts and GBP sold off as Chancellor Reeves ditched plans to raise income tax rates. The decision came as the OBR forecast for the UK economy looks to leave a smaller fiscal gap to close than expected. These forecasts are notoriously uncertain, and this backdrop did little to sooth investors. The final budget will be presented on 26 November.
A trade agreement between the US and Switzerland was finalised on Friday, reducing tariffs on Swiss goods to 15%, down from 39%, and including a Swiss commitment to invest USD 200bn in the US. The deal places Switzerland on equal footing with the EU.
In the cryptocurrency market, Bitcoin hit new lows around USD 93,000 over the weekend before rebounding somewhat overnight to USD 95,000. The cryptocurrency has been on a four-day losing streak, declining 9% week-to-date amidst a broader stock market retreat driven by concerns surrounding AI.
Equities: Global equities ended Friday 0.3% lower, leaving the week only marginally higher overall. The best-performing sectors were energy and tech on what was otherwise a day with limited macro news. In the US on Friday: Dow -0.6%, S&P 500 flat, NASDAQ 0.1% higher and Russell 2000 +0.2%.
FI and FX: Friday saw some substantial intraday moves across asset classes. UST yields and equities were deep in the red halfway through the session whilst EUR/USD rallied to 1.1650. However, without any apparent trigger these moves were quickly reversed the S&P500 closed flat, up a couple of bp throughout the UST curve and close to 1.16 for EUR/USD. Defying the intraday reversal, scandi weakness was constant throughout the day, with EUR/SEK climbing closer to the 11-mark and EUR/NOK back above 11.70 once again. For this week, attention turns to the release of the delayed US data, the FOMC minutes and Friday's flash PMIs.