Sample Category Title
Sunset Market Commentary
Markets
The European Commission published its Autumn Economic Forecast today. They project real GDP growth of 1.3%-1.2%-1.4% in the euro area. Economic growth exceeded the Commission’s Spring forecast (0.9%-1.4%-1.4%) in the first nine months of the year thanks to a surge in exports ahead of anticipated tariff increases and a stronger performance of investment in equipment and intangible assets (notably Ireland). Continued growth in the third quarter is testimony to the resilience of the European economy and its ability to navigate unprecedented shocks with EC data and PMI surveys for October suggesting continuing growth momentum supported by a resilient labour market, decreasing inflation and favourable financing conditions. The EC’s growth forecasts compare with a 1.2%-1%-1.3% growth path set out by the ECB in September, suggesting risks for some upside revision in December which further cement the current 2% deposit rate as a floor for coming months. The Commission expects headline inflation to hover around the ECB’s 2% target over the policy horizon, averaging 2.1%-1.9%-2% in 2025-27. That’s also above the central bank’s September path (2.1%-1.7%-1.9%). The overall EMU deficit to GDP ratio is expected to slightly increase from 3.2% of GDP this year via 3.3% next year to 3.4% in 2027. Belgium and France are amongst the worst performers. Both countries’ governments are currently deadlocked over 2026 budget talks. The EC forecasts Belgian deficits of 5.3%, 5.5% and 5.9% of GDP. Belgian parliament so far only approved capping unemployment benefits at 2 years which could result in savings of around €2bn. Belgian PM De Wever was given a final (Christmas) deadline to come up with a multi-annual budget looking for an additional €8bn in structural savings. The coalition is finding it difficult to bridge the ideological divide between left parties pushing for taxes and the right looking more to spending cuts. The Commission plots French deficits at 5.5%, 4.9 and 5.3% of GDP. The French government has a Sunday constitutional deadline to deliver a budget to the Senate to be able to adopt it by December 23. Lacking a government majority, the probability is still high that talks will collapse. French Socialists last month acted as “kingmakers” in the government’s survival after they were granted a suspension of Macron’s pension reform. Afterwards, they only asked for more. A proposal for a wealth tax (Zucman tax) was voted down at the end of October both in his original and a watered down version. Socialists leader Faure said that his party is not committed to backing the 2026 budget as it currently stands. Without a deal by the end of the week, the French government can still resort to Article 49.3, bypassing parliament, but they so far indicated that they won’t resort to that means. The situation in both Belgium and France are more examples of the precarious global trajectory of (unsustainable) public finances. Last Friday, the build-up to the UK November 26 budget triggered a significant bear steepening of the UK yield curve. Today’s market moves are technically irrelevant in FI, FX and equity space.
News & Views
Canadian inflation rose a consensus-matching 0.2% m/m in October, lowering the annual figure to 2.2% from 2.4%. A sharp drop in pump prices (-4.8% m/m) and falling grocery prices (0.6% m/m) – the largest since September 2020 – contributed to the deceleration in headline CPI. Core gauges remain sticky near the 3% upper bound of the Bank of Canada’s tolerance range. Both the median and trimmed measure remain in an elevated 2.9%-3.1% range for most of 2025 so far. Core inflation in the ‘traditional’ sense (ex. food and energy) picked up to 2.7% from 2.4%. The data underpin the central bank’s decision last month to accompany the rate cut (to 2.25%) with guidance that it is “about the right level” if the economy and inflation outlook evolve as forecasted. Canadian money markets are already positioned for a long rates status quo. USD/CAD treads water in the 1.403 area.
The Hungarian government today announced a package of tax cuts for small businesses. Orban said the HUF 90bn price tag would be covered by a tax rise on banks. The prime minister additionally announced the postponement of an excise tax hike on fuel by six months, costing HUF 20bn. Orban’s cabinet just last week raised the budget deficit target to 5% for this year and the next, providing fiscal leeway for earlier announced measures that include large-scale tax cuts for families, wage hikes and food vouchers for pensioners. but risking a market backlash at some point. The Orban administration is feeling the heat of the main opposition party Tisza going into next year’s election. The latter having a lead over Orban’s Fidesz party ever since end 2024. The forint holds steady near EUR/HUF 384.
Canada: Inflation Comes in as Expected, as Underlying Inflation Measures Offer Mixed Signals
Headline CPI inflation for October came in at 2.2% year-on-year (y/y), right in line expectations for a 2.2% y/y print – decelerating from September's 2.4% print.
Gasoline prices were the big drag on the headline, falling 9.4% compared to the 4.1% decline in September. On a monthly basis, prices tumbled 4.8%, amid the switch to cheaper winter blends and ongoing worries over a global oversupply in oil markets.
Grocery price inflation slowed in October, with prices up 3.4% y/y, down from 4.0% in September. The slight deceleration offers little relief as Statistics Canada notes that grocery prices, "have exceeded overall inflation for nine consecutive months." On a monthly basis grocery prices fell 0.6% month-on-month.
The Bank of Canada's various of measures of underlying inflation was a mixed bag for the month. Both of the Bank of Canada's (BoC) constructed core measures came in below expectations as the CPI-trim measure fell to 3.0% y/y (3.1% in September), while the CPI-median index tumbled to 2.9% y/y from 3.1% in September.
- On the flip side, the older exclusionary measures showed a different picture, with both heating up for the month. The CPI excluding food and energy jumped to 2.7% y/y from 2.4% in September, and the CPI excluding the eight most volatile components and indirect taxes (CPIX) rose to 2.9% y/y from 2.8% in August.
- The story was the same on the three-month seasonally adjusted (annualized) basis as the CPIX and CPI ex. food and energy jumped to 3.3% and 2.6%, respectively, while the CPI-median (+2.6% from 2.8% in September) cooled and the CPI-trim was unchanged at 2.6%.
Key Implications
The takeaway here is that top line inflation came in as expected while the various underlying measures continues to hover in-and-around the target range – with some heating up and others cooling off.
The Bank of Canada delivered a cut at their past meeting and signaled there wasn't much more they could do in the current economic environment – a view we have shared for some time. This month's report doesn't change the story much, inflation is unlikely to fall below the lower end of the target range given the disruptions on the supply side of the economy, but it also unlikely to sharply accelerate amid expectations for tepid domestic demand. Markets remain on the same page, putting the odds of a cut by next April at roughly 30%.
GBP/JPY Mid-Day Outlook
Daily Pivots: (S1) 202.57; (P) 203.33; (R1) 204.32; More...
Intraday bias in GBP/JPY is back on the upside with breach of 204.04 temporary top. Firm break of 204.22 resistance will suggest that larger rally from 184.53 is ready to resume through 205.30 towards 208.09 high. However, break of 202.31 minor support will turn bias to the downside towards 199.04, to extend the corrective pattern from 205.30 with another falling leg.
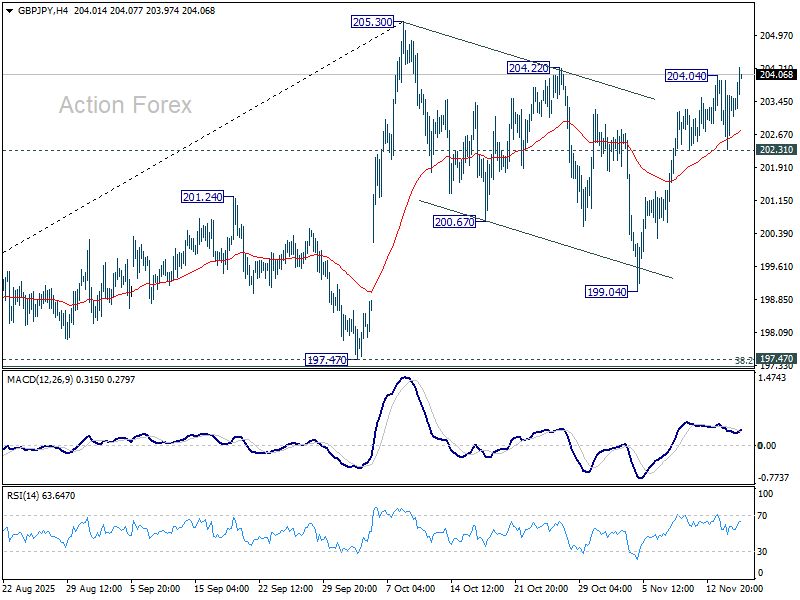
In the bigger picture, price actions from 208.09 (2024 high) are seen as a corrective pattern which might have completed at 184.35. Firm break of 208.09 high will resume the up trend from 123.94 (2020 low). Next target is 61.8% projection of 148.93 to 208.09 from 184.35 at 220.90. However, decisive break of 197.47 support will dampen this view and extend the corrective pattern with another fall.
Pound Outperforms as Markets Stabilize After Fiscal Headlines
Sterling is outperforming in otherwise quiet trading, reversing some of the weakness seen late last week. The Pound and UK bonds were pressured after reports that Chancellor Rachel Reeves had opted to drop tax hikes from next week’s Autumn Budget, a shift that raises fresh questions about the UK’s fiscal shortfall. Today’s recovery in Sterling, however, along with retreat in gilt yields, suggests markets have taken a cooler view after the initial reaction.
Still, uncertainties remain. Markets will only get clarity once the budget is delivered next Wednesday, and questions over revenue, spending commitments, and the credibility of the fiscal framework continue to hang over UK assets. For the moment, traders appear to be adopting a wait-and-see stance rather than driving a sustained repricing.
The near-term focus shifts to inflation. This week’s UK CPI release is one of the most important data points for the Pound, particularly as investors reassess the likelihood of a BoE rate cut in December. If Wednesday’s report confirms that inflation peaked at 3.8% in September, the BoE could receive the final piece it needs to justify a move next month.
Elsewhere, the broader market mood is tilted mildly risk-off. Aussie and Kiwi are the weakest performers so far, while Euro is also under some pressure. By contrast, Sterling leads the pack, followed by t Dollar and Loonie. CAD resilience reflects the persistence of elevated core inflation readings, which should keep the BoC firmly on hold and anchor expectations around a prolonged pause. That steadiness has helped shield the Loonie from the softer risk backdrop. Yen and Swiss Franc sit in the middle of the pack.
In Europe, at the time of writing, FTSE is down -0.27%. DAX is down -0.86%. CAC is down -0.61%. UK 10-year yield is down -0.043 at 4.540. Germany 10-year yield is down -0.014 at 2.709. Earlier in Asia, Nikkei fell -0.10%. Hong Kong HSI fell -0.71%. China Shanghai SSE fell -0.46%. Singapore Strait Times fell -0.05%. Japan 10-year JGB yield rose 0.031 to 1.733.
CPI cools to 2.2% in Canada as gasoline declines deepen, core elevated
Canada’s inflation moderated in October, with headline CPI slowing to 2.2% yoy from 2.4%, fully in line with expectations. The deceleration was driven largely by gasoline prices, which fell -9.4% yoy compared with -4.1% yoy decline in September. Excluding gasoline, CPI was unchanged at 2.6% yoy.
Core metrics showed a mixed but generally softer profile. CPI median eased from 3.1% yoy to 2.9%—below expectations of 3.1%. CPI trimmed slowed to 3.0% yoy from 3.1%, matching forecasts. CPI common held unchanged at 2.7% yoy, undershooting the anticipated 2.8%.
The data point to a gradual cooling of inflation, driven by energy but supported by mild softening in core categories.
EU Autumn forecast: Eurozone growth upgraded, inflation easing ahead
The European Commission’s Autumn forecast showed a firmer growth profile for the Eurozone, with 2025 GDP now expected to rise 1.3%—a notable upgrade from April’s 0.9%. Growth is set to dip only marginally to 1.2% in 2026 before accelerating to 1.4% in 2027. The Commission said early-year momentum, boosted by exports brought forward in anticipation of tariff increases, demonstrated the EU economy’s capacity to absorb external shocks.
On prices, the Commission sees inflation steadily moderating, falling to 2.1% in 2025 and 1.9% in 2026 after averaging 2.4% last year. It highlighted that inflation is “nearing the ECB target” and that financing conditions have improved meaningfully, creating a more supportive backdrop for consumption and investment.
Overall, the forecast pointed to modest but stable growth as the dominant theme for the coming years. Despite a complex global environment, the Commission believes the Eurozone is positioned for a gradual reacceleration, with cooling inflation and easier financial conditions helping anchor the recovery.
BoJ's Ueda warns against keeping policy too loose for too long
BoJ Governor Kazuo Ueda warned that maintaining ultra-loose monetary policy for an extended period could introduce risks to achieving inflation target in a stable manner. Minutes from his meeting with the Council on Economic and Fiscal Policy recorded Ueda stressing that stable achievement of the 2% goal required both pushing inflation up and preventing an unintended overshoot.
He noted that “keeping policy too loose for too long carries risks,” framing the central bank’s current approach as one aimed at ensuring a "smooth landing" while carefully assessing economic conditions.
The meeting also marked the first public appearance of Ueda alongside Prime Minister Sanae Takaichi since she took office.
Japan's GDP avoids deeper Q3 slump as public spending cushions demand
Japan’s economy contracted in the third quarter, but the decline was smaller than markets anticipated. GDP fell -0.4% qoq versus expectations of -0.6%. The annualized figure showed -1.8% drop compared with forecasts of -2.5%. The softer-than-expected contraction reflected pockets of resilience in domestic demand despite broader weakness.
Government spending rose 0.5% qoq and private consumption edged up 0.1% qoq, helping to offset some of the slowdown. Public demand grew 0.5% qoq and contributed 0.1 percentage point to overall GDP. However, private demand was a significant drag, falling -0.4% qoq as residential investment plunged -9.4% qoq, subtracting 0.3 percentage point from output.
External demand also weakened. Exports of goods and services fell -1.2% qoq after a strong 2.3% qoq rise in the previous quarter, with net exports contributing to a 0.2 percentage point drop in GDP.
Slight uptick in NZ BNZ services in October, but weakness persists
New Zealand’s services sector remained under heavy strain in October, with the BusinessNZ Performance of Services Index inching up from 48.3 to 48.7 but still locked firmly in contraction.Activity, employment, and new orders all hovered below 50, extending the sector’s downturn to 20 straight months and keeping the headline reading well below the long-term average of 52.8.
Businesses cited weak demand as the principal drag, linking the slowdown to reduced household spending, ongoing cost-of-living pressures, and diminished confidence. While the proportion of negative comments fell from 58.0% to 54.1%, responses still pointed to a market struggling with inconsistent sales flows and hesitant customers. The continued decline in new orders signals that firms are not yet seeing a meaningful turn in forward demand.
Operating costs, competitive intensity, workflow delays, and cancelled projects are adding further strain, tightening cashflow and limiting the ability of firms to absorb volatility.
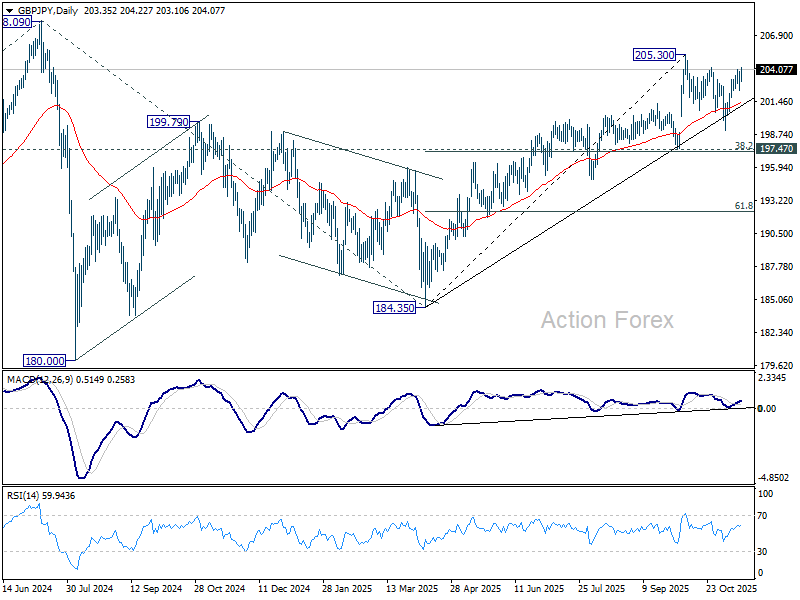
GBP/JPY Mid-Day Outlook
Daily Pivots: (S1) 202.57; (P) 203.33; (R1) 204.32; More...
Intraday bias in GBP/JPY is back on the upside with breach of 204.04 temporary top. Firm break of 204.22 resistance will suggest that larger rally from 184.53 is ready to resume through 205.30 towards 208.09 high. However, break of 202.31 minor support will turn bias to the downside towards 199.04, to extend the corrective pattern from 205.30 with another falling leg.
In the bigger picture, price actions from 208.09 (2024 high) are seen as a corrective pattern which might have completed at 184.35. Firm break of 208.09 high will resume the up trend from 123.94 (2020 low). Next target is 61.8% projection of 148.93 to 208.09 from 184.35 at 220.90. However, decisive break of 197.47 support will dampen this view and extend the corrective pattern with another fall.
CPI cools to 2.2% in Canada as gasoline declines deepen, core elevated
Canada’s inflation moderated in October, with headline CPI slowing to 2.2% yoy from 2.4%, fully in line with expectations. The deceleration was driven largely by gasoline prices, which fell -9.4% yoy compared with -4.1% yoy decline in September. Excluding gasoline, CPI was unchanged at 2.6% yoy.
Core metrics showed a mixed but generally softer profile. CPI median eased from 3.1% yoy to 2.9%—below expectations of 3.1%. CPI trimmed slowed to 3.0% yoy from 3.1%, matching forecasts. CPI common held unchanged at 2.7% yoy, undershooting the anticipated 2.8%.
The data point to a gradual cooling of inflation, driven by energy but supported by mild softening in core categories.
EUR/USD Mid-Day Outlook
Daily Pivots: (S1) 1.1601; (P) 1.1628; (R1) 1.1649; More…
Intraday bias in EUR/USD remains neutral for the moment. Current development suggests that fall from 1.1917 might have completed as a three wave correction at 1.1467. Above 1.1655 will target 1.1727 resistance first. Firm break there will solidify this bullish case and bring retest of 1.1917 high. However, break of 1.1561 will revive near term bearishness and target 1.1467 low instead.
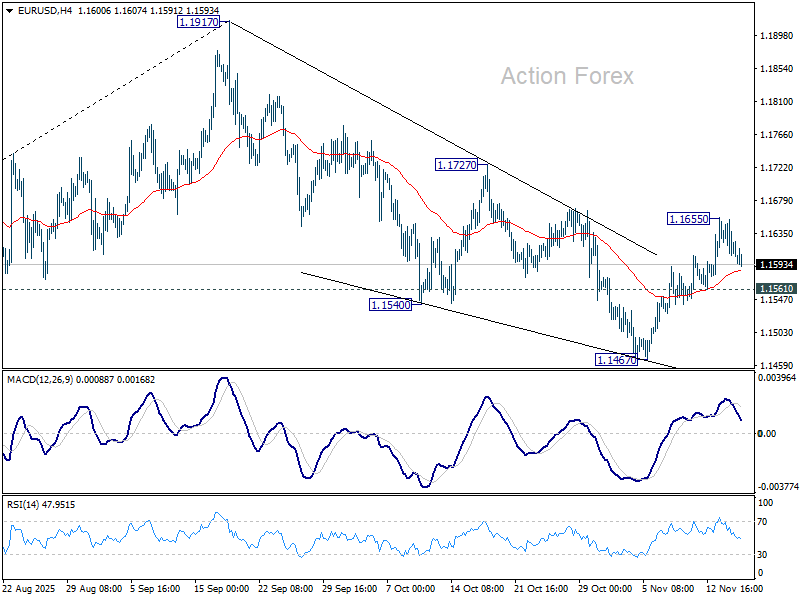
In the bigger picture, considering bearish divergence condition in D MACD, a medium term top is likely in place at 1.1917, just ahead of 1.2 key psychological level. As long as 55 W EMA (now at 1.1328) holds, the up trend from 0.9534 (2022 low) is still in favor to continue. Decisive break of 1.2000 will carry larger bullish implications. However, sustained trading below 55 W EMA will argue that rise from 0.9534 has completed as a three wave corrective bounce, and keep long term outlook bearish.
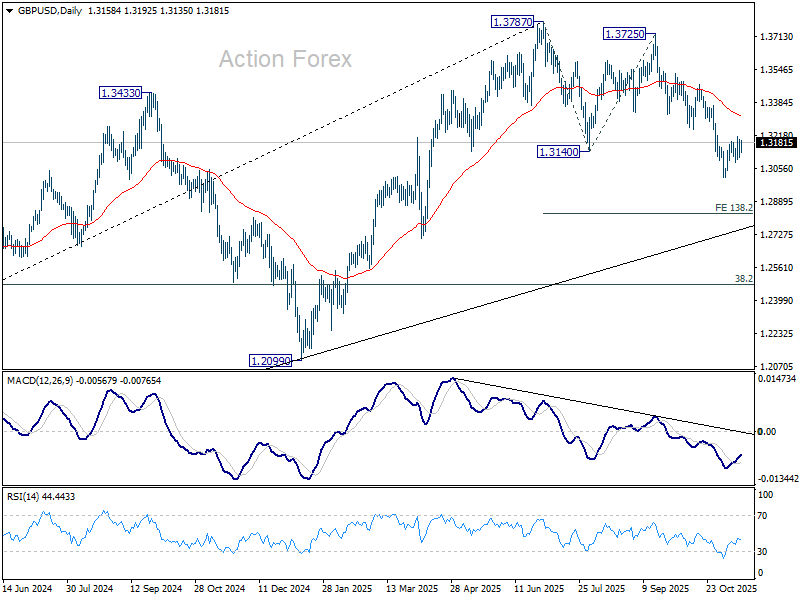
GBP/USD Mid-Day Outlook
Daily Pivots: (S1) 1.3120; (P) 1.3162; (R1) 1.3216; More...
Intraday bias in GBP/USD remains neutral and more consolidations could be seen. Further decline is expected as long as 1.3247 support turned resistance holds. Break of 1.3008 will resume the fall from 1.3787, and target 138.2% projection of 1.3787 to 1.3140 from 1.3725 at 1.2831). Nevertheless, firm break of 1.3247 will suggest that fall from 1.3787 has completed as a corrective move already.

In the bigger picture, the break of 55 W EMA (now at 1.3182) is taken as the first sign that corrective rise from 1.0351 (2022 low) has completed. Decisive break of trend line support (now at 1.2824) will solidify this case and target 38.2% retracement of 1.0351 to 1.3787 at 1.2474 next. Meanwhile, in case of another rise, strong resistance should emerge below 1.4248 (2021 high) to cap upside to preserve the long term down trend.
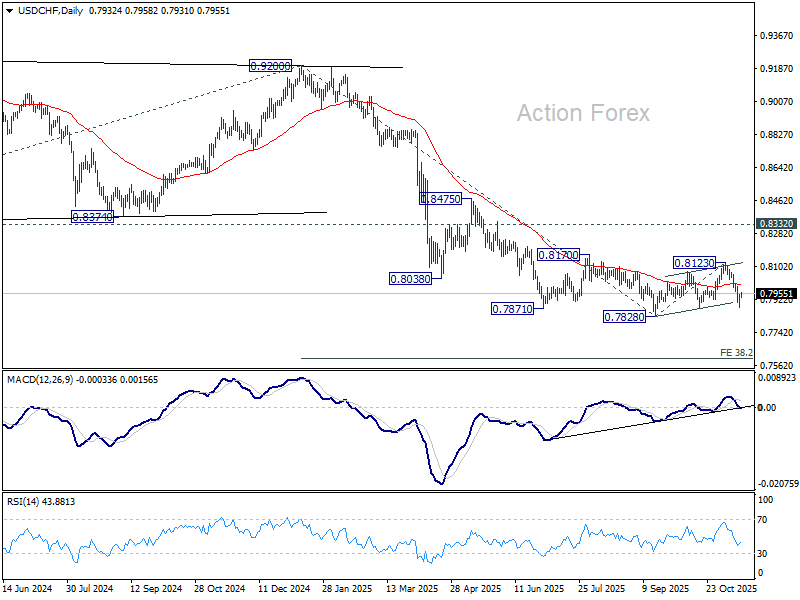
USD/CHF Mid-Day Outlook
Daily Pivots: (S1) 0.7897; (P) 0.7923; (R1) 0.7967; More…
Intraday bias in USD/CHF remains neutral for the moment. Outlook is unchanged that corrective rebound from 0.7828 has completed with three waves up to 0.8123. Break of 0.7872 support will pave the way through 0.7828 to resume the larger down trend. Next near term target is 38.2% projection of 0.9200 to 0.7828 from 0.8123 at 0.7599. However, sustained break of 55 4H EMA (now at 0.7990) will mix up the outlook.
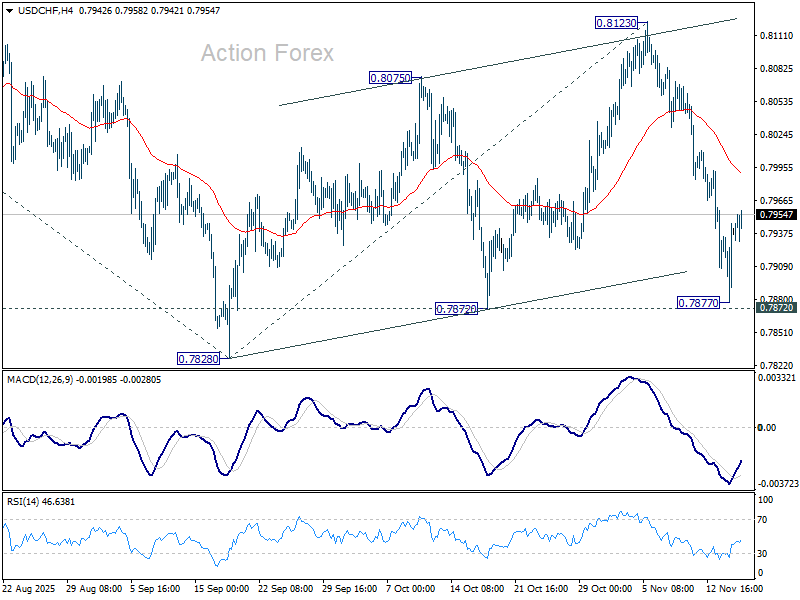
In the bigger picture, long term down trend from 1.0342 (2017 high) is still in progress. Next target is 100% projection of 1.0146 (2022 high) to 0.8332 from 0.9200 at 0.7382. In any case, outlook will stay bearish as long as 0.8332 support turned resistance holds (2023 low).
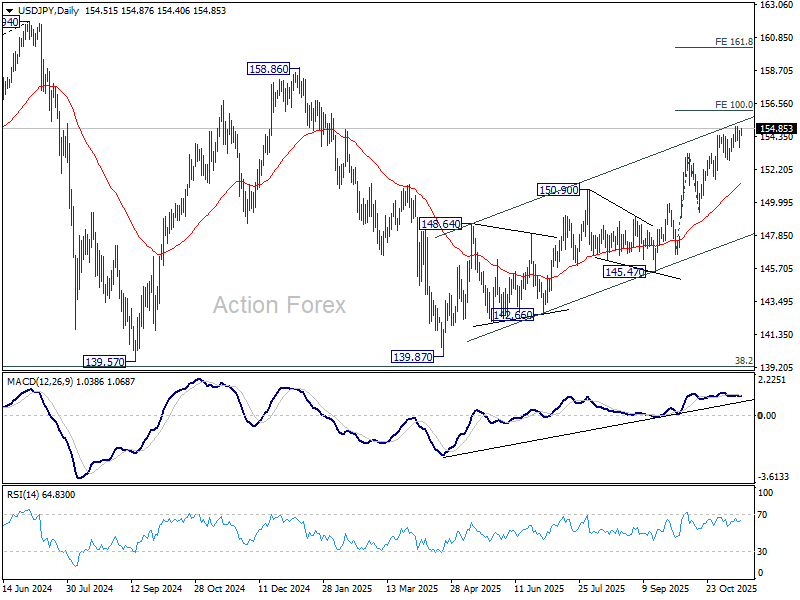
USD/JPY Mid-Day Outlook
Daily Pivots: (S1) 153.85; (P) 154.31; (R1) 154.99; More...
USD/JPY is still staying in range below 155.03 and intraday bias remains neutral. More consolidations could be seen but further rise is in favor with 152.81 support intact. On the upside, break of 155.03 will target 100% projection of 146.58 to 153.26 from 149.37 at 156.05. Break there will pave the way to 158.85 key structural resistance. However, considering bearish divergence condition in 4H MACD, firm break of 152.81 support will indicate short term topping, and bring deeper pullback to 55 D EMA (now at 151.30).
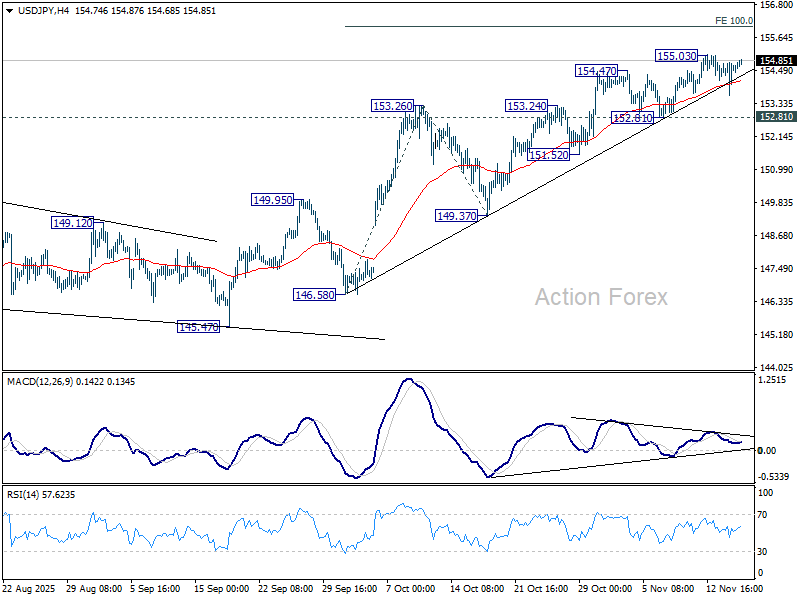
In the bigger picture, current development suggests that corrective pattern from 161.94 (2024 high) has completed with three waves at 139.87. Larger up trend from 102.58 (2021 low) could be ready to resume through 161.94 high. On the downside, break of 149.37 support will dampen this bullish view and extend the corrective pattern with another falling leg.