
Sample Category Title
Gold Treads Water Amid Mixed Signals
Gold edged lower to 4,060 USD per ounce on Friday, positioning the metal for a modest weekly decline. The shift in sentiment follows a stronger-than-anticipated delayed US employment report, which has tempered expectations for a Federal Reserve rate cut in December.
The Labour Department's data, delayed by the recent government shutdown, significantly exceeded forecasts: September non-farm payrolls rose by 119,000, well above the expected 50,000. Markets interpreted the report as confirming the Fed's October assessment—that the labour market is cooling gradually but remains fundamentally stable. However, the unemployment rate climbed to 4.4%, its highest level since 2021, while wage growth came in slightly above expectations at 3.8%.
Notably, the October employment report will not be published separately; the Bureau of Labor Statistics will combine the data with November's release.
Amid these mixed labour market signals and cautious commentary from Fed officials, markets now price the probability of a December rate cut at just 40%, maintaining downward pressure on gold.
Interestingly, despite a broad shift away from risk assets across global capital markets, gold has yet to see significant safe-haven inflows.
Technical Analysis: XAU/USD
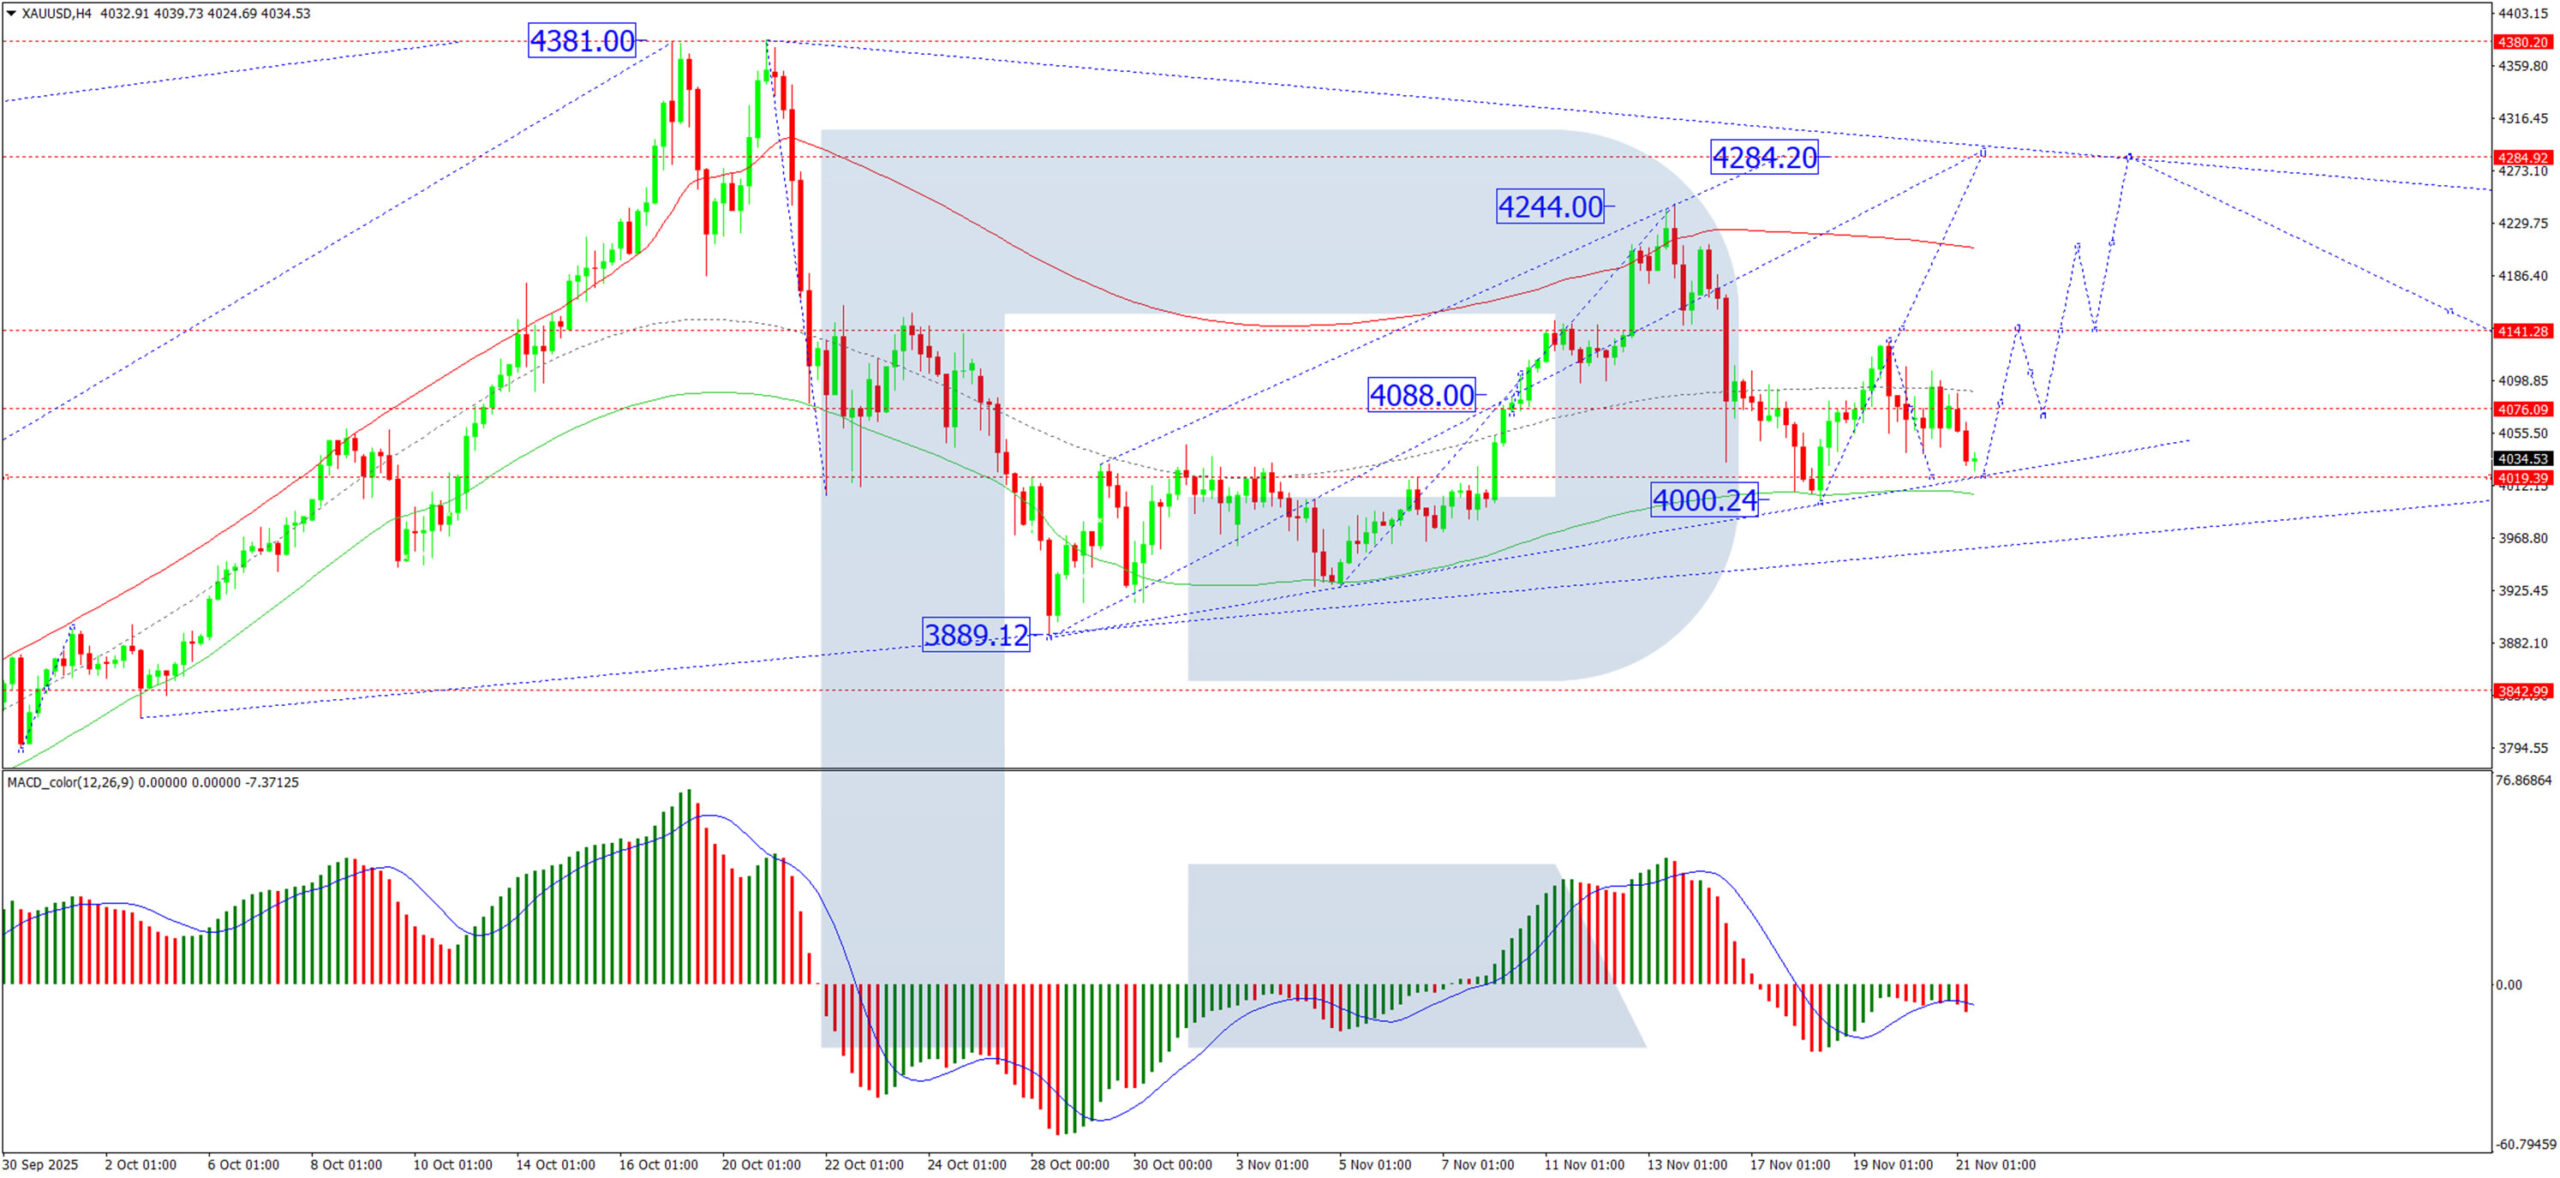
H4 Chart:
On the H4 chart, XAU/USD is forming a consolidation range around 4,076 USD. The pair may first extend this range downward toward 4,019 USD before resuming an upward move to 4,141 USD. A decisive break above this level would open the path for a fifth wave of growth targeting 4,285 USD. The MACD indicator supports this view, with its signal line below zero, suggesting the current correction has further to run before the next leg higher.
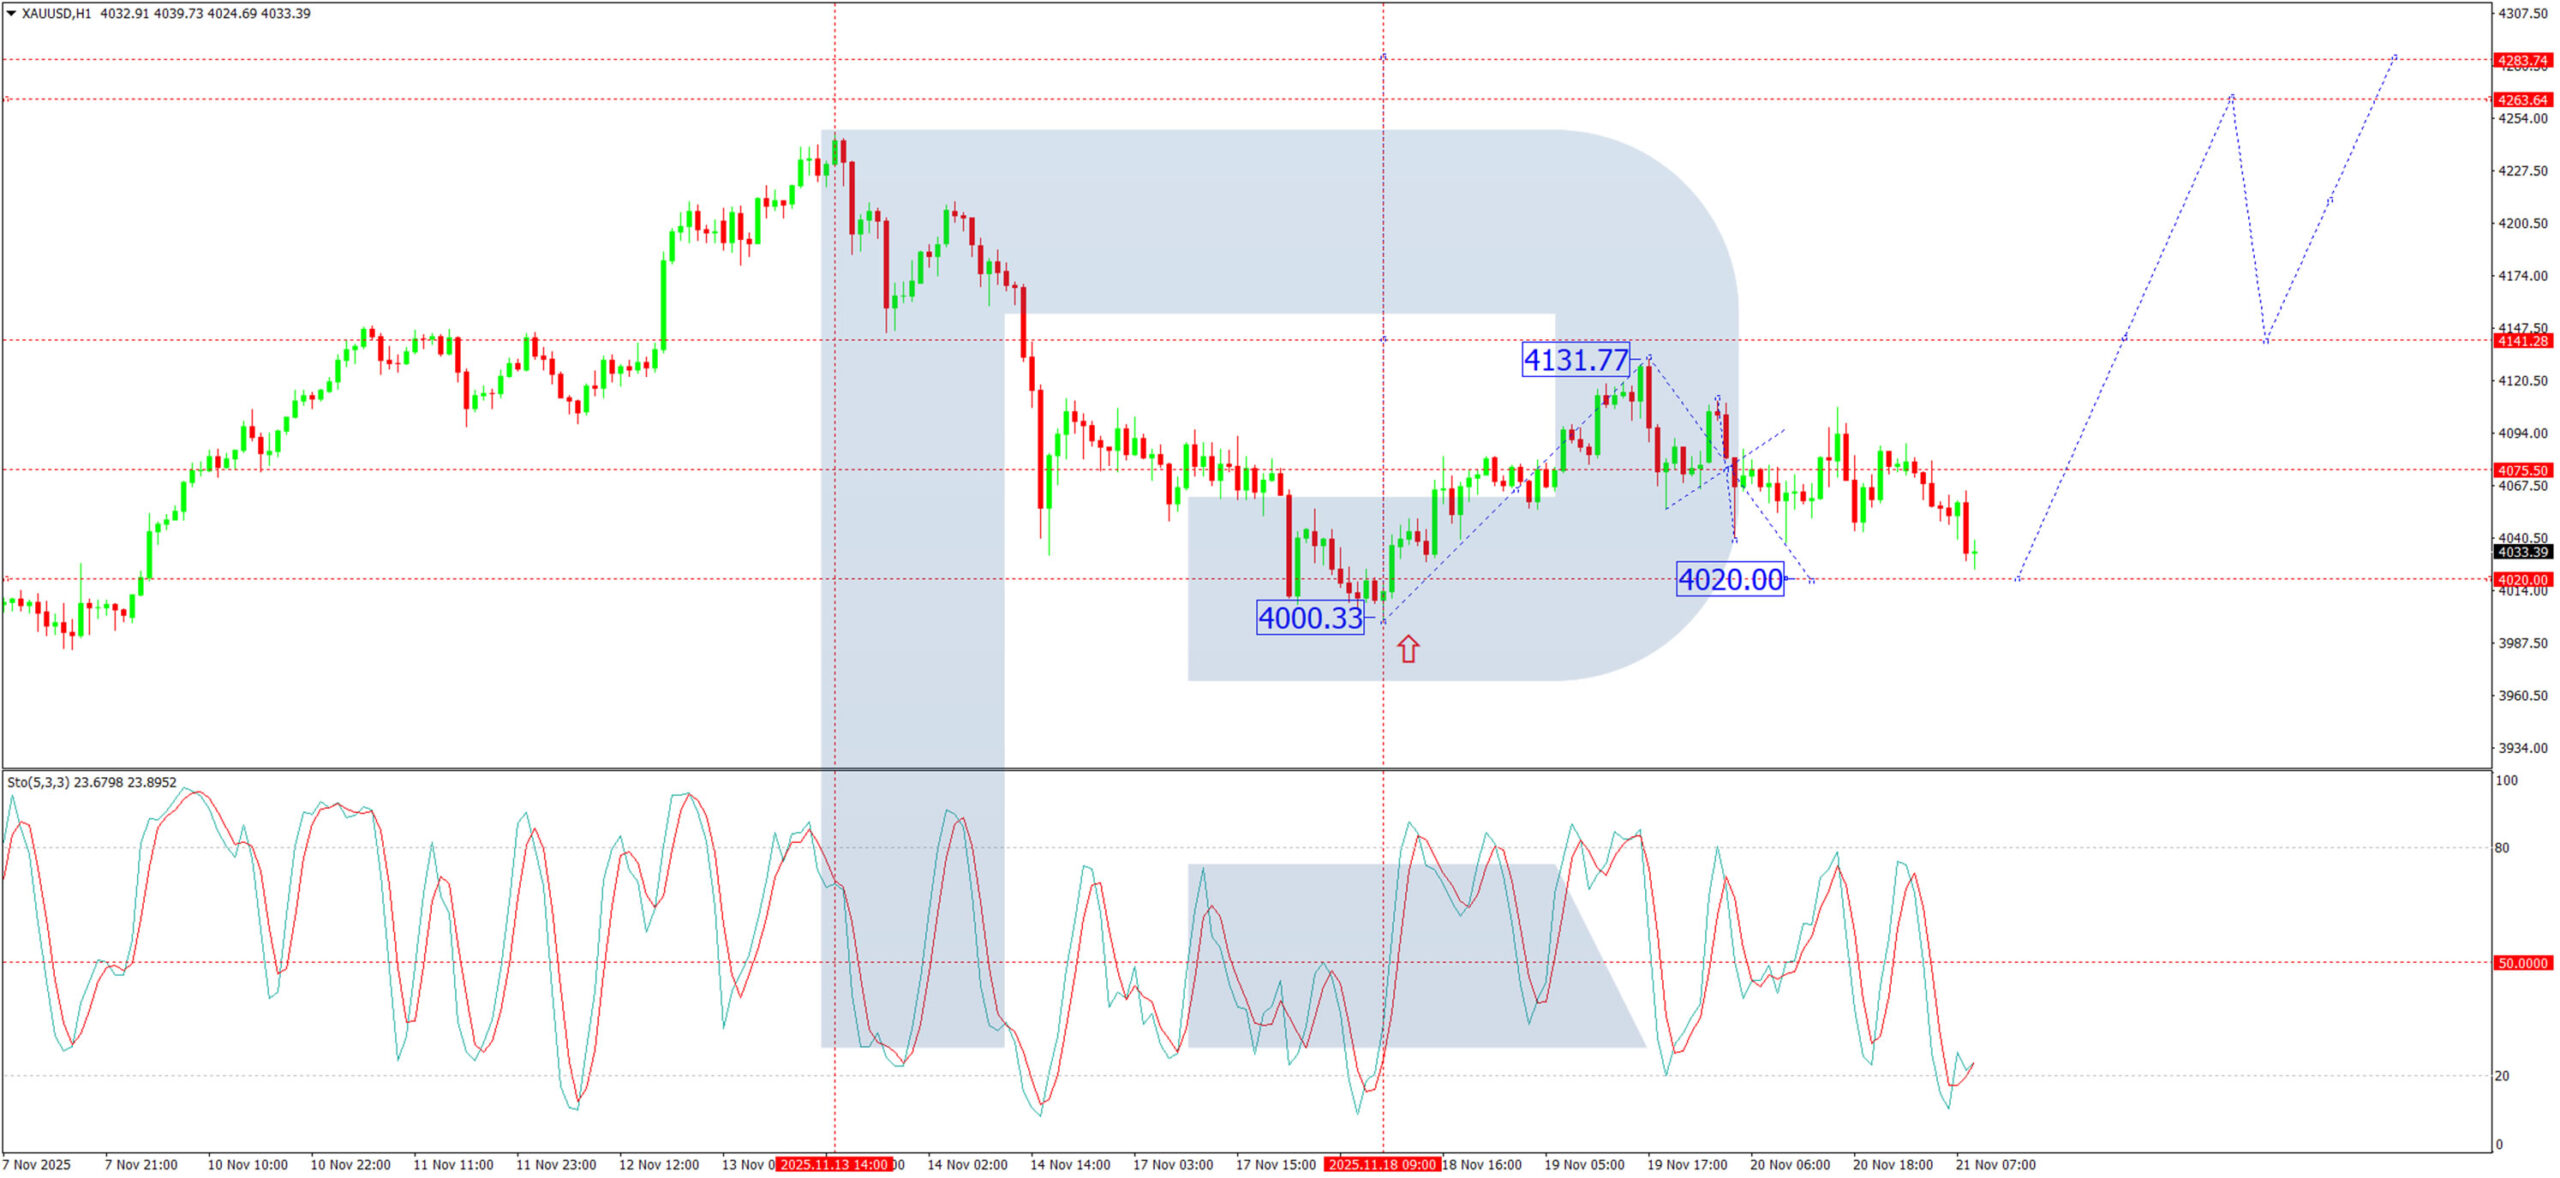
H1 Chart:
On the H1 chart, the market has established a consolidation range around 4,075 USD. A downward wave is expected to develop toward at least 4,020 USD, which would complete the first phase of a larger pattern. This would be followed by a growth wave toward 4,131 USD, a correction back toward 4,020 USD, and then a final advance targeting 4,263 USD. The Stochastic oscillator aligns with this outlook, with its signal line at 20 and beginning to turn upward, suggesting potential for a near-term bounce.
Conclusion
Gold remains range-bound as conflicting labour market data and diminished rate cut expectations counterbalance its traditional safe-haven appeal. The technical picture suggests further consolidation is likely, with a potential dip toward 4,019–4,020 USD offering a buying opportunity for a subsequent move toward 4,141 USD and beyond. The metal's inability to attract significant safe-haven flows despite equity market weakness remains a concern for bulls, leaving the near-term trajectory heavily dependent on upcoming US economic data and Fed communications.
UK PMI drops to 50.5; Sluggish growth and softer prices bolster December BoE cuts
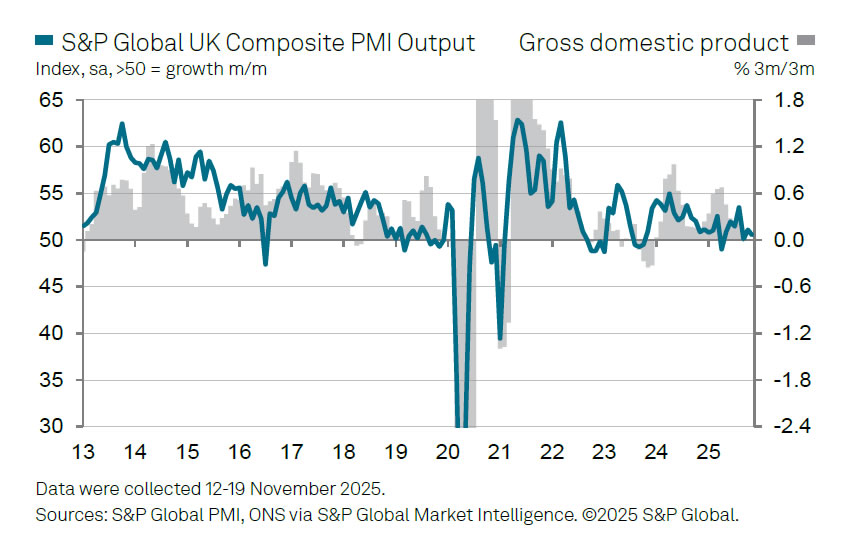
UK flash PMIs for November delivered a broadly downbeat signal on the economic outlook. Manufacturing managed to edge back into expansion territory, rising from 49.7 to 50.2 — its highest level in 14 months. But that improvement was overshadowed by a sharp drop in services activity, with PMI Services sliding from 52.3 to 50.5, a seven-month low. As a result, Composite PMI fell notably from 52.2 to 50.5.
According to Chris Williamson of S&P Global Market Intelligence, the latest readings point to an economy that has “stalled,” with job losses accelerating and business confidence deteriorating sharply. The PMI readings are broadly consistent with zero GDP growth for November and only around 0.1% growth so far in Q4.
While part of the slowdown is being blamed on paused spending decisions ahead of the Autumn Budget, weakening confidence suggests the hesitation may “turn into a downturn” if households and firms brace for new "demand-dampening measures" .
The inflation outlook also softened meaningfully. Selling price inflation dropped to its lowest in almost five years, with goods prices falling at the fastest rate since 2016 and service-sector pricing power weakening.
Taken together, the PMI data reinforce expectations that the BoE would cut rates in December, especially if next week's Budget reinforces the pessimistic tone.
Eurozone PMI composite climbs to 53.1, but manufacturing still far from a turnaround
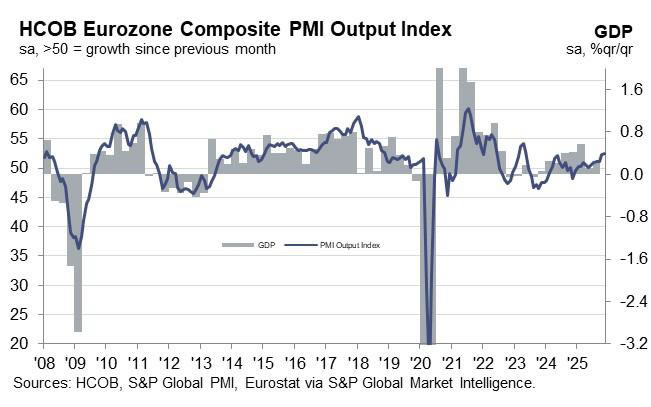
Eurozone business activity lost a little momentum in November as PMI Composite edged down from 52.5 to 52.4. Manufacturing slipped back into contraction at 49.7, down from 50.0, a five-month low. Services inched up from 53.0 to an 18-month high of 53.1.
Hamburg Commercial Bank’s Chief Economist Cyrus de la Rubia noted that manufacturing remains “marooned in a no-man’s land of directionlessness,” with soft demand showing up in yet another decline in new orders. He warned the sector is still “months, possibly even several quarters” away from a sustained turnaround, pointing to deteriorating conditions in both Germany and France. Indeed, Germany’s PMI Manufacturing fell from 49.6 to 48.4 and France dropped from 48.8 to 47.8.
By contrast, services continue to provide a much-needed buffer. Germany’s service-sector growth slowed (down from 54.6 to 62.7) but stayed comfortably positive. France returned to expansion (up from 48.0 to 50.8). With the services sector carrying far more weight in the Eurozone economy, the currency bloc is still on track for faster growth in Q4 compared with Q3.
HSI Index Falls to November Low
Today, the Hong Kong stock index HSI (Hong Kong 50 on FXOpen) is showing downward momentum, dropping below 25,200 for the first time since mid-October.
Factors adding to selling pressure include (according to media reports):
→ Tech sector slump: Hong Kong is following the US, where investors have started offloading tech giants’ shares amid fears of an AI “bubble.” Market participants worry that current company valuations are overinflated. Even Nvidia’s strong report released this week only provided a short-term boost.
→ Geopolitics: In addition to strained trade relations between China and the US, tensions with Japan have added to uncertainty.
→ China’s economic data: Indicators continue to raise concerns despite government stimulus measures.
Technical analysis of the HSI (Hong Kong 50 on FXOpen) shows that price action since late summer 2025 formed an upward channel (marked in blue).
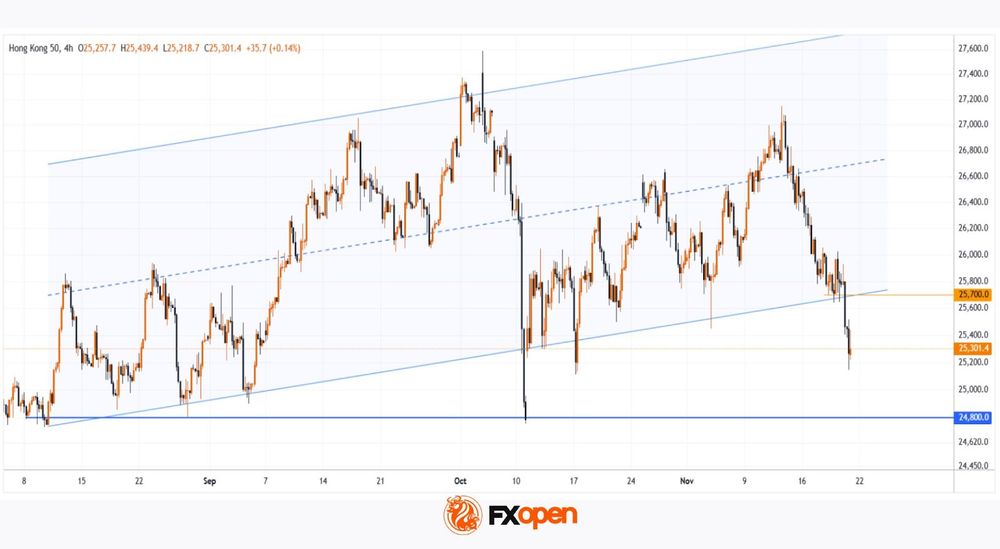
At the same time:
→ on 5 November, the price rebounded sharply from the lower boundary, confirming strong buying interest;
→ this week (as indicated by the arrow), it failed to reverse upwards.
As a result, bears have pushed through an important support level and are attempting to consolidate their gains.
It is possible that:
→ the 25,700 level (where the channel was broken) may act as resistance;
→ bears may grow more ambitious, potentially driving the HSI (Hong Kong 50 on FXOpen) down to test key support around 24,800 in the near term.
Trade global index CFDs with zero commission and tight spreads. Open your FXOpen account now or learn more about trading index CFDs with FXOpen.
This article represents the opinion of the Companies operating under the FXOpen brand only. It is not to be construed as an offer, solicitation, or recommendation with respect to products and services provided by the Companies operating under the FXOpen brand, nor is it to be considered financial advice.
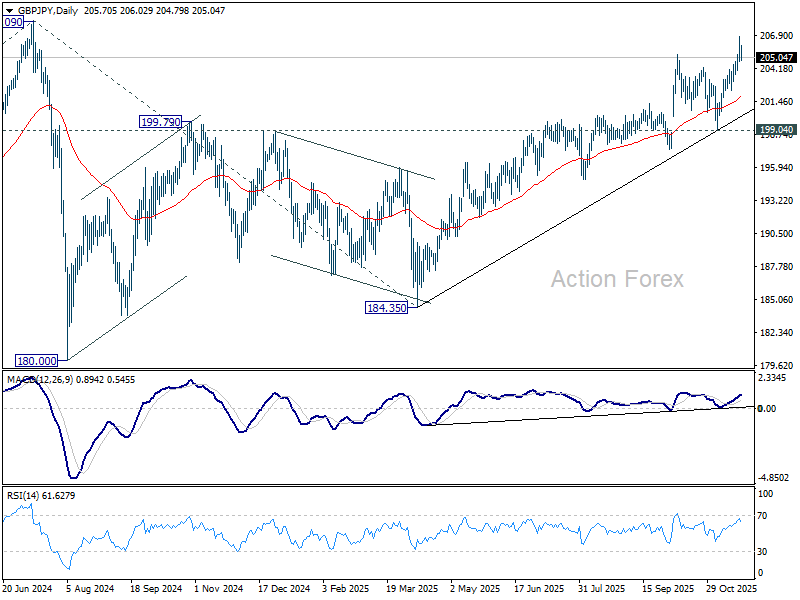
GBP/JPY Daily Outlook
Daily Pivots: (S1) 204.81; (P) 205.84; (R1) 206.86; More...
Intraday bias in GBP/JPY is turned neutral first with current retreat and some consolidations would be seen. Downside should be contained above 202.31 support. On the upside, break of 206.84 temporary top will target 208.09 high. Decisive break there will confirm long term up trend resumption.
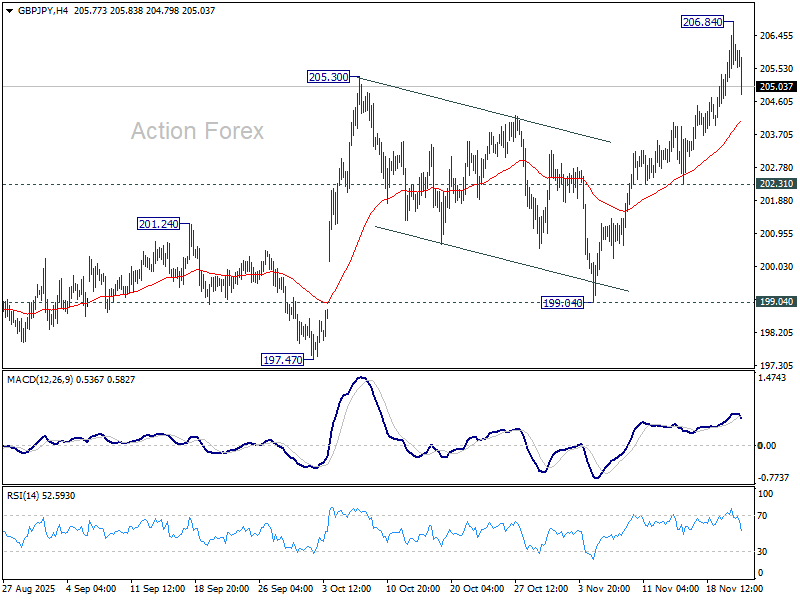
In the bigger picture, price actions from 208.09 (2024 high) are seen as a corrective pattern which might have completed at 184.35. Firm break of 208.09 high will resume the up trend from 123.94 (2020 low). Next target is 61.8% projection of 148.93 to 208.09 from 184.35 at 220.90. However, decisive break of 199.04 support will dampen this view and extend the corrective pattern with another fall.
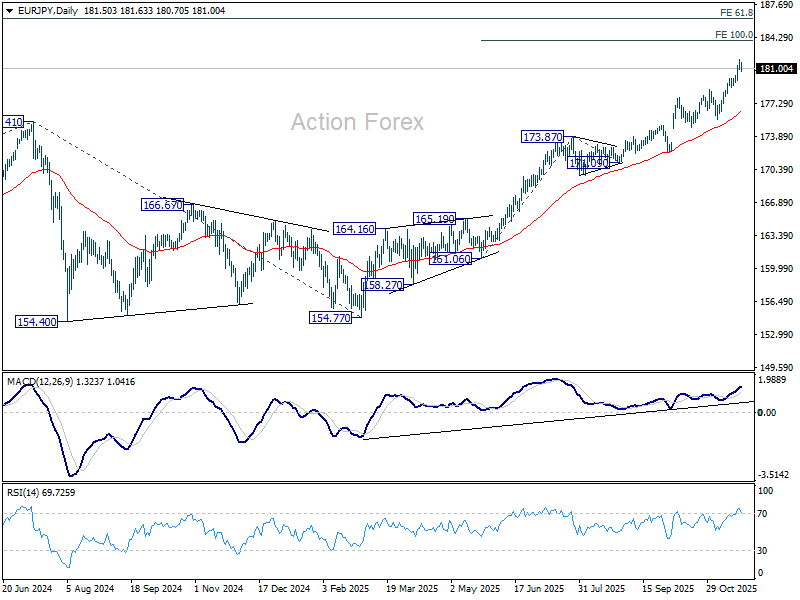
EUR/JPY Daily Outlook
Daily Pivots: (S1) 181.00; (P) 181.50; (R1) 182.04; More...
Intraday bias in EUR/JPY is turned neutral first with current retreat, and some consolidations would be seen. But downside should be contained above 178.80 resistance turned support. On the upside, break of 181.98 will resume larger up trend to 100% projection of 161.06 to 173.87 from 171.09 at 183.90. Firm break there will target 186.31 projection level next.
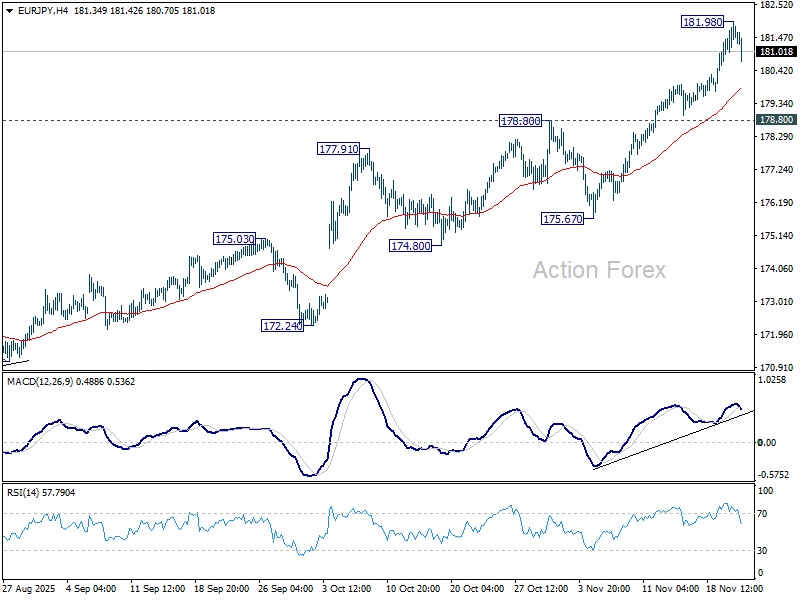
In the bigger picture, up trend from 114.42 (2020 low) is in progress and should target 61.8% projection of 124.37 to 175.41 from 154.77 at 186.31. Outlook will continue to stay bullish as long as 55 W EMA (now at 169.00) holds, even in case of deep pullback.
EUR/GBP Daily Outlook
Daily Pivots: (S1) 0.8796; (P) 0.8818; (R1) 0.8840; More…
Intraday bias in EUR/GBP remains neutral as range trading continues. Considering bearish divergence condition in 4H MACD, firm break of 0.8765 support will confirm short term topping. Deeper fall should then be seen back to 55 D EMA (now at 0.8740) even still as a correction. On the upside, however, sustained trading above 0.8867 fibonacci level will carry larger bullish implications. Next near term target will be 100% projection of 0.8354 to 0.8752 from 0.8631 at 0.9029.
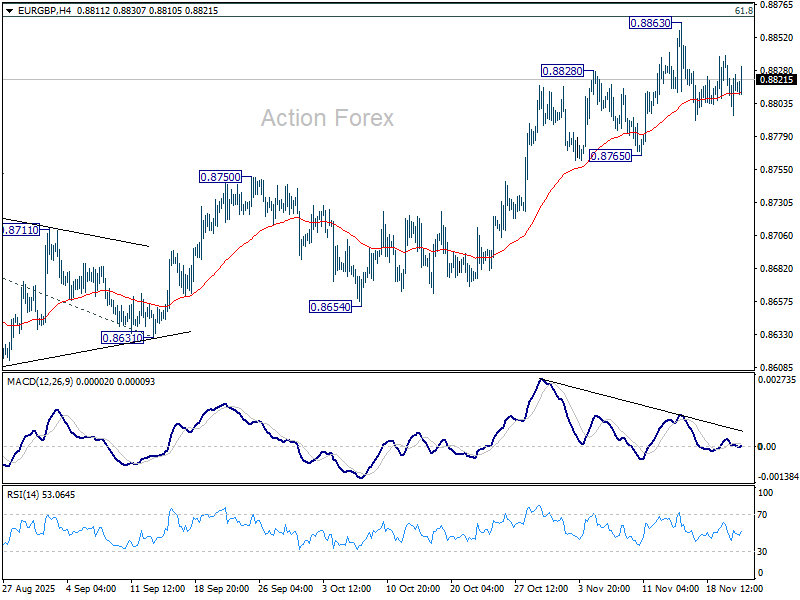
In the bigger picture, rise from 0.8221 medium term bottom is still seen as a corrective move. Upside should be limited by 61.8% retracement of 0.9267 to 0.8221 at 0.8867. Sustained trading below 55 W EMA (now at 0.8589) should confirm that this corrective bounce has completed. However, decisive break of 0.8867 will suggest that EUR/GBP is already reversing whole decline from 0.9267 (2022 high). That should pave the way back to 0.9267.
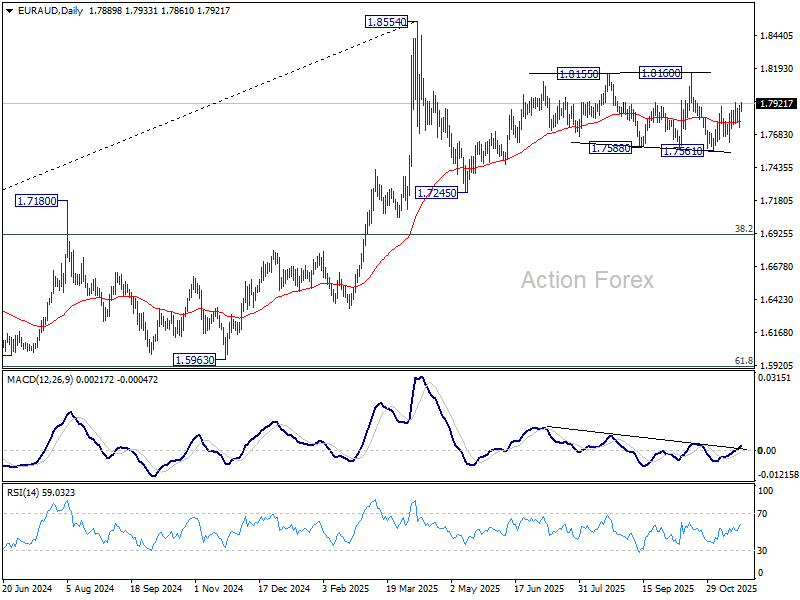
EUR/AUD Daily Outlook
Daily Pivots: (S1) 1.7790; (P) 1.7851; (R1) 1.7959; More...
Intraday bias in EUR/AUD remains neutral for the moment. On the upside, above 1.7934 will bring stronger rally towards 1.8160 resistance. On the downside, break of 1.7739 will turn bias back to the downside for 1.7561 support instead. Overall, EUR/AUD is extending a medium term corrective pattern and the next move will depend on the breakout from 1.7561/8160 range.
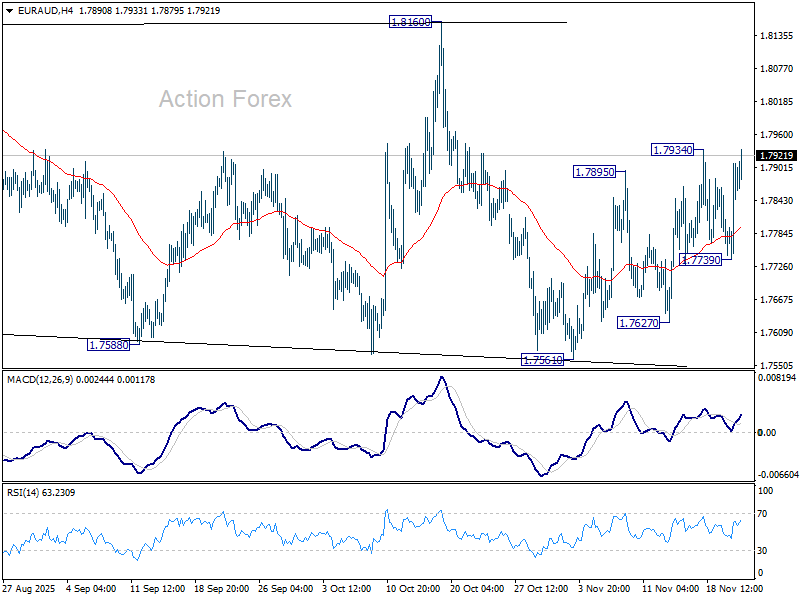
In the bigger picture, price actions from 1.8554 medium term top are seen as a corrective pattern. Sustained break of 55 W EMA (now at 1.7426) will suggest that it's correcting the whole rally from 1.4281 (2022 low). In this case, deeper decline would be seen to 38.2% retracement of 1.4281 to 1.8554 at 1.6922. Nevertheless, strong rebound from 55 W EMA will likely bring resumption of the up trend sooner.
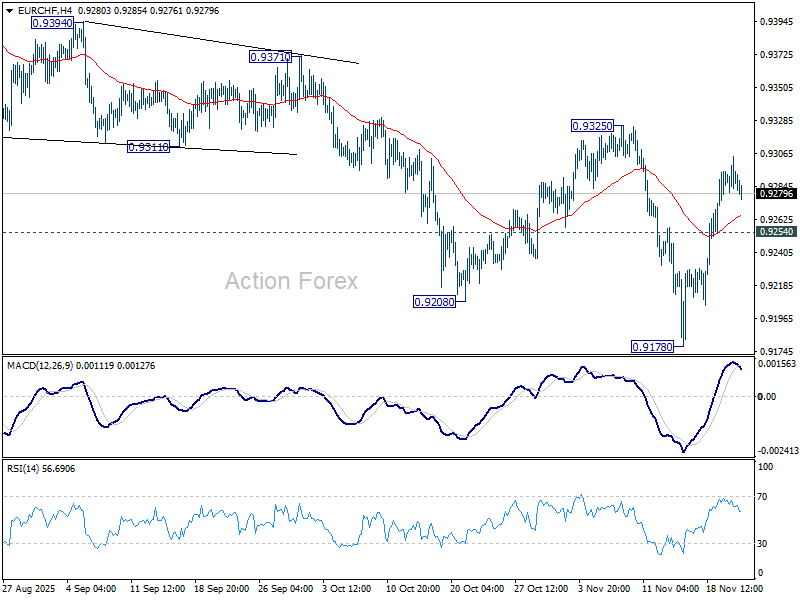
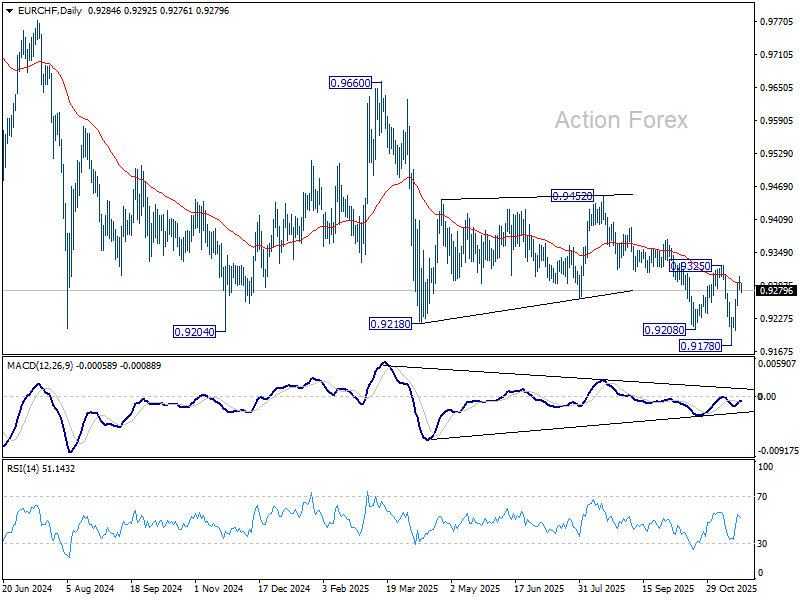
EUR/CHF Daily Outlook
Daily Pivots: (S1) 0.9281; (P) 0.9293; (R1) 0.9304; More....
Range trading continues in EUR/CHF and intraday bias remains neutral. Outlook will remain bearish as long as 0.9325 resistance holds. On the downside, below 0.9254 minor support will turn bias back to the downside for retesting 0.9178 low. Break there will resume larger down trend. However, decisive break of 0.9325 will bring stronger rally back towards 0.9452 resistance.
In the bigger picture, outlook remains bearish with EUR/CHF staying well inside long term falling channel after multiple rejection by 55 W EMA (now at 0.9377). Next target is 61.8% projection of 1.1149 to 0.9407 from 0.9928 at 0.8851. Break of 0.9452 resistance is needed to be the first sign of medium term bottoming. Otherwise, outlook will stay bearish in case of strong rebound.
Risk Sentiment Took an Impressive Turn for the Worse
Markets
Risk sentiment took an impressive turn for the worse during US trading. The combination of good Nvidia results published Wednesday after trading and decent US September payrolls release (119k job growth vs 53k expected) initially looked like giving investors some comfort after the recent risk-off repositioning. However, initial (equity) gains could not be maintained and soon morphed into a protracted profit-taking/sell-on-upticks pattern. After opening gains of up to 2% (Nasdaq), US indices closed between 0.84% (Dow) and 2.15% (Nasdaq) lower. For the S&P and the Nasdaq, key support (October lows) is again under heavy strain. US yields also faced conflicting drivers. The payrolls as such didn’t given any clear message on whether or not the Fed should already engage to an additional rate cut early December. However, with only about 25% of a cut priced in, there also was no reason to push (short-term) yields higher. What can’t go up, must come down. As such, a correction in asset prices isn’t a reason for the Fed to instantaneously react with additional easing. Even so, bond yields gradually declined further throughout the session and lost between 6.3 bps (5-y) and 3.3 bps (30-y). Still markets now only discount a probability of about 40 % of a December cut. Yesterday’s developments, including financial stability considerations, didn’t make things easier for the Fed. The US risk-off occurred for an important part after the European close. German yields changed less than 2 bps across the curve with the very long end slightly underperforming. (30-y +1.7 bps). FX again remained an area of relative calm in the overall turbulence. DXY at 100.15 closed little changed and stayed below the 100.25/36 resistance area. EUR/USD closed marginally lower at 1.153. USD/JPY (157.5) closed slightly higher (on yen weakness), but off the intraday highs. The risk-off also aborted the intraday rebound of sterling (EUR/GBP close at 0.882).
Asian equity markets this morning join the US risk-off move with losses of 3%+ (Taiwan, South Korea). The Japanese government unveiling its stimulus plan didn’t put any additional pressure on local bonds or the yen (see below). On FX markets, the dollar slightly underperforms (DXY 100.1, EUR/USD 1.154). UK October retail sales published this morning, were weak (-1.1% M/M). UK public sector net borrowing was sightly higher than expected. EUR/GBP rises a bit after the data (0.882). Later today, the calendar contains the EMU (and US) November PMI’s. Consensus expects EMU PMI’s to hold near last month’s levels (composite 52.5), which indicate the EMU economy is holding up relatively well. This cemented the ECB’s wait-and-see modus. Interesting to see whether last month’s relatively good news can be confirmed. After their recent rise, EMU yields probably are a bit more sensitive to a negative than to a positive surprise. US PMI’s usually are less important than the ISM’s, but especially a negative surprise (composite expected at 54.5) might cause markets to raise the expectations on a Fed rate cut. The main focus of global investors remains the equity correction. At least for now, the risk-off is no easy guarantee for real USD outperformance. In EUR/USD, the first important reference (1.1469, Nov 05 low) is still somewhat away.
News & Views
Japanese business activity picked up further in November. The composite PMI rose to 52, the joint-highest since August 2024 and carried by the services sector (53.1). While manufacturing kept struggling (48.8), output fell at the slowest pace since August and new orders fell only fractionally. Business confidence regarding future output rose to its highest since January. Anticipating capacity expansion, it helped employment increase at the strongest pace since June. This may have been related to rumours back then – facts by now – of largescale stimulus that the Japanese government was preparing. PM Takaichi’s cabinet this morning approved the biggest additional spending increase since at least 2005, barring the pandemic years (2020-22). Extra spending of JPY 17.7tn is aimed at price relief. Inflation indeed remains a hot topic, PMIs showed. Average input costs rose at the quickest rate in six months on labour costs and supplier price hikes. This led to a solid increase in selling prices. The cabinet said its spending package would push down inflation by 0.7 ppts from February to April. Prices have been rising faster than the central bank’s 2% since April 2022. October data this morning showed little signs of relief. Inflation sped up to 3% from 2.9% (headline and core ex. fresh food) and to 3.1% from 3% (core ex. fresh food and energy). The combined set of economic data and news today keeps the Bank of Japan on track to hike the policy rate by year’s end to 0.75%. Money markets remain unconvinced (+/- 15% probability). Both Japanese bonds and the yen strengthen today in a budget-related buy the rumour, sell the fact move. USD/JPY eases to 157.2, long-term bond yields drop more 6-7 bps after having hit record highs earlier this week.