Sample Category Title
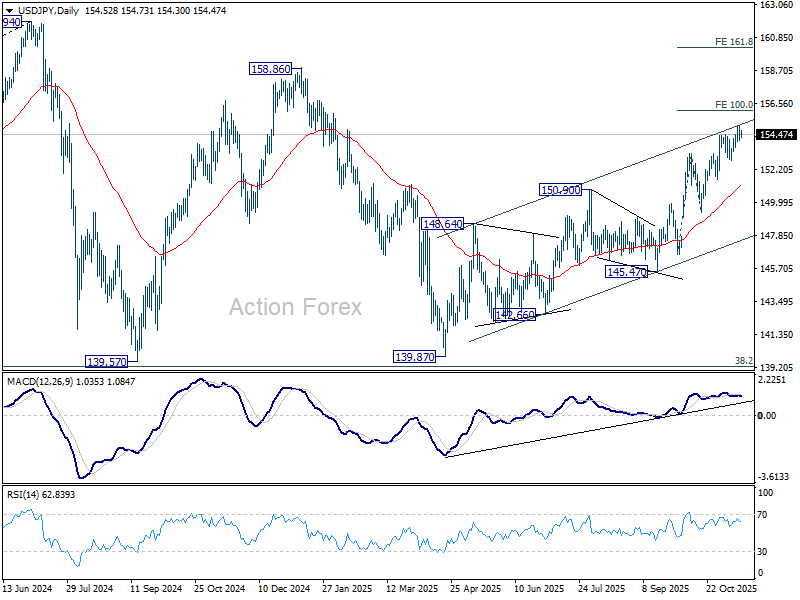
USD/JPY Daily Outlook
Daily Pivots: (S1) 154.10; (P) 154.56; (R1) 154.98; More...
Intraday bias in USD/JPY is turned neutral with current retreat. Some consolidations would be seen below 155.03 temporary top, but further rally is expected as long as 152.81 support holds. Above 155.03 will resume the rise from 139.87 to 100% projection of 146.58 to 153.26 from 149.37 at 156.05. Firm break there will pave the way to 158.86 key structural resistance.
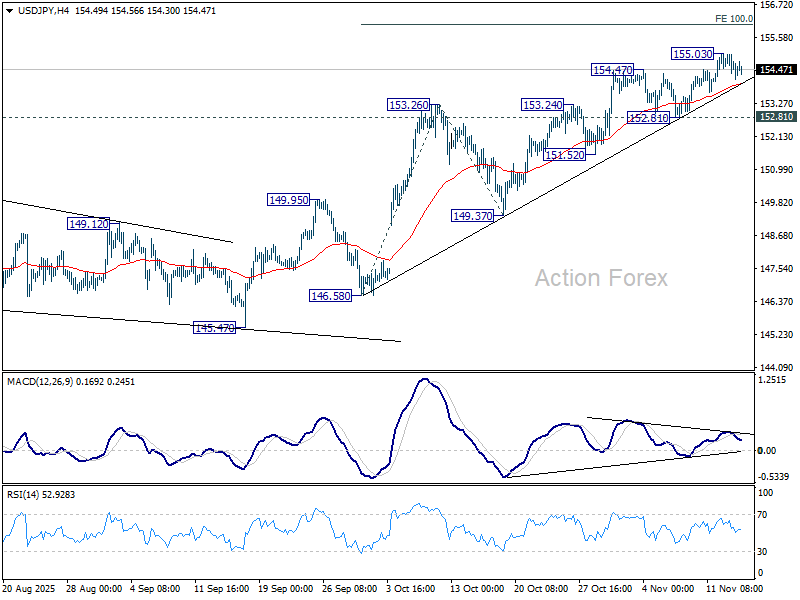
In the bigger picture, current development suggests that corrective pattern from 161.94 (2024 high) has completed with three waves at 139.87. Larger up trend from 102.58 (2021 low) could be ready to resume through 161.94 high. On the downside, break of 149.37 support will dampen this bullish view and extend the corrective pattern with another falling leg.
GBP/USD Daily Outlook
Daily Pivots: (S1) 1.3123; (P) 1.3170; (R1) 1.3238; More...
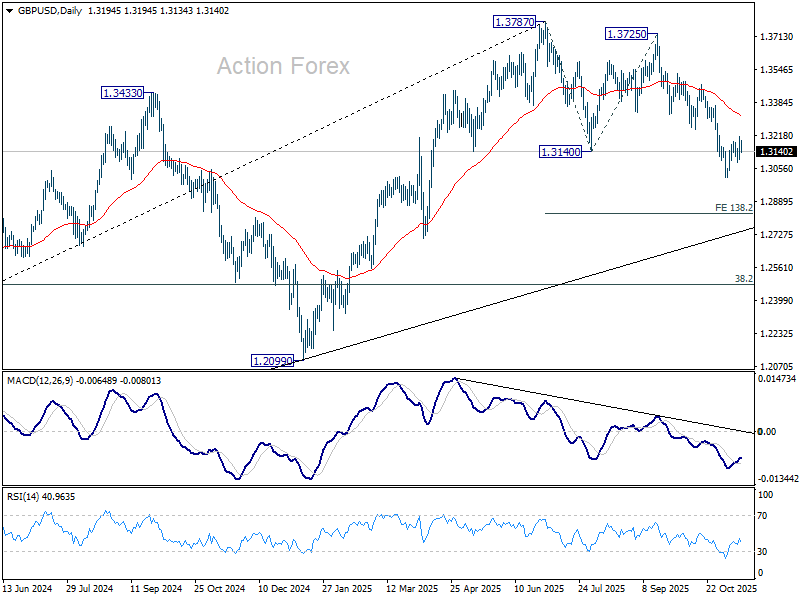
Intraday bias in GBP/USD remains neutral and further decline is expected with 1.3247 support turned resistance intact. On the downside, break of 1.3008 will target 138.2% projection of 1.3787 to 1.3140 from 1.3725 at 1.2831. Nevertheless, firm break of 1.3247 will suggest that fall from 1.3787 has completed as a corrective move already.
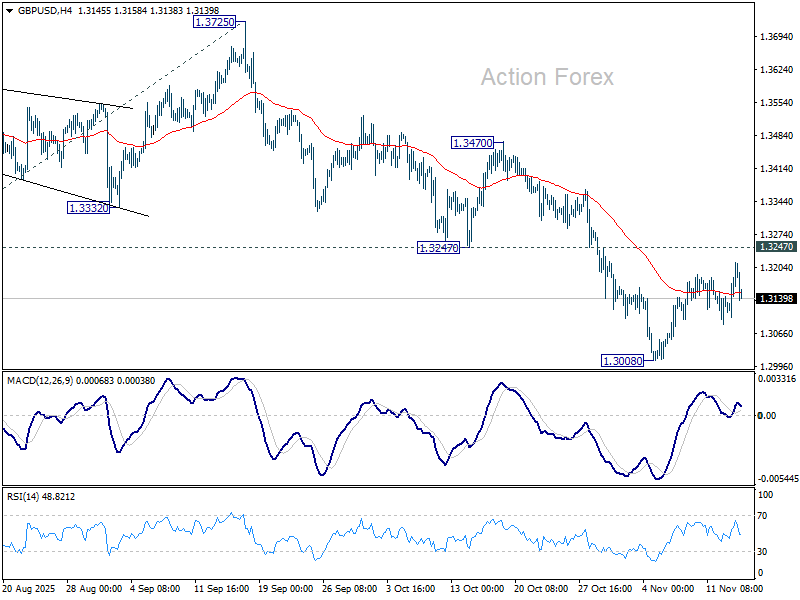
In the bigger picture, the break of 55 W EMA (now at 1.3185) is taken as the first sign that corrective rise from 1.0351 (2022 low) has completed. Decisive break of trend line support (now at 1.2780) will solidify this case and target 38.2% retracement of 1.0351 to 1.3787 at 1.2474 next. Meanwhile, in case of another rise, strong resistance should emerge below 1.4248 (2021 high) to cap upside to preserve the long term down trend.
EUR/USD Daily Outlook
Daily Pivots: (S1) 1.1590; (P) 1.1623; (R1) 1.1667; More…
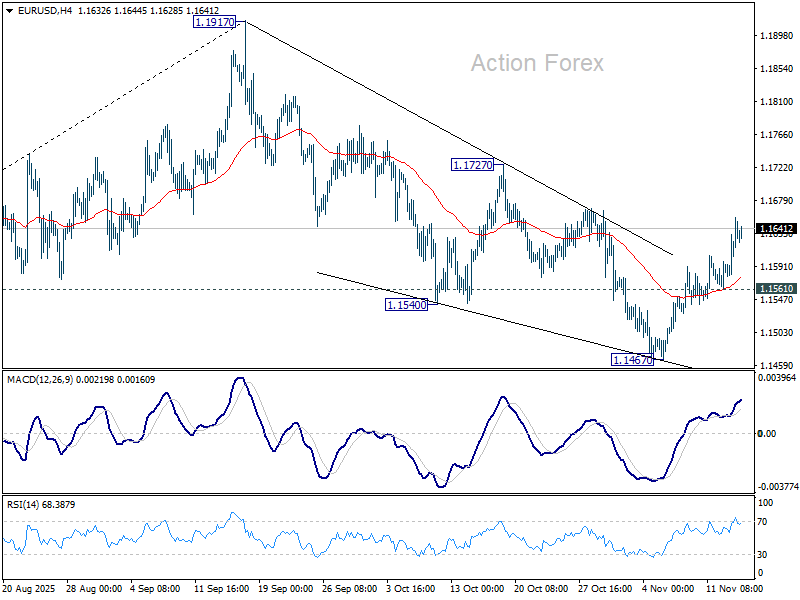
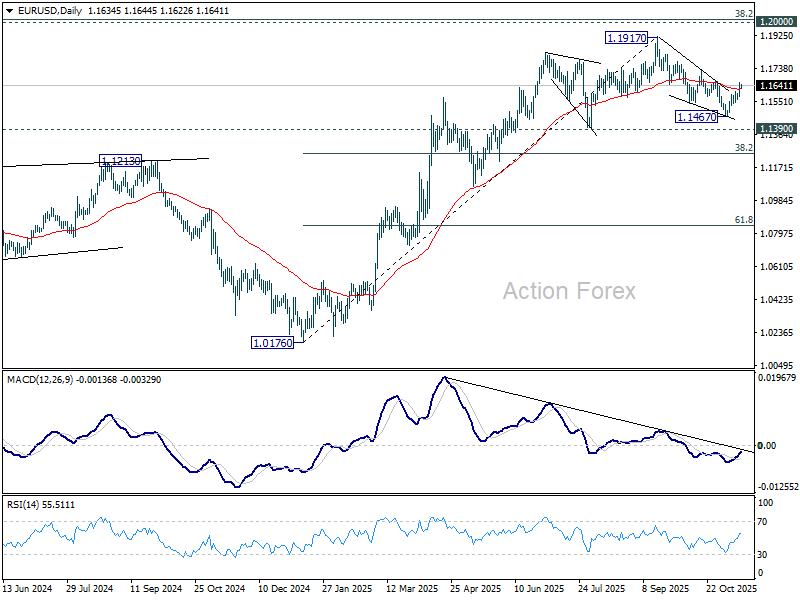
Current development suggests that EUR/USD's fall from 1.1971 has completed as a correction, with three waves down to 1.1467. Intraday bias is mildly on the upside for 1.1727 resistance. Firm break there will solidify this case and bring stronger rally to retest 1.1971 high. On the downside, however, break of 1.1561 minor support will revive near term bullish and target 1.1467 and below.
In the bigger picture, considering bearish divergence condition in D MACD, a medium term top is likely in place at 1.1917, just ahead of 1.2 key psychological level. As long as 55 W EMA (now at 1.1306) holds, the up trend from 0.9534 (2022 low) is still expected to continue. Decisive break of 1.2000 will carry larger bullish implications. However, sustained trading below 55 W EMA will argue that rise from 0.9534 has completed as a three wave corrective bounce, and keep long term outlook outlook bearish.
AUD/USD Daily Report
Daily Pivots: (S1) 0.6509; (P) 0.6545; (R1) 0.6565; More...
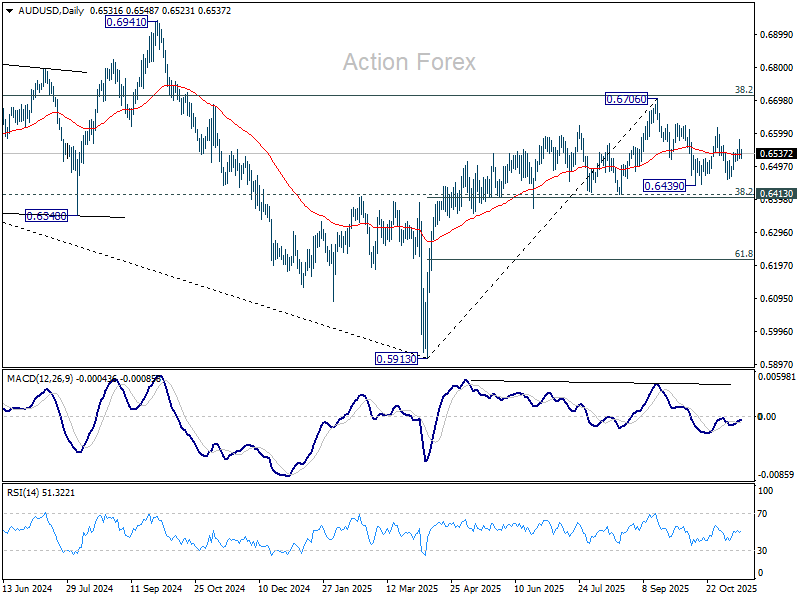
AUD/USD is still bounded in range of 0.6457/6616 and intraday bias stays neutral. On the downside, break of 0.6457 will target 0.6413 cluster (38.2% retracement of 0.5913 to 0.6706 at 0.6403). Decisive break there will carry larger bearish implications. On the upside, break of 0.6616 will bring retest of 0.6706 high instead.
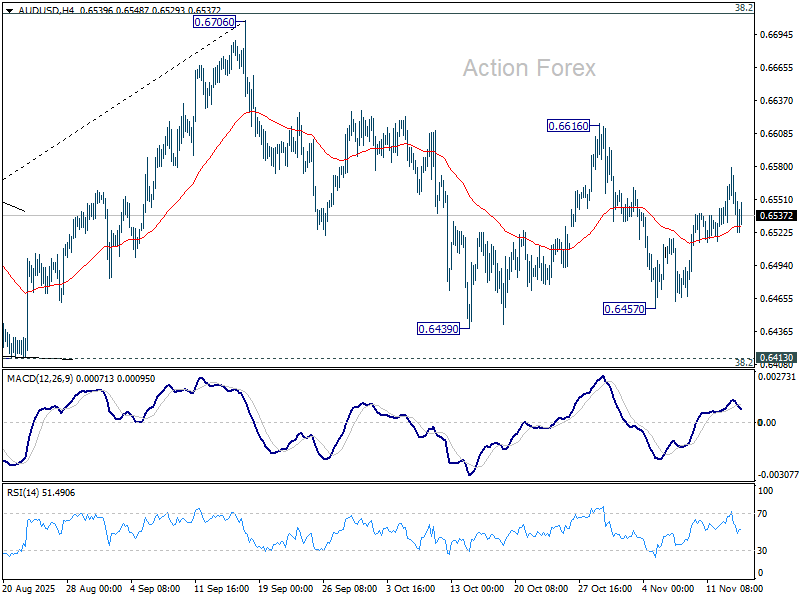
In the bigger picture, there is no clear sign that down trend from 0.8006 (2021 high) has completed. Rebound from 0.5913 is seen as a corrective move. Outlook will remain bearish as long as 38.2% retracement of 0.8006 to 0.5913 at 0.6713 holds. Break of 0.6413 support will suggest rejection by 0.6713 and solidify this bearish case. Nevertheless, considering bullish convergence condition in W MACD, sustained break of 0.6713 will be a strong sign of bullish trend reversal, and pave the way to 0.6941 structural resistance for confirmation.
USD/CAD Daily Outlook
Daily Pivots: (S1) 1.4001; (P) 1.4020; (R1) 1.4054; More...
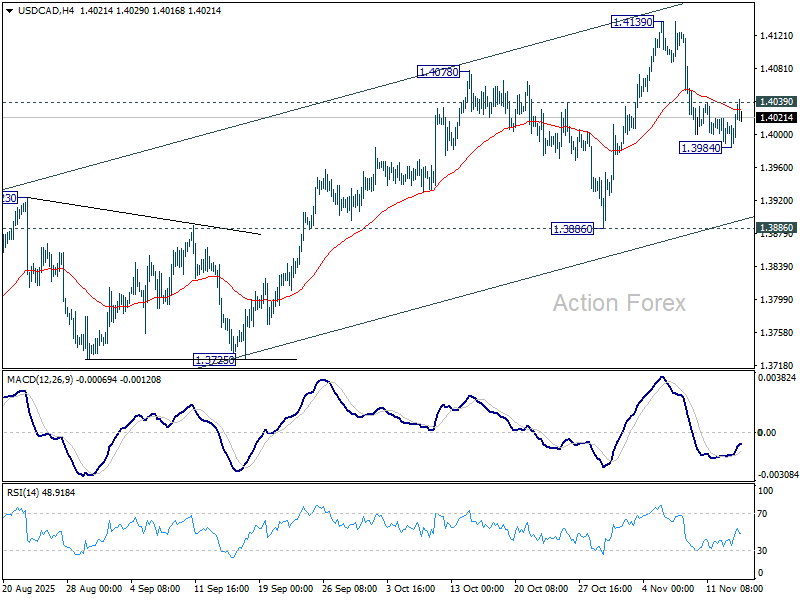
Intraday bias in USD/CAD is turned neutral first with current recovery. Firm break of 1.4039 minor resistance will argue that the pullback from 1.4139 has completed. Bias will be flipped back to the upside for retesting 1.4139. Further break there will resume the rally from 1.3538 to 61.8% retracement of 1.4791 to 1.3538 at 1.4312. On the downside, below 1.3984 will extend the fall from 1.4139 towards 1.3886 support.
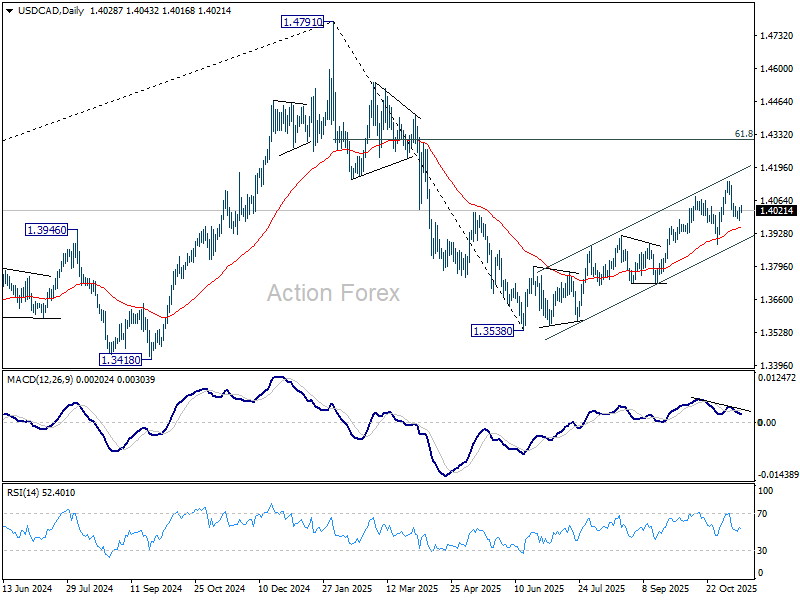
In the bigger picture, price actions from 1.4791 medium term top is likely just unfolding as a correction to up trend from 1.2005 (2021 low), with rise from 1.3538 as the second leg. A third leg should follow before up trend resumption. That is, range trading is set to extend for the medium term. For now, this will remain the favored case as long as 1.3886 support holds. However, firm break of 1.3886 will revive the case that fall from 1.4791 is indeed a larger scale correction.
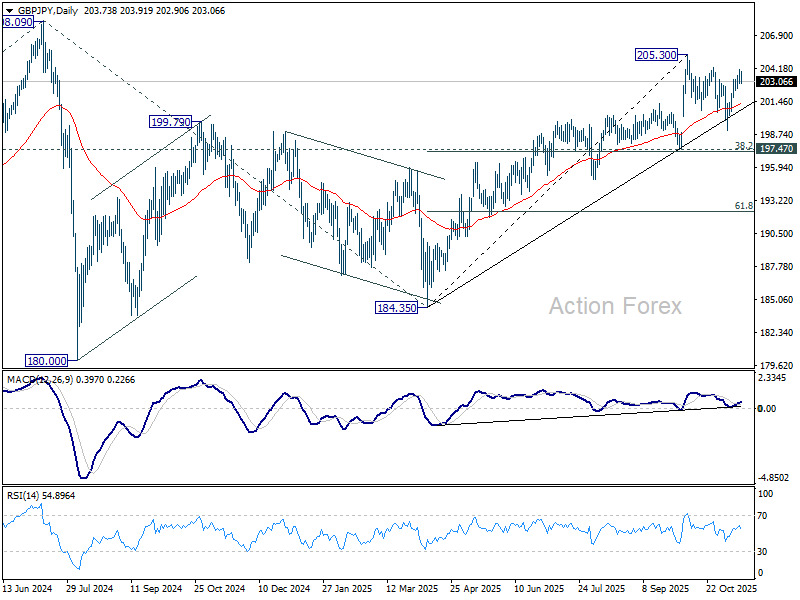
GBP/JPY Daily Outlook
Daily Pivots: (S1) 203.14; (P) 203.61; (R1) 204.25; More...
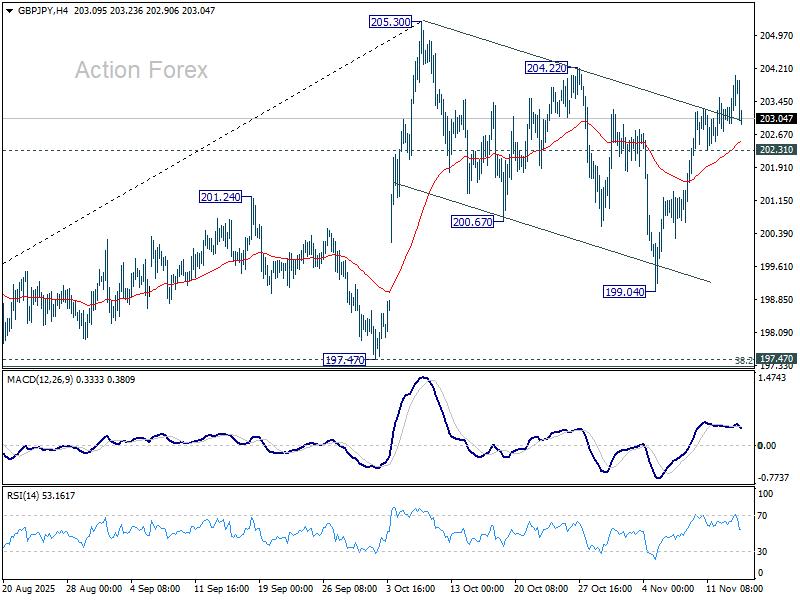
GBP/JPY lost momentum ahead of 204.22 resistance and intraday bias stays neutral. On the upside, break of 204.22 resistance should confirm that correction from 205.30 has completed with three waves at 199.04. Further rise should be seen through 205.30 to resume the larger rally from 184.53. On the downside, below 202.31 minor support will turn bias to the downside to 199.04 and below to extend the correction.
In the bigger picture, price actions from 208.09 (2024 high) are seen as a corrective pattern which might have completed at 184.35. Firm break of 208.09 high will resume the up trend from 123.94 (2020 low). Next target is 61.8% projection of 148.93 to 208.09 from 184.35 at 220.90. However, decisive break of 197.47 support will dampen this view and extend the corrective pattern with another fall.
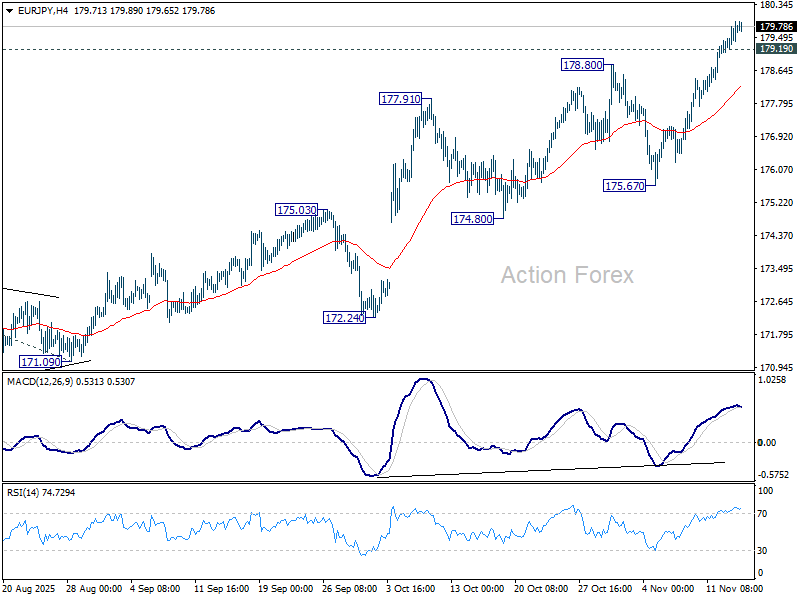
EUR/JPY Daily Outlook
Daily Pivots: (S1) 179.37; (P) 179.65; (R1) 180.08; More...
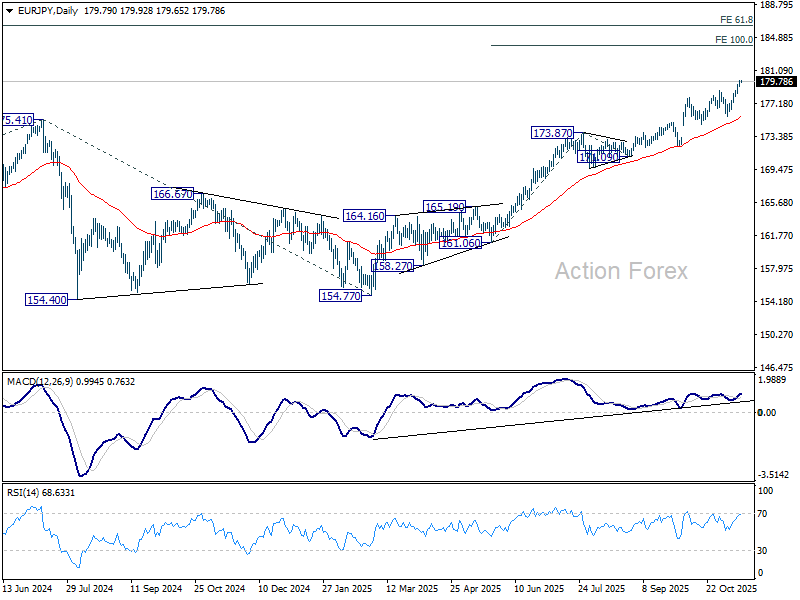
EUR/JPY's rally continues today and intraday bias stays on the upside. Current up trend should target 100% projection of 161.06 to 173.87 from 171.09 at 183.90 next. On the downside, below 179.19 minor support will turn intraday bias neutral and bring consolidations. But outlook will stay bullish as long as 175.67 support holds, in case of retreat.
In the bigger picture, up trend from 114.42 (2020 low) is in progress and should target 61.8% projection of 124.37 to 175.41 from 154.77 at 186.31. Outlook will continue to stay bullish as long as 55 W EMA (now at 168.56) holds, even in case of deep pullback.
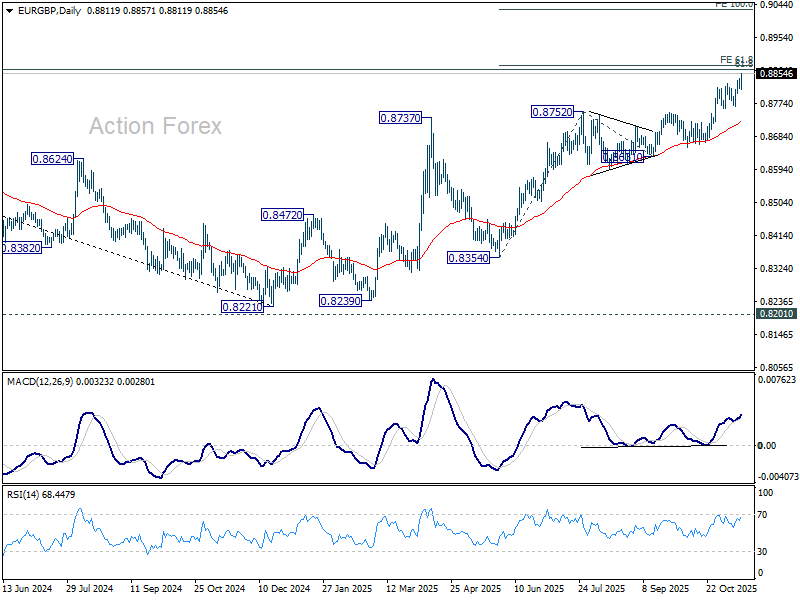
EUR/GBP Daily Outlook
Daily Pivots: (S1) 0.8811; (P) 0.8828; (R1) 0.8839; More…
EUR/GBP's rally continues today and intraday bias remains on the upside for 0.8867 fibonacci level. Firm break there will carry larger bullish implications. Next near term target will be 100% projection of 0.8354 to 0.8752 from 0.8631 at 0.9029. On the downside, below 0.8811 will turn intraday bias neutral first. Further break of 0.8765 support will confirm short term topping.
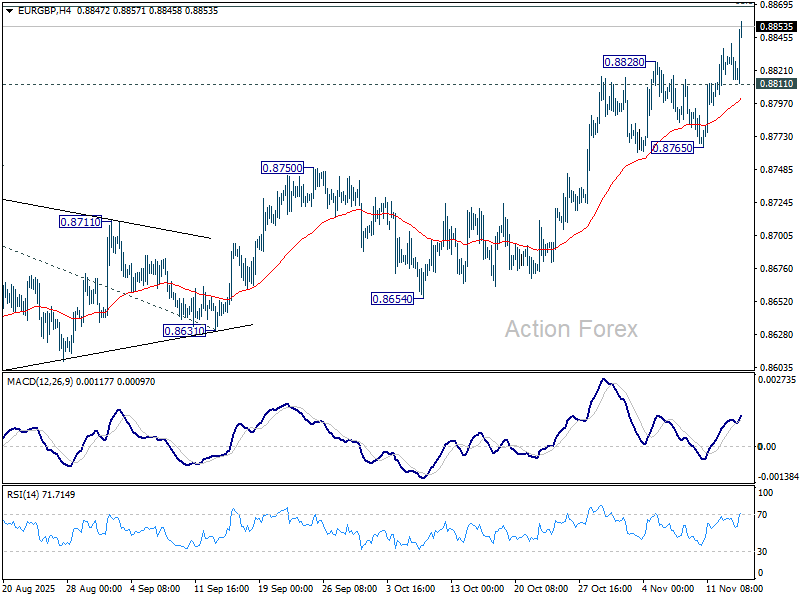
In the bigger picture, rise from 0.8221 medium term bottom is still seen as a corrective move. Upside should be limited by 61.8% retracement of 0.9267 to 0.8221 at 0.8867. Firm break of 0.8654 support will be the first sign that this corrective bounce has completed. However, decisive break of 0.8867 will suggest that EUR/GBP is already reversing whole decline from 0.9267 (2022 high). That should pave the way back to 0.9267 (2022 high).
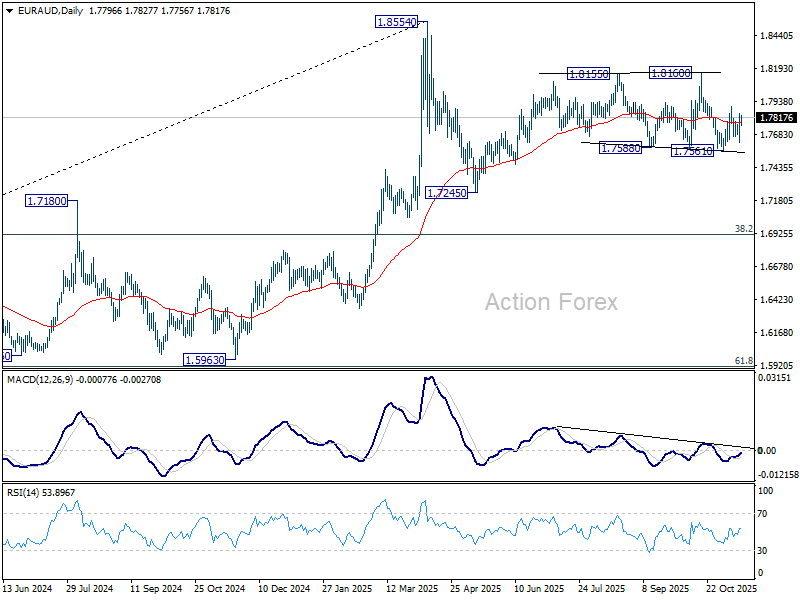
EUR/AUD Daily Outlook
Daily Pivots: (S1) 1.7685; (P) 1.7767; (R1) 1.7903; More...
EUR/AUD recovered notably but stays in range of 1.7561/7895 and intraday bias remains neutral. On the downside, break of 1.7561 support will revive the bearish case that corrective pattern from 1.8554 is in the third leg, and target 1.7245 support. On the upside, though, above 1.7895 will resume the rebound from 1.7561 to 1.8160 resistance next.
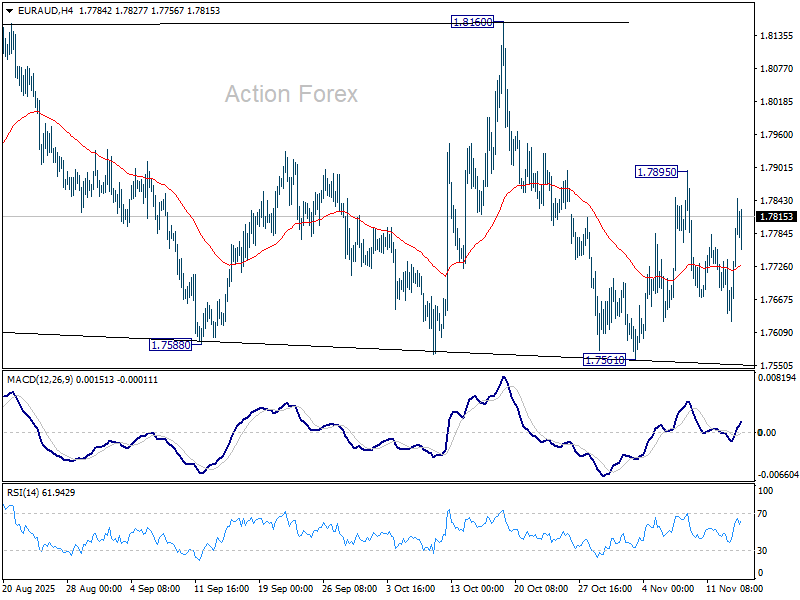
In the bigger picture, price actions from 1.8554 medium term top are seen as a corrective pattern. Sustained break of 55 W EMA (now at 1.7424) will suggest that it's correcting the whole rally from 1.4281 (2022 low). In this case, deeper decline would be seen to 38.2% retracement of 1.4281 to 1.8554 at 1.6922. Nevertheless, strong rebound form 55 W EMA will likely bring resumption of the up trend sooner.
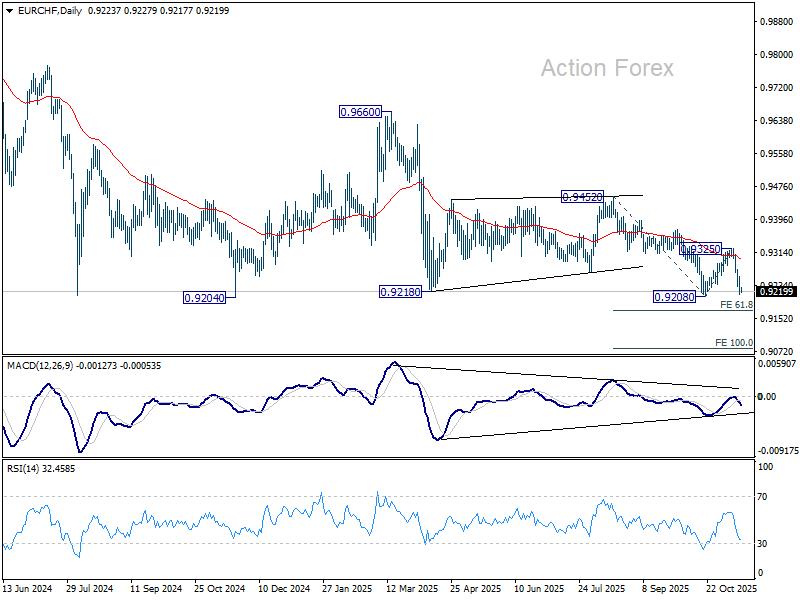
EUR/CHF Daily Outlook
Daily Pivots: (S1) 0.9207; (P) 0.9233; (R1) 0.9252; More....
Intraday bias in EUR/CHF remains on the downside for 0.9204/8 support zone. Break there will confirm larger down trend resumption. Next near term target is 61.8% projection of 0.9452 to 0.9208 from 0.9325 at 0.9175. Decisive break there could prompt downside acceleration to 100% projection at 0.9082. On the upside, above 0.9256 minor resistance will delay the bearish case and turn bias neutral first.
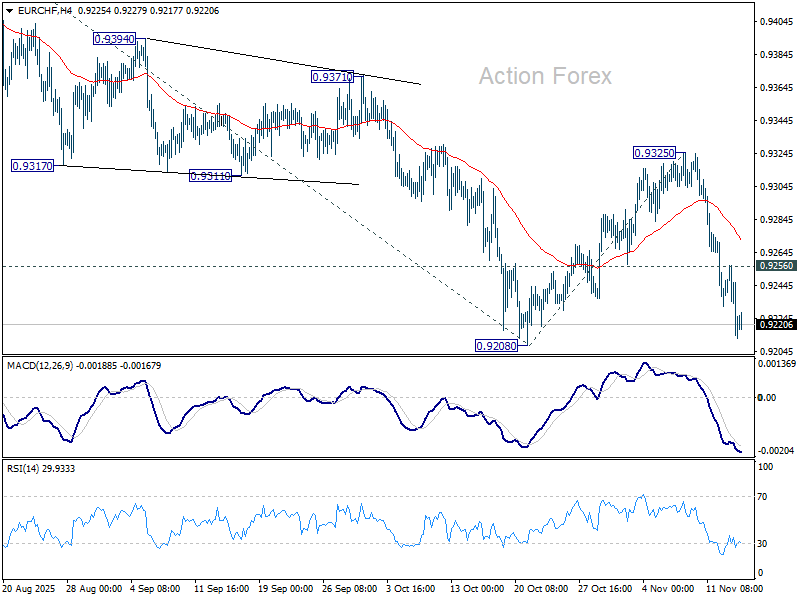
In the bigger picture, outlook remains bearish with EUR/CHF staying well inside long term falling channel after multiple rejection by 55 W EMA (now at 0.9383). Firm break of 0.9204 will resume the whole down trend from 1.2004 (2018 high). Next target is 61.8% projection of 1.1149 to 0.9407 from 0.9928 at 0.8851. However, break of 0.9452 resistance will now be the first sign of medium term bottoming.