Sample Category Title
Forward Guidance: Canadian Consumer Prices and Spending in Focus in the Week Ahead
Delayed U.S. data releases due to the record long government shutdown could begin to trickle out in the week ahead – including potentially the September nonfarm payroll data that was just days away from release before the government shut down in early October.
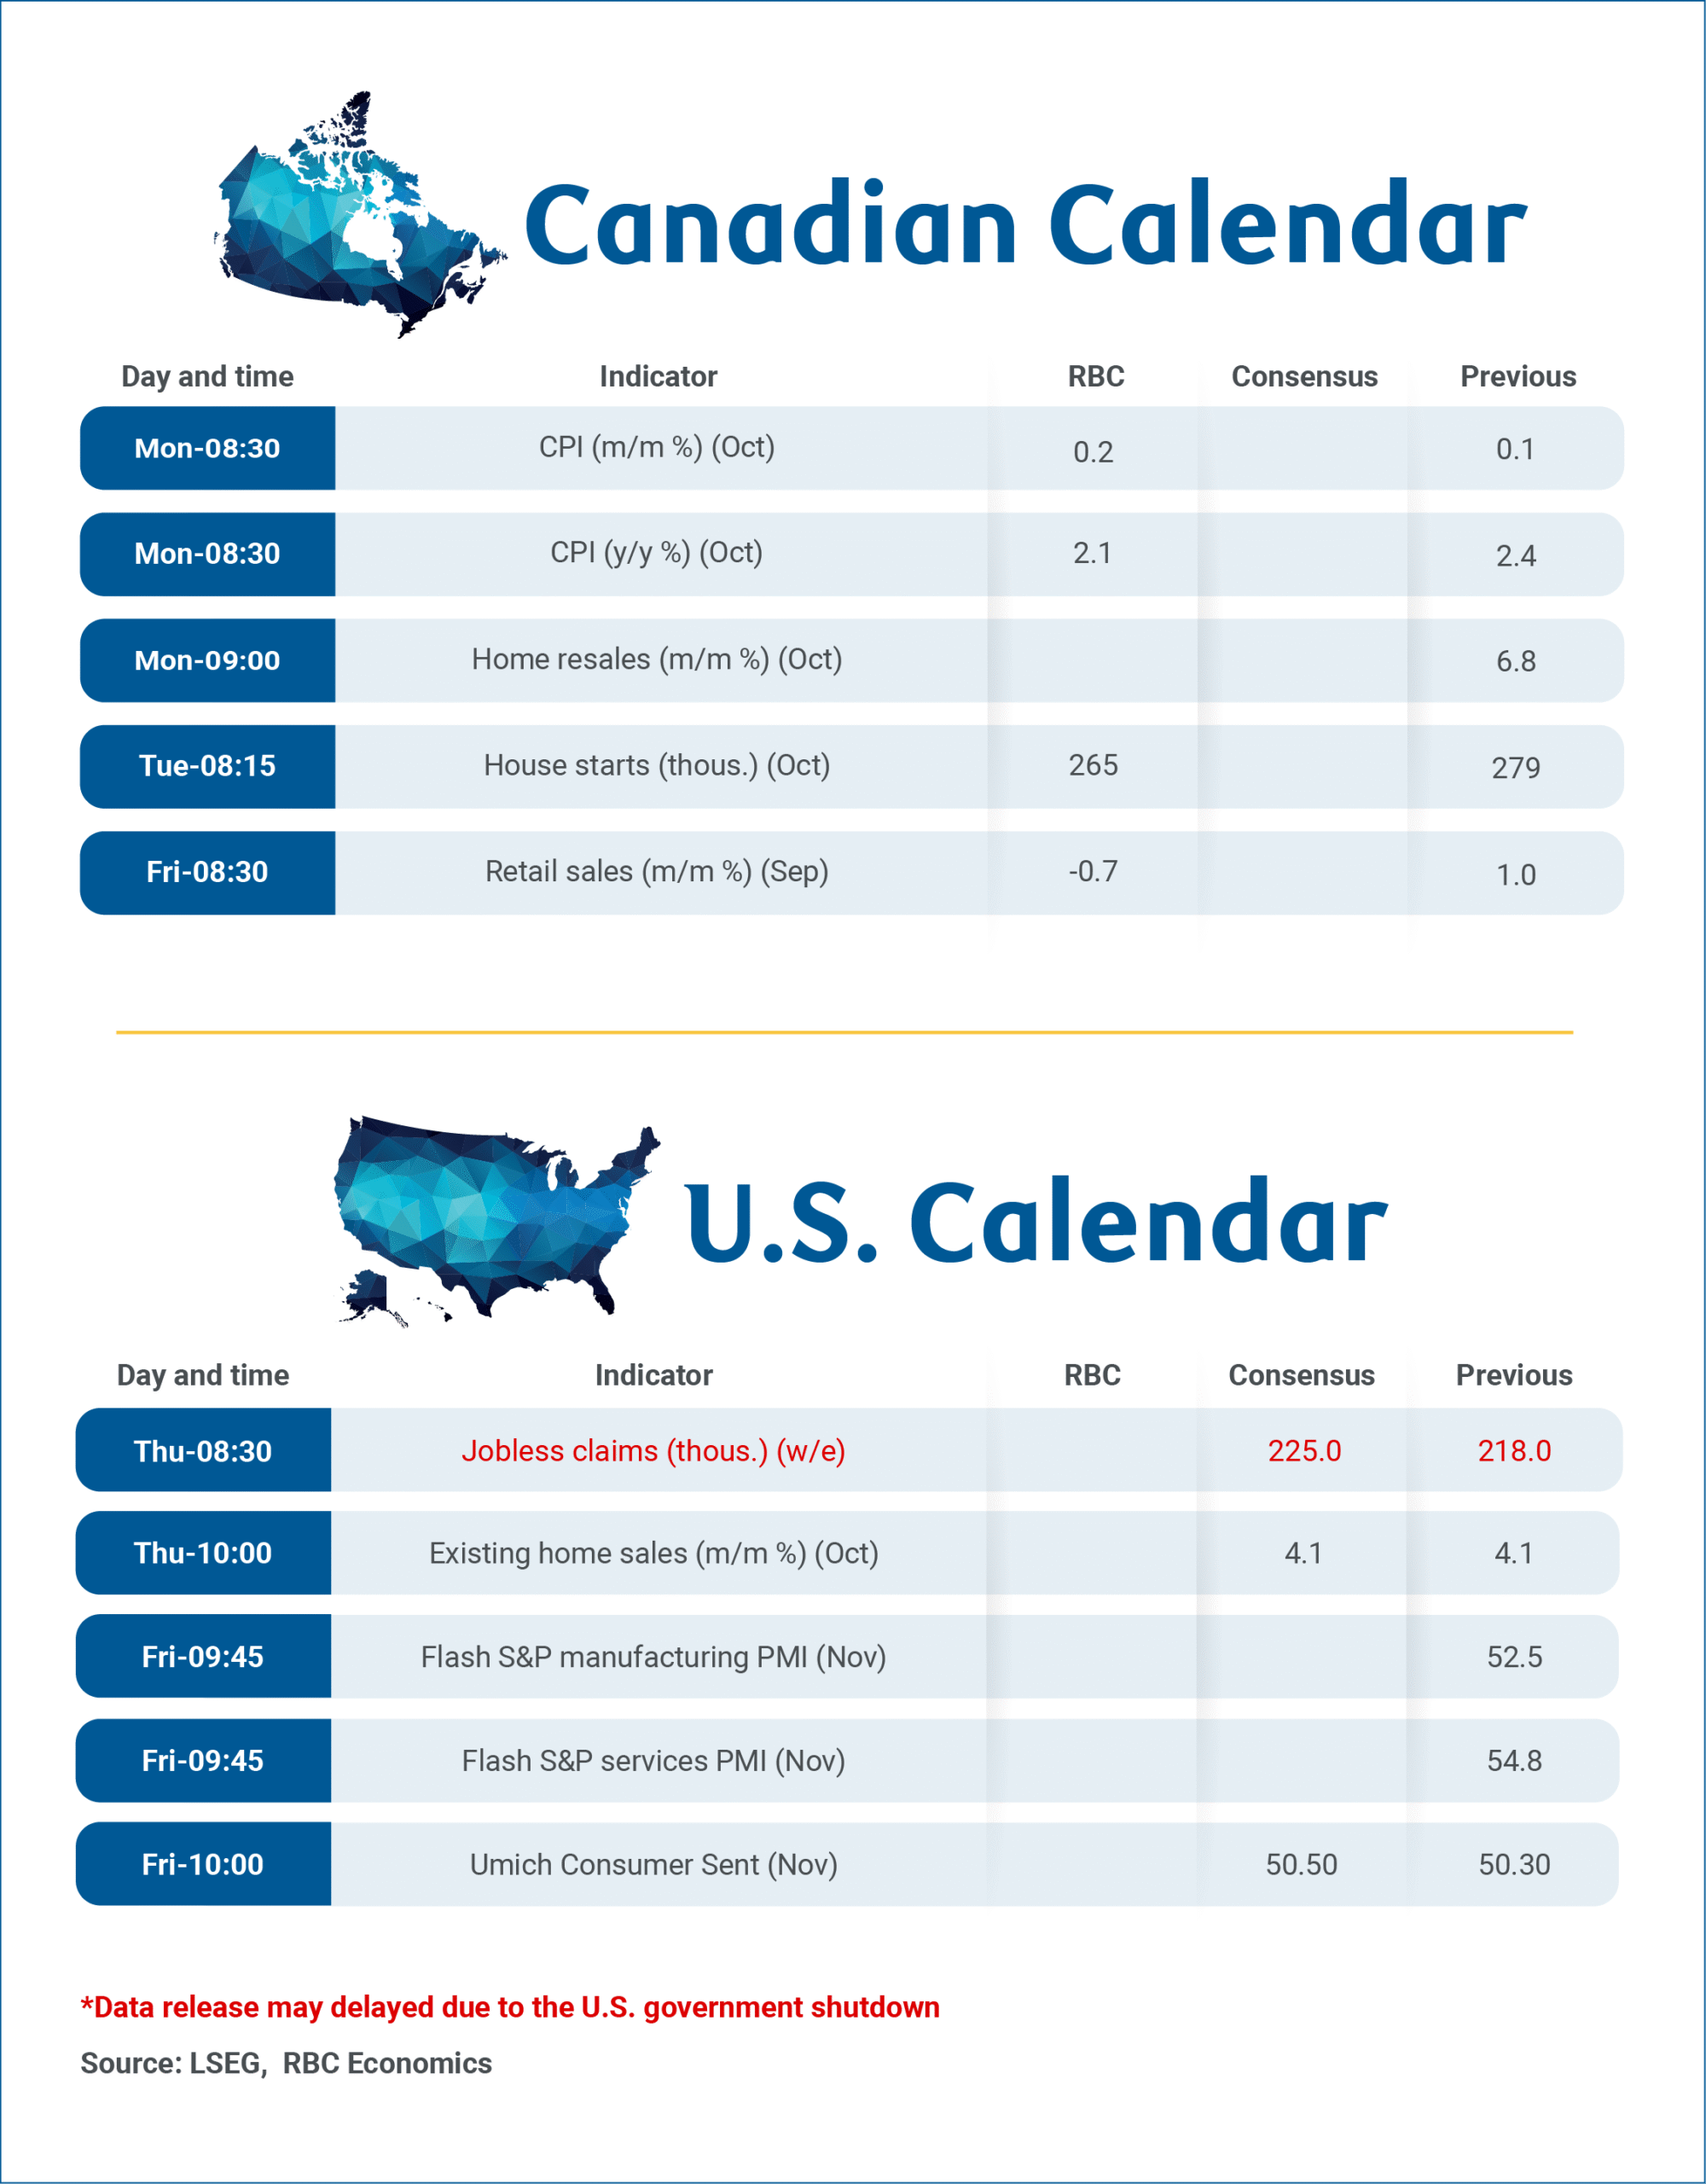
Next week’s Canadian economic calendar includes important releases on Canada’s household spending and inflation backdrop. October CPI data will likely be the primary focus, with housing starts and resales also set for release on Monday and September retail sales (and the advance estimate for October) to follow on Friday.
We forecast headline inflation to edge down to a 2.1% year-over-year rate, following last month's upside surprise. This moderation is expected to be primarily driven by lower gasoline prices, which fell 5% from September. We expect food price growth to hold close to September’s 3.8% annual rate in October. The October data will include the annual update on property tax prices in the CPI data. Significant property tax increases again took effect in some major population centers, but nationally we expect a smaller increase (4%) than the 6% increase in October a year ago.
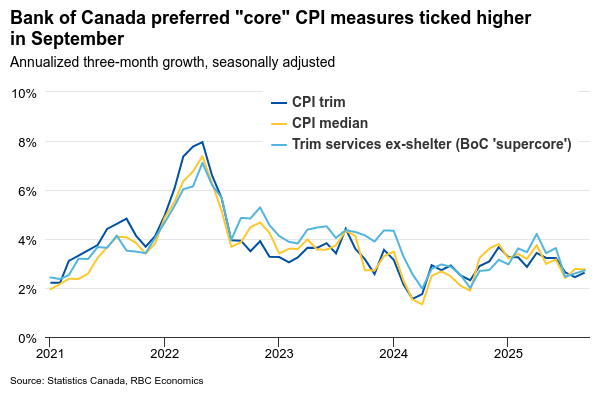
Headline CPI growth continues to be distorted on the downside by the removal of the cabon tax from energy products in most provinces in April. Broader measures of ‘core’ inflation are expected to remain above the Bank of Canada’s 2% target rate in October. We look for the price growth excluding food and energy products to hold at a 2.4% year-over-year rate. CPI-trim and CPI-median measures should hold around a 3% year-over-year rate.
Statistics Canada's advance estimate indicates retail sales declined 0.7% month-over-month in September, reversing most of a 1% increase in August. On a quarterly annualized basis, retail sales volume growth likely maintained positive momentum in Q3, albeit at a slower pace than Q2. This also aligns with our own cardholder spending analysis for Q3, which indicates consumer resilience despite ongoing moderation in spending patterns.
Week ahead data watch:
We anticipate housing starts will retreat in October following September's surge. Our forecast stands at 265,000 units, representing a 5% monthly decline that partially reverses September's 14% increase.
Canada’s October home resales report on Monday should show a mixed housing market backdrop across the country, with early market reports pointing to elevated inventories to sales remaining in less affordable markets in B.C. and Ontario but resale increases in other regions.
Weekly Focus: Looking Towards Post-Shutdown US Data
The end of US government shutdown was not enough to drive a lasting recovery in markets' risk appetite, with equity and bond markets weakening towards the end of the week. While the government reopening itself has a positive impact on the economy, the focus remains on the backlog of key US macro data which is now set to be released over the next few weeks. The latest Fed speakers have sounded increasingly hawkish and notably, three of the new incoming voters for 2026 (Kashkari, Logan and Hammack) have all said they opposed the previous decision to cut rates in October. Markets price the Fed's December rate decision as essentially a coin-flip between a cut and a hold, and we maintain our call for an unchanged rate decision.
The first major datapoint due for release will be the September Jobs Report, out most likely early next week. September JOLTs, PCE and Q3 GDP are expected to follow within roughly a week. The fate of October releases remains less clear, as the shutdown interfered with the data collection periods. The Bureau of Labor Statistics (BLS) could receive some responses for the October establishment survey (used for calculating the nonfarm payrolls) as it collects the November data. But the household survey, which is used to calculate the unemployment rate, is missing completely. Similarly, 2/3 of the inflation data for the CPI is collected with in-person visits to stores and is now also naturally missing.
As such, the White House suggested the October releases might even be cancelled altogether. Alternatively, BLS could release delayed, and heavily imputed estimates in conjunction with the November data. In any case, the November Jobs Report (scheduled for December 5th) will be the first major 'real-time' release to look out for. The data collection for November reports should have already started, so minor delays are still possible. This could end up being problematic for the Fed, as the important November CPI report is scheduled for the same day as the FOMC's next rate decision (10 December).
But while we wait, incoming data flow has generally been weaker than expected. The latest German ZEW index disappointed as the future expectations component declined. Similarly, the Sentix index of Euro Area investor confidence fell (-7.4, from -5.4) against expectations of a modest rebound. UK employment growth turned negative in October (-32k) as did the September estimate of GDP growth (-0.1%). October credit and production data from China signalled that support from past stimulus measures is starting to fade. And finally, the weekly private sector payroll estimates from ADP showed that US employment growth turned negative (-11k per week) during the four weeks leading up to October 25th.
As such, we will closely follow next Friday's flash November PMIs from euro area, the UK and the US to gain a clearer sense of the current growth momentum. PMIs have signalled improving growth outlook across developed markets through most of this year.
ECB's indicator of negotiated wages is due for release on Friday. While wage pressures remain a key indicator for gauging underlying inflation, the indicator is heavily influenced by one-off inflation compensation bonuses from last year. And finally on the other side of the Atlantic, the minutes from FOMC's October meeting could gather more attention than usual given the highly varying views heard from Fed speakers lately.
Sunset Market Commentary
Markets
UK markets trade very volatile today. It started with overnight rumours about UK Chancellor Reeves dropping her controversial tax-raising measures for the 2026 Budget to be released November 26. The last-minute turnaround seemed to be inspired by the coup attempts against the other Labour frontman, PM Starmer. Apart from the credibility perspective, the U-turn also placed doubt over the government’s ability to plug the budget hole and re-install existing (narrow) fiscal buffers. As a result, UK gilts and sterling sold off at the start of trading with UK yields sprinting more than 10 bps higher across the curve and EUR/GBP setting a new cycle top above 0.8860. Part of the losses were undone slightly after incurring them on reports of improved forecasts by the Office for Budget Responsibility. They expected productivity downgrade would be partially offset by other factors like strength in government receipts and stronger wage performance. As a result, the predicted fiscal hole (without building) buffer would be closer to £20bn than to £35bn. The UK asset-comeback move rapidly ran out of steam over worries that the budget watchdog’s forecasts would paint an overly optimistic picture for the UK economy. Anyway, today’s episode highlights the fragility of UK public finances, the lack of fiscal leeway by the government and market sensitivity to the theme. We expect UK risk premia to stay elevated in the run-up to the November 26 deadline. The UK yield curve bear steepens today with yields 6.2 bps (2-yr) to 12.2 bps (30-yr) higher across the curve.
The sharper risk correction grabs remaining headlines today. Main European indices lose 1.5% to 2% after reaching all-time highs earlier this week. US stock markets open 1%-1.5% lower. US Treasuries again outperform German Bunds on bond markets with daily changes on the US curve varying between -2.9 bps and -4.1 bps with the belly of the curve performing best. The eco calendar remains empty, but the US government is rumoured to return to publication starting next Tuesday or Wednesday. The September payrolls report and September producer prices are in pole-position as data were already gathered before the start of the US government shutdown. Headlines that net new borrowing by the German government will be €8bn higher than originally planned next year (€98bn or above €180bn including special funds for defense and infrastructure outside the core budget) help explain the Bund’s underperformance. Changes on the German curve are close to zero compared with yesterday. The dollar again showed two faces, initially profiting from the risk correction, but handing back gains on the diverging path of German Bunds and US Treasuries. EUR/USD currently changes hands around 1.1635 almost perfectly in line with starting levels.
News & Views
The European Commission is finalizing plans for an overhaul of the European Securities & Markets Authority into a model that is more like the US’ SEC. It entails a major transfer of national powers to the European regulator, including oversight of “significant” clearing houses, depositories and trading venues as well as all crypto firms and the creation of a Pan-European Market Operator so firms can use a single authorization to operate across the EU. The hope is that aligning Europe’s fragmented capital markets piece by piece ultimately leads to higher growth as private savings find their way outside national borders. The Commission’s proposal needs agreement in the European Parliament and the council of EU member states. While the likes of France have been a staunch proponent, other member states are more reluctant to cede national powers.
The US Trade Representative Greer said the US and Switzerland have “essentially” reached a trade agreement. The deal would lower tariffs from 39% currently to 15%, matching the EU’s rate. Greer added that Switzerland has additionally committed to investing $200bn in the US and that it promised to buy more Boeing planes. A Swiss delegation arrived yesterday in Washington DC and rumours of a potential trade deal were already circulating earlier this week. Combined with Swiss National Bank comments that dampened speculation of a return to negative rates and safe haven flows (especially today) have been a boon to CHF in recent days. The Swiss franc rose from EUR/CHF 0.931 end last week to 0.919 currently, the strongest Swiss franc level on record barring the volatile swings early 2015 in the wake of lifting the CHF cap.
EUR/USD Mid-Day Outlook
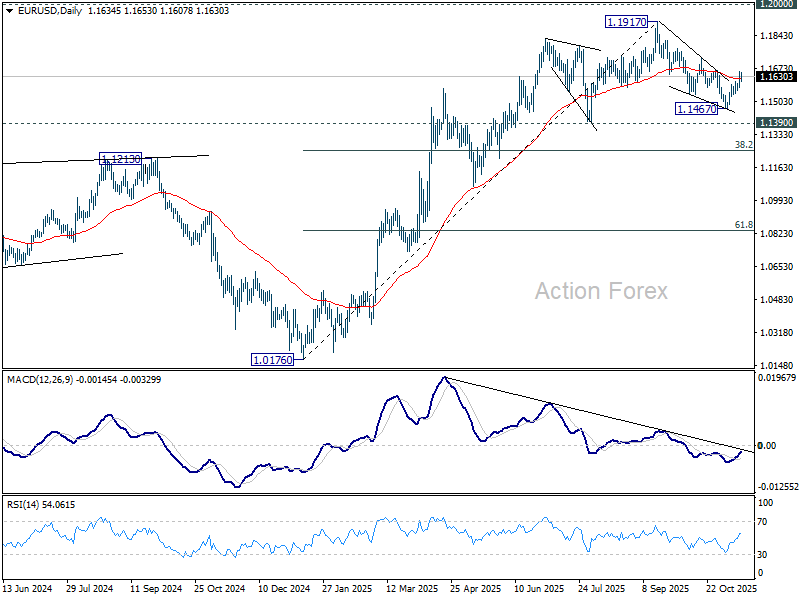
Daily Pivots: (S1) 1.1590; (P) 1.1623; (R1) 1.1667; More…
Intraday bias in EUR?USD stays mildly on the upside for 1.1724 resistance. Firm break there will solidify the case that fall from 1.1917 has completed as a three-wave correction. Further rise should then be seen to retest 1.1971 high. On the downside, however, break of 1.1561 minor support will revive near term bearishness and target 1.1467 and below.
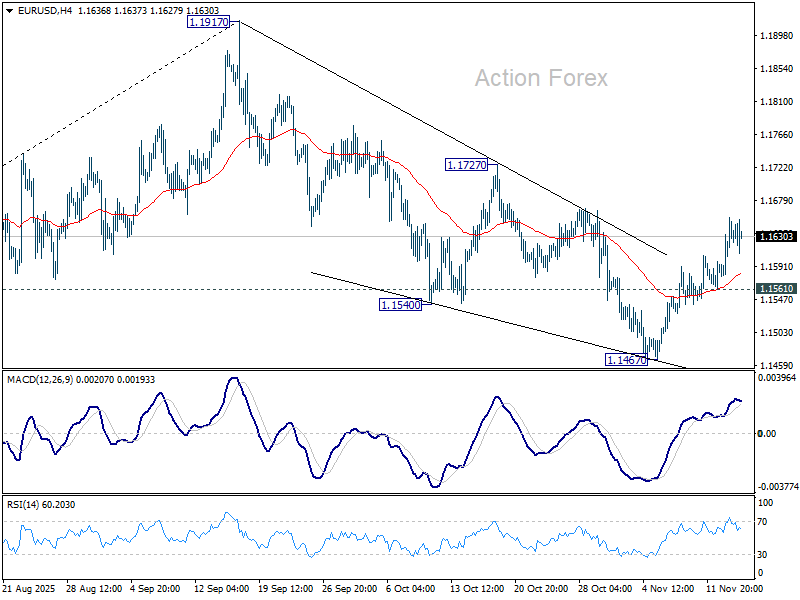
In the bigger picture, considering bearish divergence condition in D MACD, a medium term top is likely in place at 1.1917, just ahead of 1.2 key psychological level. As long as 55 W EMA (now at 1.1306) holds, the up trend from 0.9534 (2022 low) is still expected to continue. Decisive break of 1.2000 will carry larger bullish implications. However, sustained trading below 55 W EMA will argue that rise from 0.9534 has completed as a three wave corrective bounce, and keep long term outlook outlook bearish.
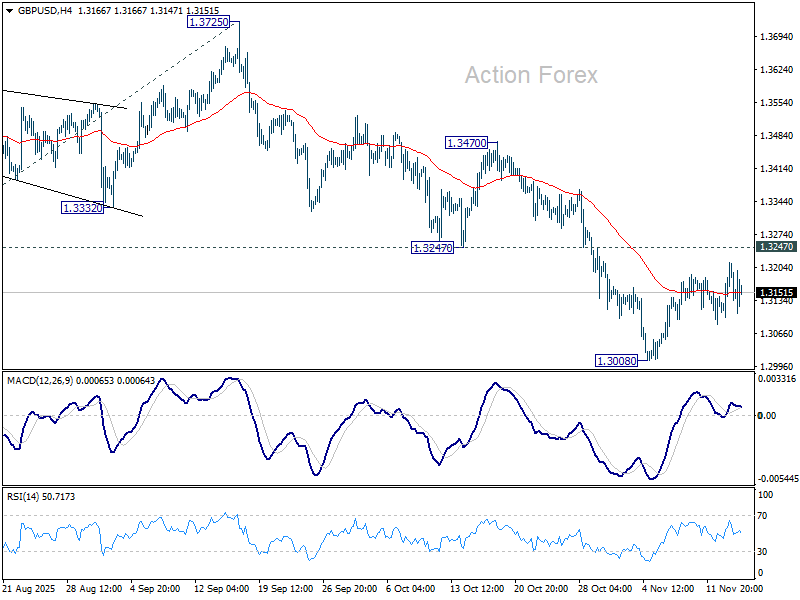
GBP/USD Mid-Day Outlook
Daily Pivots: (S1) 1.3123; (P) 1.3170; (R1) 1.3238; More...
Intraday bias in GBP/USD stays neutral for the moment and more consolidations could be seen. Further decline is expected with 1.3247 support turned resistance intact. On the downside, break of 1.3008 will target 138.2% projection of 1.3787 to 1.3140 from 1.3725 at 1.2831. Nevertheless, firm break of 1.3247 will suggest that fall from 1.3787 has completed as a corrective move already.
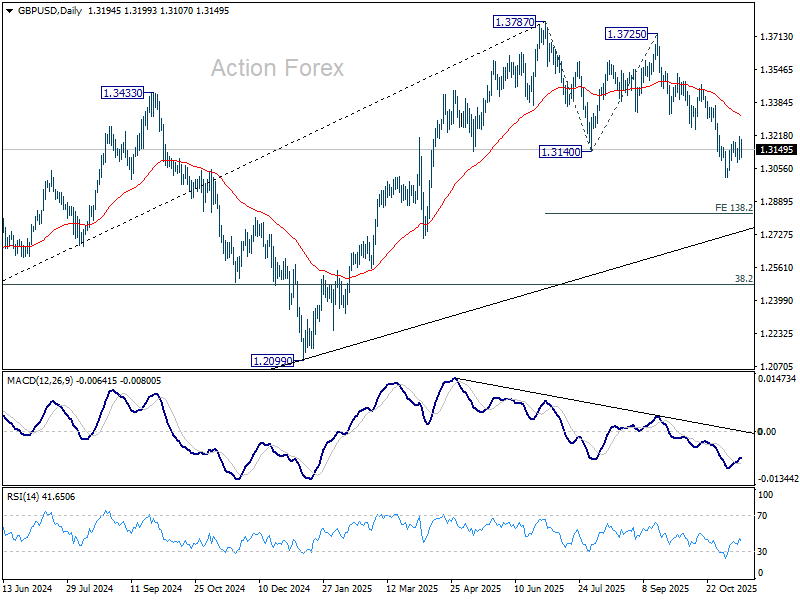
In the bigger picture, the break of 55 W EMA (now at 1.3185) is taken as the first sign that corrective rise from 1.0351 (2022 low) has completed. Decisive break of trend line support (now at 1.2780) will solidify this case and target 38.2% retracement of 1.0351 to 1.3787 at 1.2474 next. Meanwhile, in case of another rise, strong resistance should emerge below 1.4248 (2021 high) to cap upside to preserve the long term down trend.
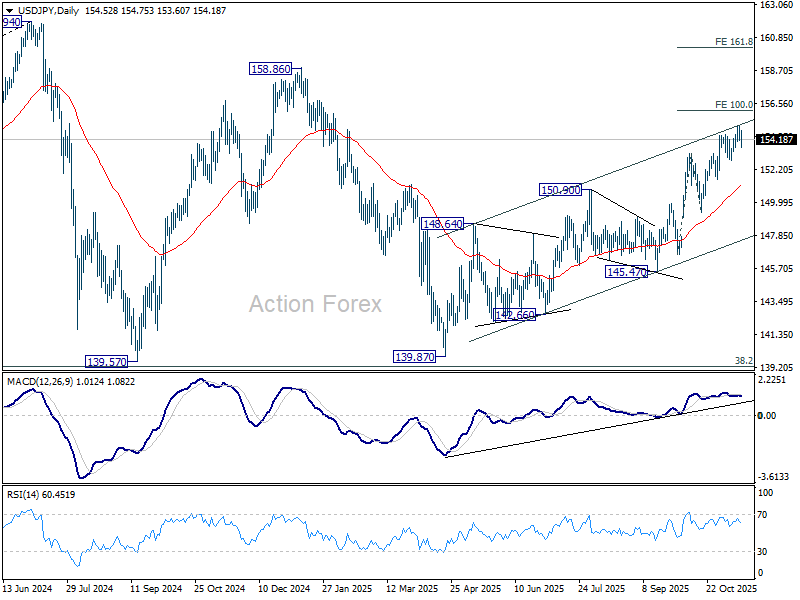
USD/JPY Mid-Day Outlook
Daily Pivots: (S1) 154.10; (P) 154.56; (R1) 154.98; More...
Intraday bias in bias in USD/JPY remains neutral and more consolidations would be seen below 155.03 temporary top. Further rally is expected as long as 152.81 support holds. Above 155.03 will resume the rise from 139.87 to 100% projection of 146.58 to 153.26 from 149.37 at 156.05. Firm break there will pave the way to 158.86 key structural resistance. However, firm break of 152.81 will confirm short term topping and turn bias back to the downside for deeper pullback.
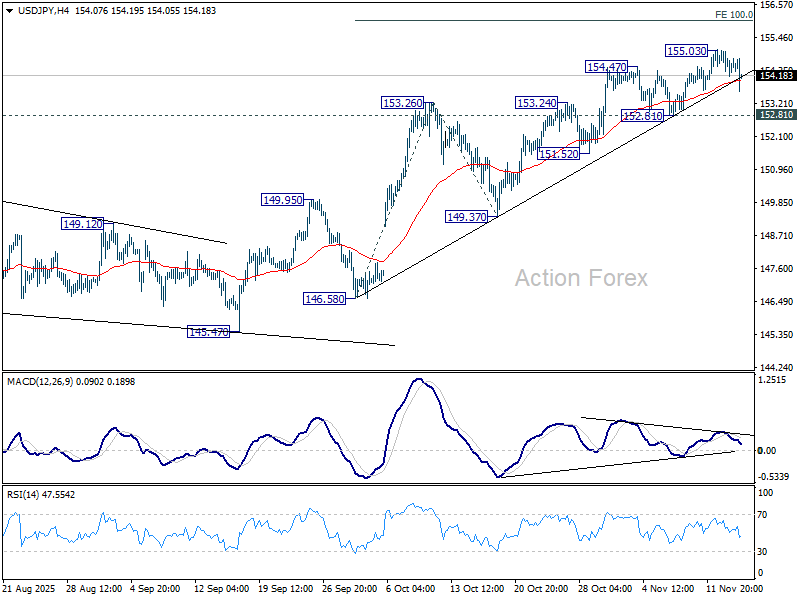
In the bigger picture, current development suggests that corrective pattern from 161.94 (2024 high) has completed with three waves at 139.87. Larger up trend from 102.58 (2021 low) could be ready to resume through 161.94 high. On the downside, break of 149.37 support will dampen this bullish view and extend the corrective pattern with another falling leg.
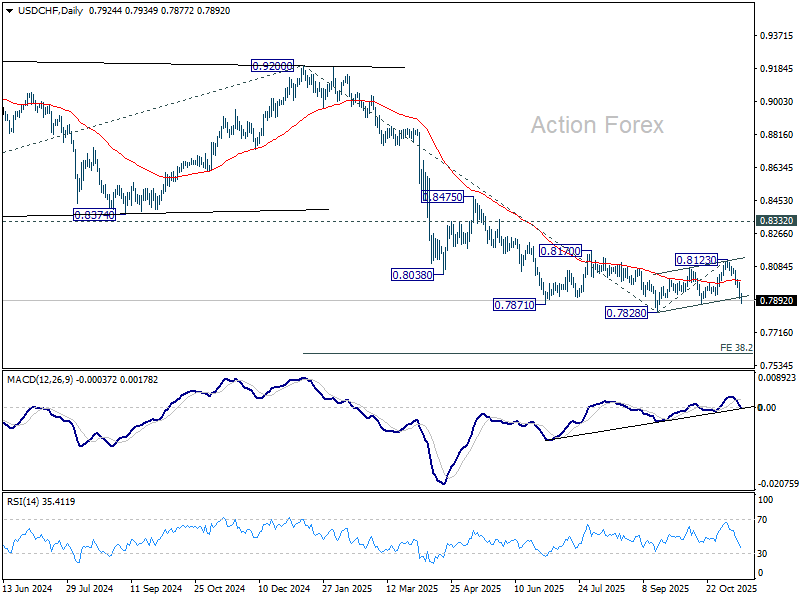
USD/CHF Mid-Day Outlook
Daily Pivots: (S1) 0.7894; (P) 0.7944; (R1) 0.7979; More…
USD/CHF's fall from 0.8123 accelerates lower today and intraday bias remains on the downside. Decisive break of 0.7872 support will argue that larger down trend is ready to resume. Break of 0.7828 will target 38.2% projection of 0.9200 to 0.7828 from 0.8123 at 0.7599. On the upside, above 0.7941 minor resistance will delay the bearish case and bring more consolidations first.
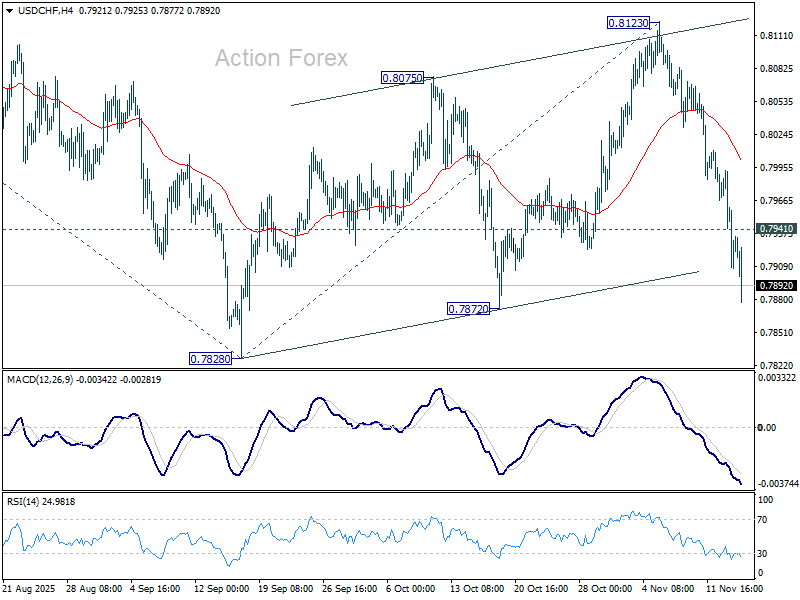
In the bigger picture, long term down trend from 1.0342 (2017 high) is still in progress. Next target is 100% projection of 1.0146 (2022 high) to 0.8332 from 0.9200 at 0.7382. In any case, outlook will stay bearish as long as 0.8332 support turned resistance holds (2023 low).
Franc Leads Safe-Haven Bid, Tech Rout Pressures Sentiment
Risk aversion intensified with markets once again gripped by tech-led weakness. Nvidia slumped in premarket trading, dragging the broader semiconductor and AI complex lower and reinforcing concerns that the sector’s valuation reset still has further to run. The risk-off tone spilled over into cryptocurrencies, where Bitcoin dropped more than 2% and looked increasingly vulnerable to a break below the 95k level.
In currencies, Swiss Franc’s rally accelerated as safe-haven inflows picked up pace. For the first time this week, the depth of risk aversion was also enough to lift Yen, which finally staged a rebound after spending days pinned at the bottom of the performance table on expectations of delayed BoJ tightening. By contrast, Sterling and Aussie were among the weakest performers, while Dollar also traded with a soft bias. Euro and Loonie held to the middle of the pack.
A key question for the final hours is whether tech stocks can deliver another bout of late-session short covering, similar to last Friday’s dramatic reversal. But with sentiment deteriorating quickly and positioning still heavy in AI-linked names, the risk of a deeper, more disorderly selloff cannot be ruled out.
In the UK, reports that the Office for Budget Responsibility has upgraded its fiscal forecasts trigged some volatility. Sources suggested that Chancellor Rachel Reeves is now unlikely to raise income taxes in this month’s Budget, given the improved outlook. The Treasury declined to comment, but markets reacted swiftly.
Gilt yields jumped sharply on the news as government bond prices fell, reflecting expectations of looser fiscal constraints. Sterling attempted a brief recovery but failed to build momentum, weighed by softer risk appetite and ongoing speculation that the BoE could cut rates as early as next month.
In Europe, at the time of writing, FTSE is down -1.74%. DAX is down -1.61%. CAC is down -1.47%. UK 10-year yield is up 0.079 at 4.520. Germany 10-year yield is down -0.001 at 2.691. Earlier in Asia, Nikkei fell -1.77%. Hong Kong HSI fell -1.85%. China Shanghai SSE fell -0.97%. Singapore Strait Times fell -0.65%. Japan 10-year JGB yield rose 0.011 to 1.702.
EU swings back to surplus, powered by chemicals and US trade
The Eurozone posted a solid EUR 19.4B trade surplus in September, supported by broad rise in goods exports. Outbound shipments increased 7.7% yoy to EUR 256.6B, outpacing the 5.3% yoy rise in imports.
The broader EU trade balance also swung sharply back into surplus, moving from a EUR -4.5B deficit in August to a EUR 16.3B surplus in September. The turnaround was driven primarily by a strong rebound in the chemicals sector, where the surplus jumped from EUR 15.4B to EUR 26.9B.
On a partner basis, EU shipments to the US were a major driver, rising 15.4% yoy to EUR 53.1B. Imports from the U.S. grew a solid 12.5%, leaving a wider EUR 22.2B surplus. Trade with Switzerland was also strong: exports increased 13.4% and imports 10.6%, taking the bilateral surplus to EUR 6.7B. In contrast, exports to China fell -2.5% yoy, while imports rose 3.6%, pushing the deficit with China deeper to EUR -33.1B. Trade flows with the UK were mixed, as exports rose 2.8% yoy, while imports dipped -0.3%, widening the surplus to EUR 16.1B.
China industrial production slows to 4.9% yoy in October, investment contraction deepens
China’s October activity data pointed to a loss of momentum, with industrial production rising 4.9% yoy, down from September’s 6.5% yoy and below expectations of 5.6%. It marks the weakest annual pace since August 2024.
Retail sales also slowed, rising 2.9% yoy compared with 3.0% in September, though slightly outperforming expectations of 2.7% yoy. Still, it was the slowest pace since August last year, underscoring persistently cautious household demand. Excluding autos, consumer goods retail sales rose a firmer 4.0%, suggesting pockets of resilience but not enough to anchor a broad consumption recovery.
More concerning was the continued drag from investment: fixed asset investment fell -1.7% ytd yoy, deteriorating from -0.5% and missing expectations of -0.7%. Private-sector investment remained under heavy pressure, dropping -4.5%, underscoring structural weakness in confidence, property-linked spillovers, and limited risk appetite.
New Zealand BNZ PMI at 51.4 as orders hit three-year high
New Zealand’s manufacturing sector showed further improvement in October, with BusinessNZ PMI rising from 50.1 to 51.4, marking a fourth straight month above 50. While still below the long-term average of 52.4, the sector is now experiencing its most sustained period of expansion in three years, hinting that the worst of the downturn may be behind it.
The details were encouraging: production improved from 50.5 to 52.0. New orders jumped from 50.5 to 54.9, the strongest pace since August 2022 and a key sign that demand conditions are firming. Employment remained in contraction at 48.1, up from 47.7, but even that component showed stabilization after six months of declines.
BusinessNZ’s Catherine Beard said October brought “more signs of life” after months of stagnation. The share of negative respondent comments fell from 60.2% to 54.1%, with many firms reporting stronger orders, seasonal demand, new customers, and productivity gains driven by process improvements and automation.
USD/CHF Mid-Day Outlook
Daily Pivots: (S1) 0.7894; (P) 0.7944; (R1) 0.7979; More…
USD/CHF's fall from 0.8123 accelerates lower today and intraday bias remains on the downside. Decisive break of 0.7872 support will argue that larger down trend is ready to resume. Break of 0.7828 will target 38.2% projection of 0.9200 to 0.7828 from 0.8123 at 0.7599. On the upside, above 0.7941 minor resistance will delay the bearish case and bring more consolidations first.
In the bigger picture, long term down trend from 1.0342 (2017 high) is still in progress. Next target is 100% projection of 1.0146 (2022 high) to 0.8332 from 0.9200 at 0.7382. In any case, outlook will stay bearish as long as 0.8332 support turned resistance holds (2023 low).
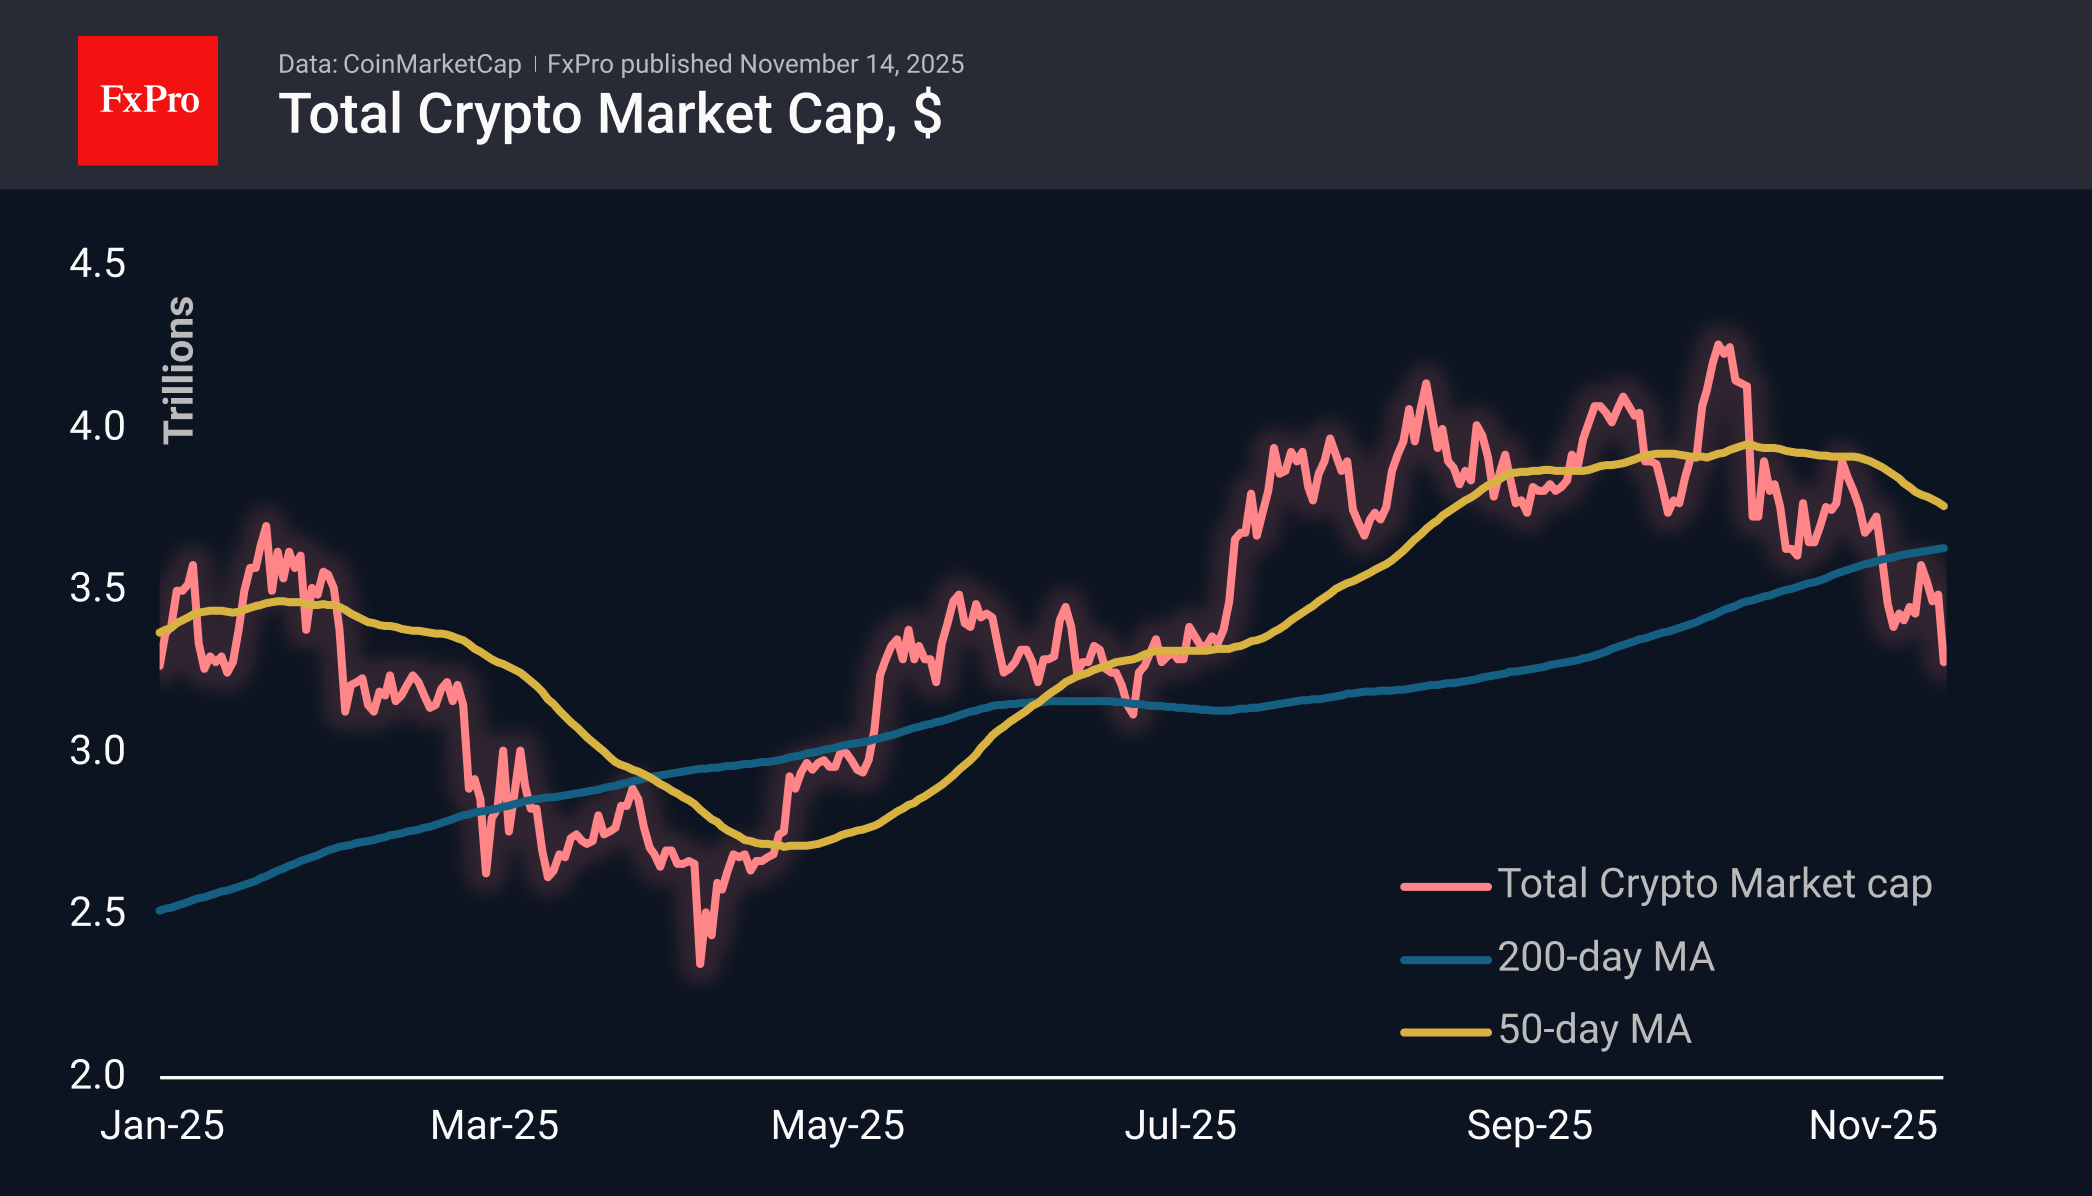
Crypto Market Lost $1 Trillion and May Lose Another
Market Overview
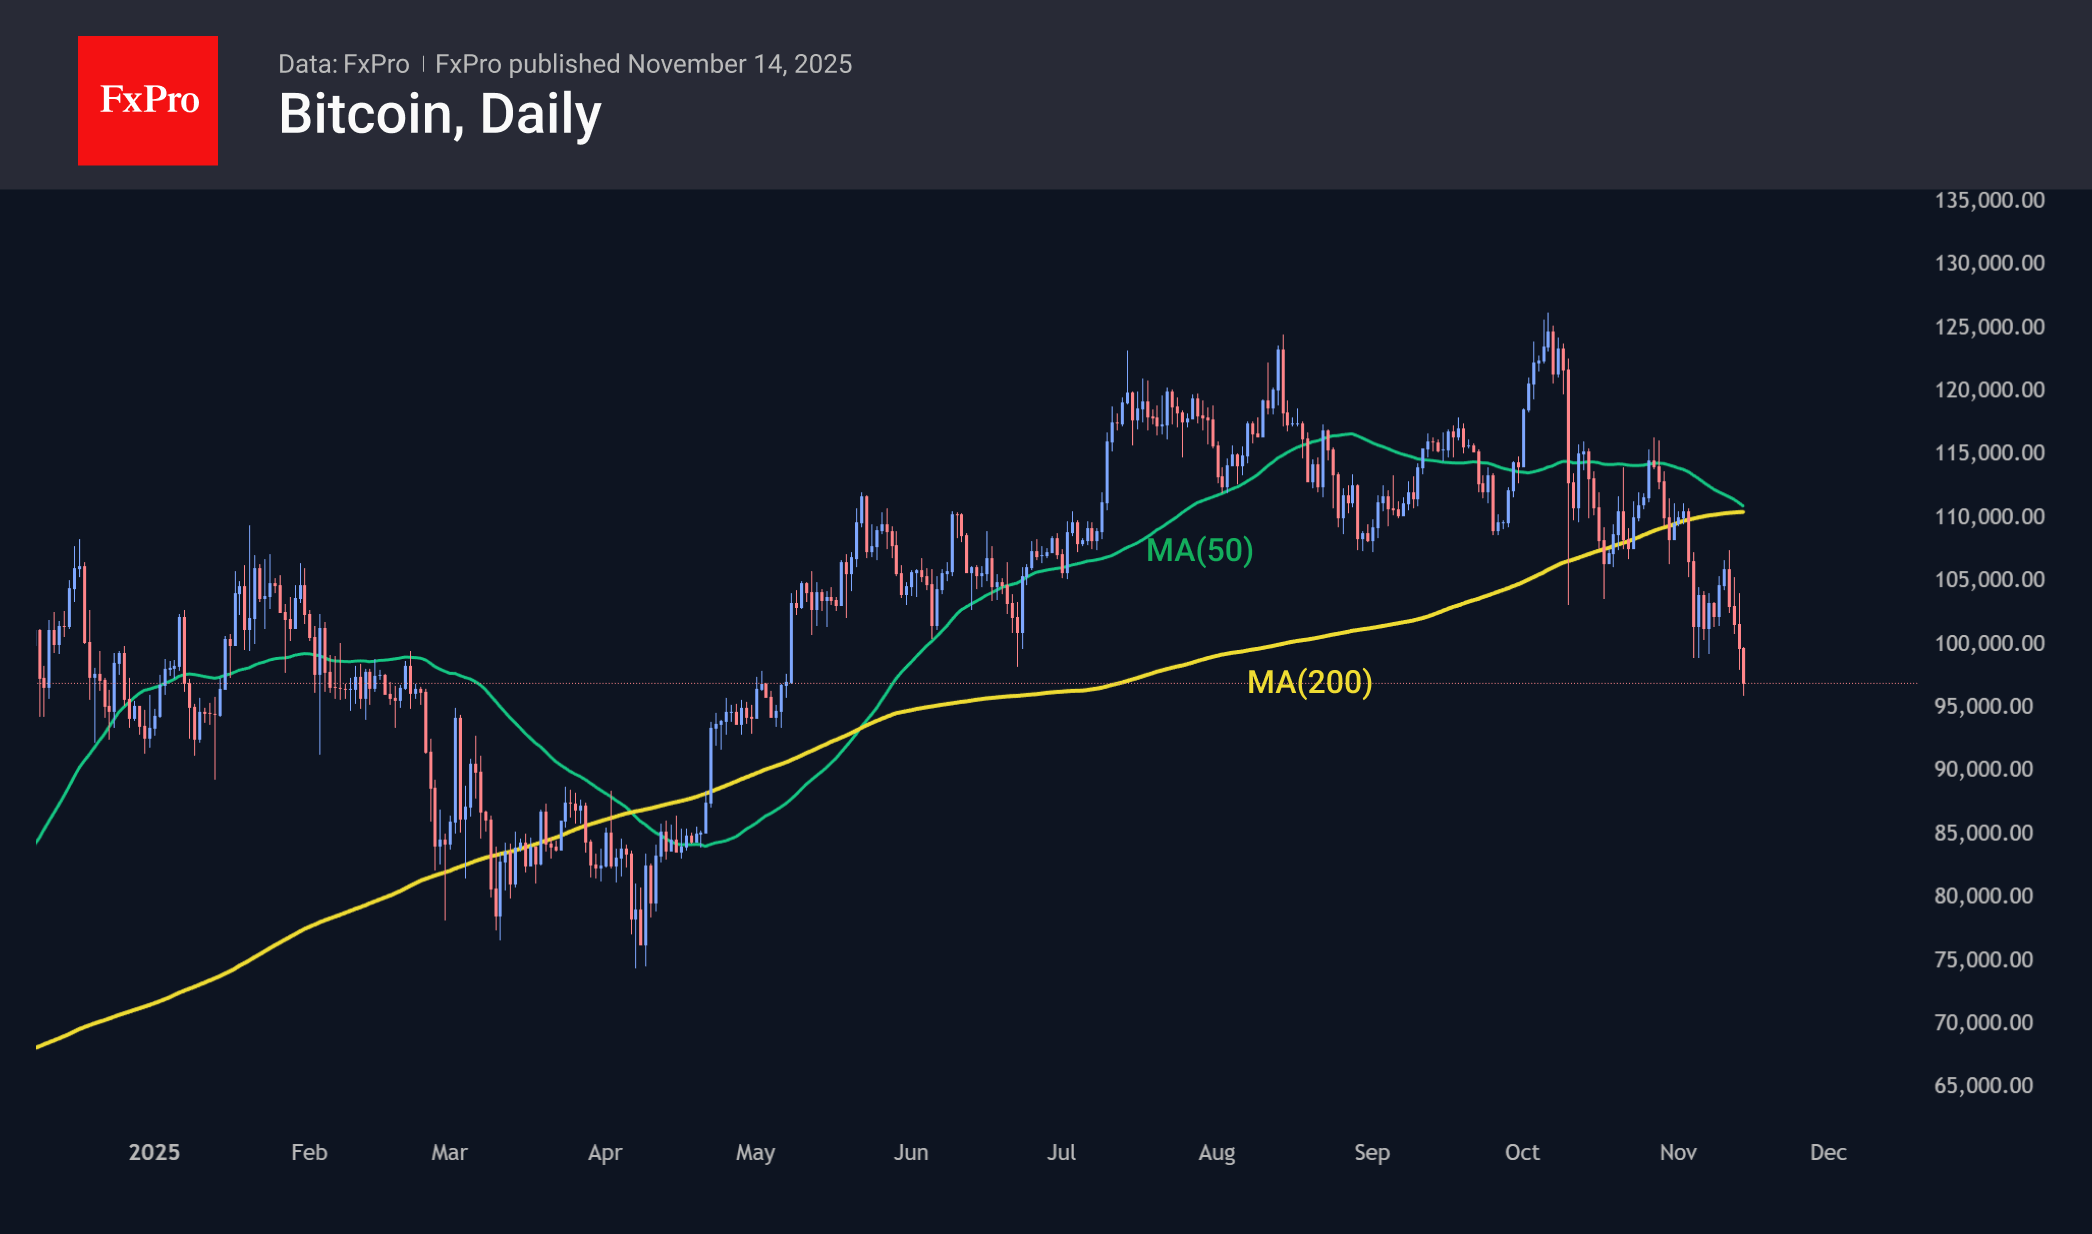
The crypto market capitalisation has fallen by more than 6% over the last day to $3.26 trillion, its lowest level since early July. The crypto market has set lower local lows, confirming the downward trend. Since its peak on 7 October, the crypto market capitalisation has fallen by more than $1 trillion, or 24%, which technically means the beginning of a bear market. If the rules of stocks apply here, then we should prepare for a further decline of approximately 20%, or around $1 trillion.
Bitcoin fell below $97K, losing nearly 6% in the last 24 hours. Under continuous pressure since 11 November, it has already lost over 11%, falling back to levels last seen in May. A bearish signal — the death cross — is already looming over the first cryptocurrency. This signal is effective in classic markets, but in recent times, instead of a decline, it has been followed by growth, as the previous strong sell-off has been exhausted. The opposite is also true: the golden cross occurred during a period close to the local peak.
News Background
Long-term Bitcoin holders (LTH) have accelerated profit-taking, according to Glassnode. According to CryptoQuant, LTHs have sold about 815,000 BTC over the past 30 days, a record high since January 2024.
Taiwanese authorities are exploring the possibility of establishing a strategic cryptocurrency reserve, similar to those in the US, which could include cryptocurrency confiscated by law enforcement agencies during criminal investigations.
Canary Capital has launched the first XRP-based spot ETF in the US. Trading in the XRP ETF under the ticker XRPC began on Nasdaq on 13 November. XRP is one of the most common and widely used digital assets in the world, according to Canary Capital.
Winklevoss Capital, the fund founded by Tyler and Cameron Winklevoss, has created Cypherpunk, investing over $50 million in it. Cypherpunk will accumulate reserves in the private cryptocurrency Zcash (ZEC).
The US Securities and Exchange Commission (SEC) has prepared a draft guide on the classification of crypto assets based on the Howey test. The agency wants to clarify once and for all which digital assets are considered securities, and which are commodities, SEC Chairman Paul Atkins said.
For the first time in history, no media outlet, expert, or blogger has declared Bitcoin dead in the past year, according to experts from tracking services 99Bitcoins and BitBo.
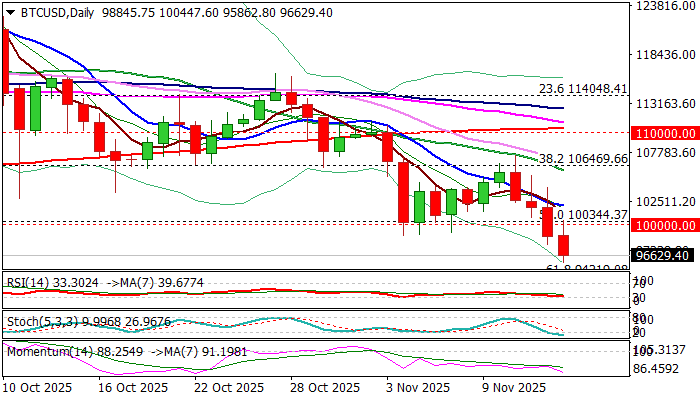
BTCUSD Extends Steep Fall Well Below Psychological 100K Support
BTCUSD holds in a steep descend for the fourth consecutive, with strong acceleration lower on Thursday / early Friday, being sparked by fresh sales of risky assets.
Traders remain concerned about lack of economic data following the longest US government shutdown in history and moved into risk-off mode, until getting clearer picture.
Bitcoin broke through key supports at 100340 and 100K (50% of 74389/126299 rally / psychological) and extended below June 22 low (98182), to test levels under 96K and hit the lowest since early May.
Bears eye next targets at 94219 (Fibo 61.8%) and 93203 (top of ascending weekly Ichimoku cloud, though price adjustment to be anticipated as daily studies are getting oversold.
The latest drop completed a bearish failure swing pattern on daily chart, adding to negative signals from firmly bearish daily technical studies (14-d descends deep into negative territory/ MA’s in full bearish setup, with converging 55/200DMA’s on track to form death-cross.
Broken supports at 101370 and 100K (55WMA / psychological) reverted to resistances which should ideally cap upticks, with close below these levels to keep bears intact.
Res: 98870; 100000; 101370; 102080
Sup: 95800; 94219; 93203; 92800