
Sample Category Title
Fed’s Daly: Direction is downward, but too soon to commit to December cut
San Francisco Fed President Mary Daly signaled that the December 9–10 FOMC meeting remains a genuine live decision, saying it is “premature to say definitely no cut, or definitely a cut.” Daly stressed she has “an open mind” and has not reached a final view.
While Daly reiterated that the overall direction of policy is downward, she cautioned that the exact timing of the next move hinges on the incoming data. Recent acceleration in services inflation complicates the picture, as the Fed’s 50bps of cuts earlier this year have helped stabilize the labor market by cooling wage pressures and supporting job demand.
Daly said policymakers must “collect more information” before making any call on December, noting that the Fed faces risks on both sides of its dual mandate.
Fed’s Hammack: Monetary policy can’t do more right now
Cleveland Fed President Beth Hammack signaled a firmer stance against further rate cuts. In a MarketWatch interview, she expressed her opposition to additional easing unless the economic outlook deteriorates, warning that markets may be misinterpreting the Fed’s tolerance for inflation.
Hammack said that some investors now believe the Fed may quietly accept inflation “just below 3%,” calling that notion a threat to the central bank’s credibility. While she continues to monitor the labor market, Hammack said she sees little risk of a downturn.
Looking ahead, she expects the economy to strengthen into 2026, with businesses likely to increase investment amid easier credit conditions and supportive equity markets. “At this point, I don’t think there is more that monetary policy can do,” she said.
USD/JPY Mid-Day Outlook
Daily Pivots: (S1) 154.22; (P) 154.64; (R1) 155.22; More...
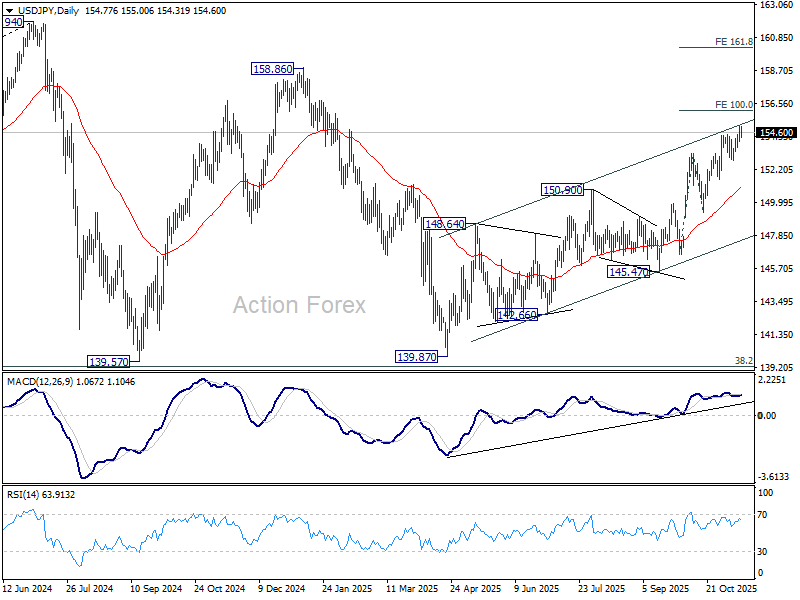
No change in USD/JPY's outlook and intraday bias stays on the upside. Current rally from 139.87 should target 100% projection of 146.58 to 153.26 from 149.37 at 156.05. Firm break there will pave the way to 158.86 key structural resistance. For now, near term outlook will stay bullish as long as 152.81 support holds, in case of retreat.
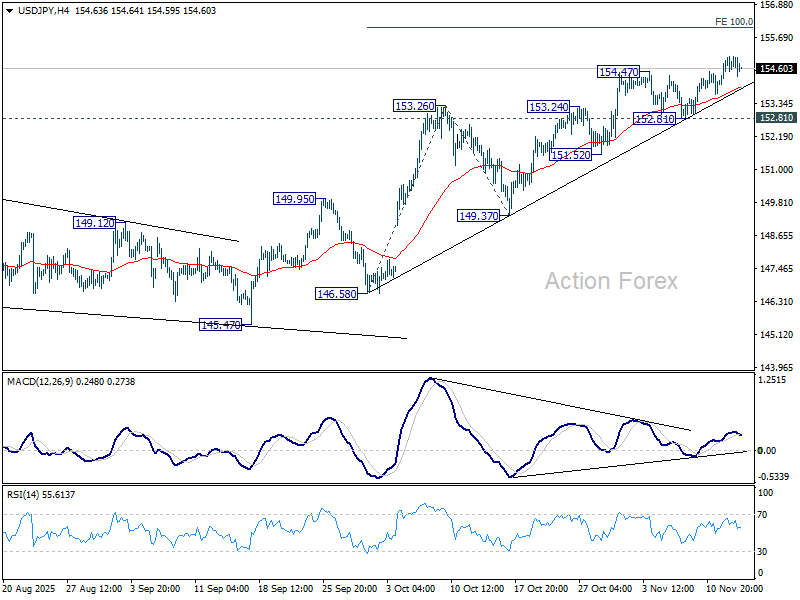
In the bigger picture, current development suggests that corrective pattern from 161.94 (2024 high) has completed with three waves at 139.87. Larger up trend from 102.58 (2021 low) could be ready to resume through 161.94 high. On the downside, break of 149.37 support will dampen this bullish view and extend the corrective pattern with another falling leg.
USD/CHF Mid-Day Outlook
Daily Pivots: (S1) 0.7961; (P) 0.7986; (R1) 0.8005; More…
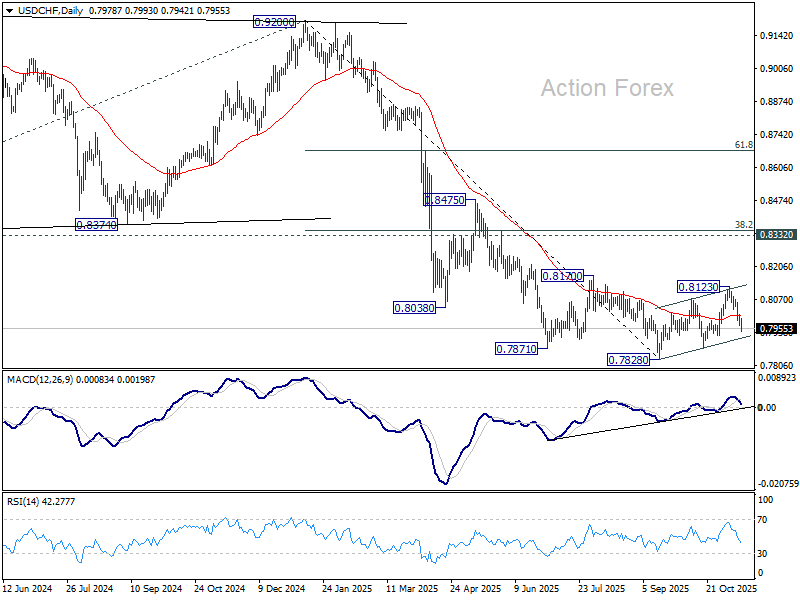
USD/CHF's fall from 0.8123 continues today and intraday bias remains on the downside for 0.7872 support. Firm break there will argue that larger down trend is ready to resume through 0.7828 low. On the upside, above 0.8010 minor resistance will turn intraday bias neutral again.
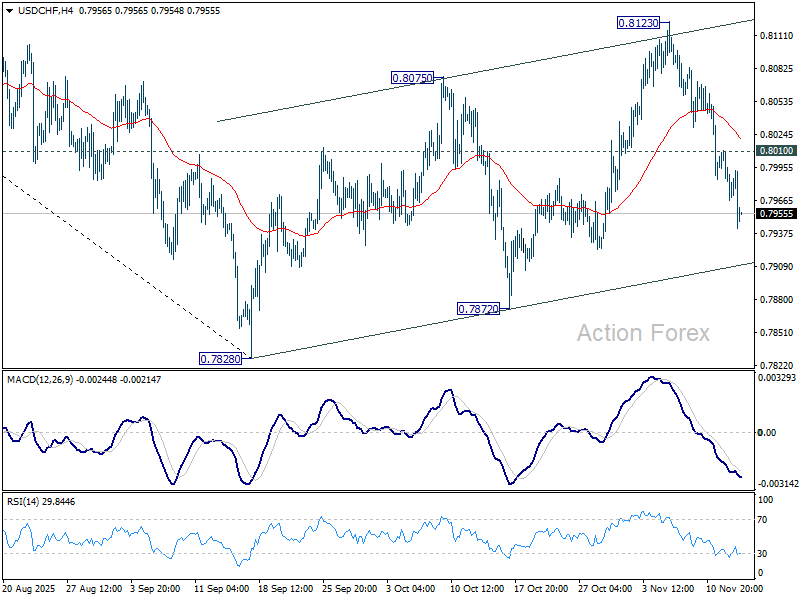
In the bigger picture, long term down trend from 1.0342 (2017 high) is still in progress. Next target is 100% projection of 1.0146 (2022 high) to 0.8332 from 0.9200 at 0.7382. In any case, outlook will stay bearish as long as 0.8332 support turned resistance holds (2023 low).
EUR/USD Mid-Day Outlook
Daily Pivots: (S1) 1.1571; (P) 1.1585; (R1) 1.1606; More…
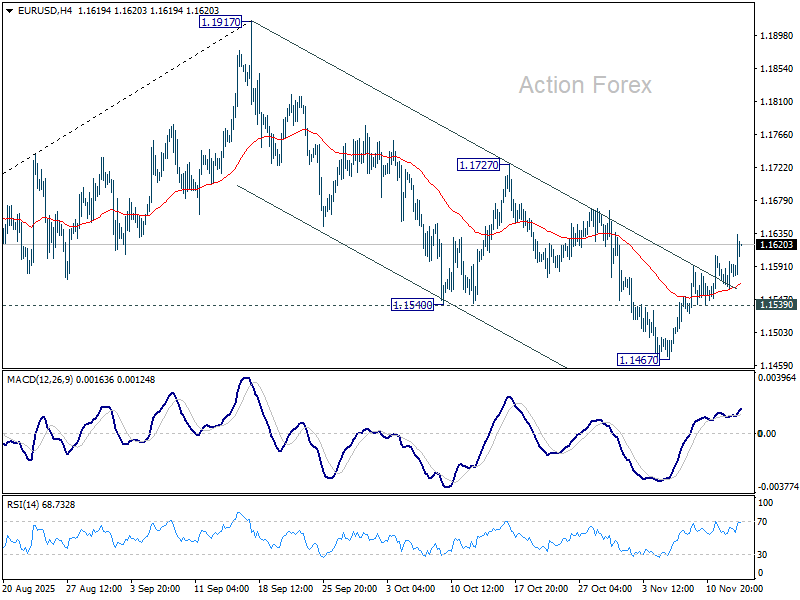
Immediate focus is now on 55 D EMA (now at 1.1619) as rebound from 1.1467 extends today. Sustained break there will argue that fall from 1.1971 has completed as a correction only, and bring further rise to 1.1727 resistance next. On the downside, break of 1.1539 should resume the fall from 1.1971 through 1.1467 support.
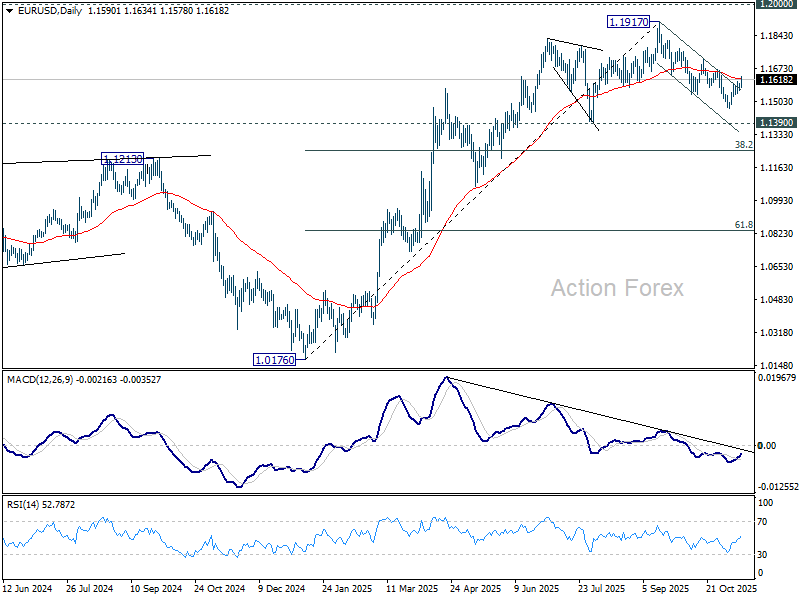
In the bigger picture, considering bearish divergence condition in D MACD, a medium term top is likely in place at 1.1917, just ahead of 1.2 key psychological level. As long as 55 W EMA (now at 1.1306) holds, the up trend from 0.9534 (2022 low) is still expected to continue. Decisive break of 1.2000 will carry larger bullish implications. However, sustained trading below 55 W EMA will argue that rise from 0.9534 has completed as a three wave corrective bounce, and keep long term outlook outlook bearish.
GBP/USD Mid-Day Outlook
Daily Pivots: (S1) 1.3089; (P) 1.3128; (R1) 1.3171; More...
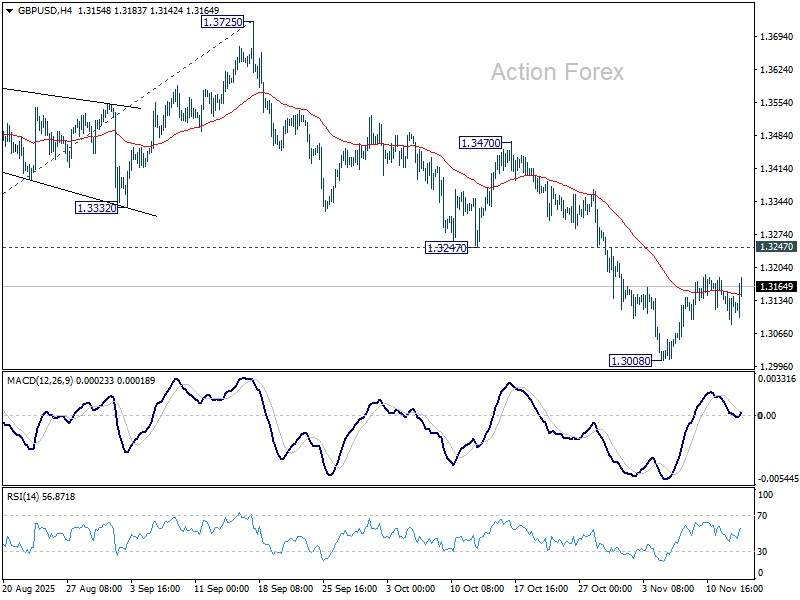
GBP/USD dipped briefly today but quickly recovered. Intraday bias remains neutral as range trading continues. Further decline is expected as long as 1.3247 support turned resistance holds. Break of 1.3008 will target 138.2% projection of 1.3787 to 1.3140 from 1.3725 at 1.2831. Nevertheless, firm break of 1.3247 will suggest that fall from 1.3787 has completed as a corrective move already.
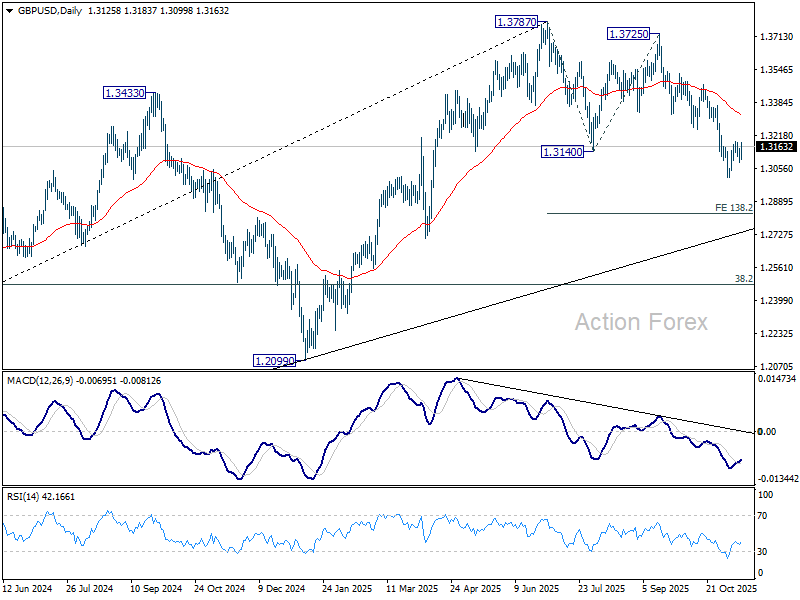
In the bigger picture, the break of 55 W EMA (now at 1.3185) is taken as the first sign that corrective rise from 1.0351 (2022 low) has completed. Decisive break of trend line support (now at 1.2780) will solidify this case and target 38.2% retracement of 1.0351 to 1.3787 at 1.2474 next. Meanwhile, in case of another rise, strong resistance should emerge below 1.4248 (2021 high) to cap upside to preserve the long term down trend.
Indecisive Session as Sterling and Aussie Moves Fizzle
The forex markets were broadly indecisive today, with major currencies struggling to find convictions in their movements. Sterling initially fell after weaker-than-expected Q3 GDP print but the decline proved short-lived. The markets appeared to have already priced in a December BoE cut following earlier labor data. Instead, the focus has shifted toward the pace of rate cuts in 2026, which is heavily dependent on the tone of the Autumn Budget later this month.
Aussie jumped on the back of today’s strong employment report, but momentum faded as markets quickly recognized that the data merely affirm the widely expected RBA hold through year-end. Anything beyond December is still premature to judge. The path for 2026 hinges critically on the Q4 CPI release in late January. In the meantime, more labor market data will arrive, and these could shift expectations at the margin, especially if wage momentum surprises in either direction.
Dollar softened modestly as traders were probably positioning ahead of renewed data flow following the end of the prolonged government shutdown. Nevertheless, with Fed fund futures pricing just over 50% chance of a December 25bps cut, markets are clearly split on whether the Fed will move before year-end or with a delay.
On the trade front, attention turned to comments from EU Trade Commissioner Maros Sefcovic, who proposed accelerating the removal of the de minimis threshold on low-value imports into the bloc. The move—aimed at Chinese e-commerce giants like Shein and Tema—would bring forward new customs duties to Q1 2026, two years earlier than planned, signaling a tougher stance on protecting European competitiveness.
Overall, Swiss Franc continues to outperform on the week. Aussie and Kiwi follow as next-best performers, while the Yen remains pinned at the bottom. Dollar and Sterling are also soft, with Euro and Loonie holding mid-pack.
In Europe, at the time of writing, FTSE is down -0.80%. DAX is down -0.59%. CAC is up 0.34%. UK 10-year yield is up 0.025 at 4.428. Germany 10-year yield is up 0.029 at 2.675. Earlier in Asia, Nikkei rose 0.43%. Hong Kong HSI rose 0.56%. China Shanghai SSE rose 0.73%. Singapore Strait Times rose 0.15%. Japan 10-year JGB yield closed flat at 1.692.
Eurozone industrial production disappoints with 0.2% mom growth, consumer goods weigh
Eurozone industrial production rose only 0.2% mom in September, sharply below expectations of 0.8%. The modest gain reflected mixed sectoral dynamics — output increased for intermediate goods (+0.3%), capital goods (+0.3%), and energy (+1.2%), but fell for durable consumer goods (-0.5%) and non-durable consumer goods (-2.6%).
Across the broader European Union, output performed better, rising 0.8% mom, helped by strong growth in Denmark (+7.2%), Sweden (+5.3%), and Greece (+4.8%). However, steep contractions in Ireland (-9.4%), Luxembourg (-5.7%), and Malta (-1.7%) underscored the fragmented nature .
UK GDP grows 0.1% qoq in Q3, vehicle production plunges
The UK economy barely grew in Q3, with GDP expanding just 0.1% qoq, below expectations for 0.2%, reinforcing concerns about stagnation as demand cools. The latest figures show services output rising 0.2% qoq and construction up 0.1%, while the production sector contracted -0.5%, offsetting modest gains elsewhere. Real GDP per head was flat, underscoring the absence of meaningful growth in living standards.
Monthly data painted an even weaker picture. September GDP fell -0.1% mom, missing forecasts for a flat reading, following zero growth in August (revised from +0.1%) and a -0.1% contraction in July. The decline was driven by a -2.0% drop mom in production, as a steep -28.6% collapse in vehicle manufacturing subtracted 0.17 percentage points from overall GDP. In contrast, services and construction both managed modest 0.2% expansions.
Australia jobs surge 42.2k in October as unemployment rate falls to 4.3%
Australia’s labor market showed renewed strength in October, with employment rising by 42.2k, more than double market expectations of 20.3k. The gain was driven by a 55.3k surge in full-time positions, partly offset by a -13.1k drop in part-time work, highlighting a solid expansion in higher-quality jobs.
The unemployment rate unexpectedly fell from 4.5% to 4.3%, beating forecasts of 4.4%, while the participation rate held steady at 67.0%. Meanwhile, monthly hours worked climbed 0.5% mom, further underscoring the underlying resilience of labor demand.
The upbeat figures reaffirm Australia’s labor market resilience and encourage the RBA to maintain its current cautious tone rather than pivot quickly toward easing. With inflation pressures lingering and employment holding firm, the RBA is likely to wait for clearer signs of slack before signaling rate cuts—keeping February as the earliest plausible window for policy adjustment.
BoJ's Ueda highlights tight job market, resilient consumption
BoJ Governor Kazuo Ueda told parliament today that Japan’s inflation is gradually aligning with the central bank’s 2% goal, supported by improving wages and steady domestic demand. He reiterated the BoJ aims for moderate inflation accompanied by rising incomes and economic improvement, rather than price gains driven solely by import costs or temporary shocks.
Ueda noted that while demand for food and other non-durable goods has softened, household consumption remains resilient thanks to higher incomes and a tight labor market. He highlighted that stronger wage growth is helping sustain a moderate cycle of rising prices and pay—an essential precondition for durable inflation in the BoJ’s framework.
He added that underlying inflation—stripping out volatile components—is gradually accelerating toward the 2% target, driven not only by food but also by price increases across a broader range of goods and services.
"When we look at underlying inflation that strips away temporary factors, it is gradually accelerating toward our 2% target," he said.
Japan CGPI rises 2.7% yoy in October, weak yen fails to lift import prices
Japan’s Corporate Goods Price Index rose 2.7% yoy in October, easing slightly from 2.8% in September but exceeding expectations of 2.5%, according to Bank of Japan data.
Notably, the Yen-based import price index fell -1.5% from a year earlier, marking its ninth straight month of decline. The persistent drop indicates that the weak Yen is not translating into renewed cost-push inflation—contradicting the typical currency-inflation link.
GBP/USD Mid-Day Outlook
Daily Pivots: (S1) 1.3089; (P) 1.3128; (R1) 1.3171; More...
GBP/USD dipped briefly today but quickly recovered. Intraday bias remains neutral as range trading continues. Further decline is expected as long as 1.3247 support turned resistance holds. Break of 1.3008 will target 138.2% projection of 1.3787 to 1.3140 from 1.3725 at 1.2831. Nevertheless, firm break of 1.3247 will suggest that fall from 1.3787 has completed as a corrective move already.
In the bigger picture, the break of 55 W EMA (now at 1.3185) is taken as the first sign that corrective rise from 1.0351 (2022 low) has completed. Decisive break of trend line support (now at 1.2780) will solidify this case and target 38.2% retracement of 1.0351 to 1.3787 at 1.2474 next. Meanwhile, in case of another rise, strong resistance should emerge below 1.4248 (2021 high) to cap upside to preserve the long term down trend.
1.3000 Line in the Sand: Will GBP/USD Break Higher or Face a Year-End Correction?
GBP has remained on the offensive against the US dollar. This comes despite the series of negative UK data of late which continued this morning.
UK GDP Data Disappoints
The UK economy grew slightly, by 0.1%, between July and September 2025, which was less than the 0.2% growth market participants had predicted.
The main problem was in the industrial sector, like factories and mining, which shrank by 0.5%. Manufacturing was down, with car making hit especially hard—dropping over 10%—after a cyberattack in September caused major problems for Jaguar Land Rover. The services sector, which includes things like entertainment and real estate, did grow, but at 0.2%, it was slower than the previous quarter. Construction also saw very small growth of 0.1%, mostly from repair jobs, as new building projects actually fell. When looking at the entire year, the economy grew 1.3% compared to the same time last year, which was also slightly below forecasts.
The weak GDP number should add to rate cut expectations from the BoE in December. As you can see the most recent pricing places a 75% probability on a 25bps rate cut.
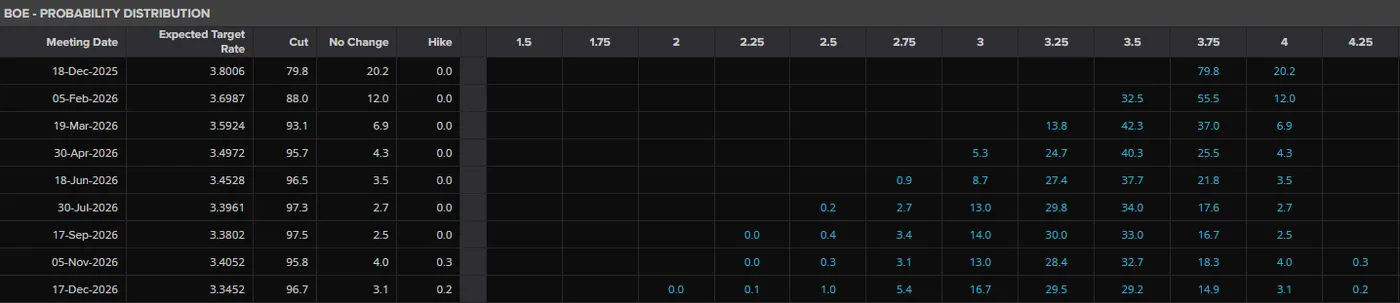
Source: LSEG
UK inflation does however remain elevated at 3.8%, which is well above the 2% target. This keeps market participants on edge and will keep eys on the Bank of England heading into December.
Market Reaction and the US Dollars Role
Cable has remained resilient since the selloff which ended on November 5, just shy of the critical 1.3000 pivot level. A sharp rally followed before a period of consolidation since Friday November 7.
Part of the reason for Cable's rise may be attributed to the US Dollar as well as buyers defending the crucial 1.3000 pivot handle.
From the US Dollar perspective, the end of the US Government shutdown has led to some US Dollar weakness. The dollar is facing rising rate cut bets and declining haven flows as the Government shutdown appears close to being resolved.
US Dollar Index Daily Chart, November 13, 2025
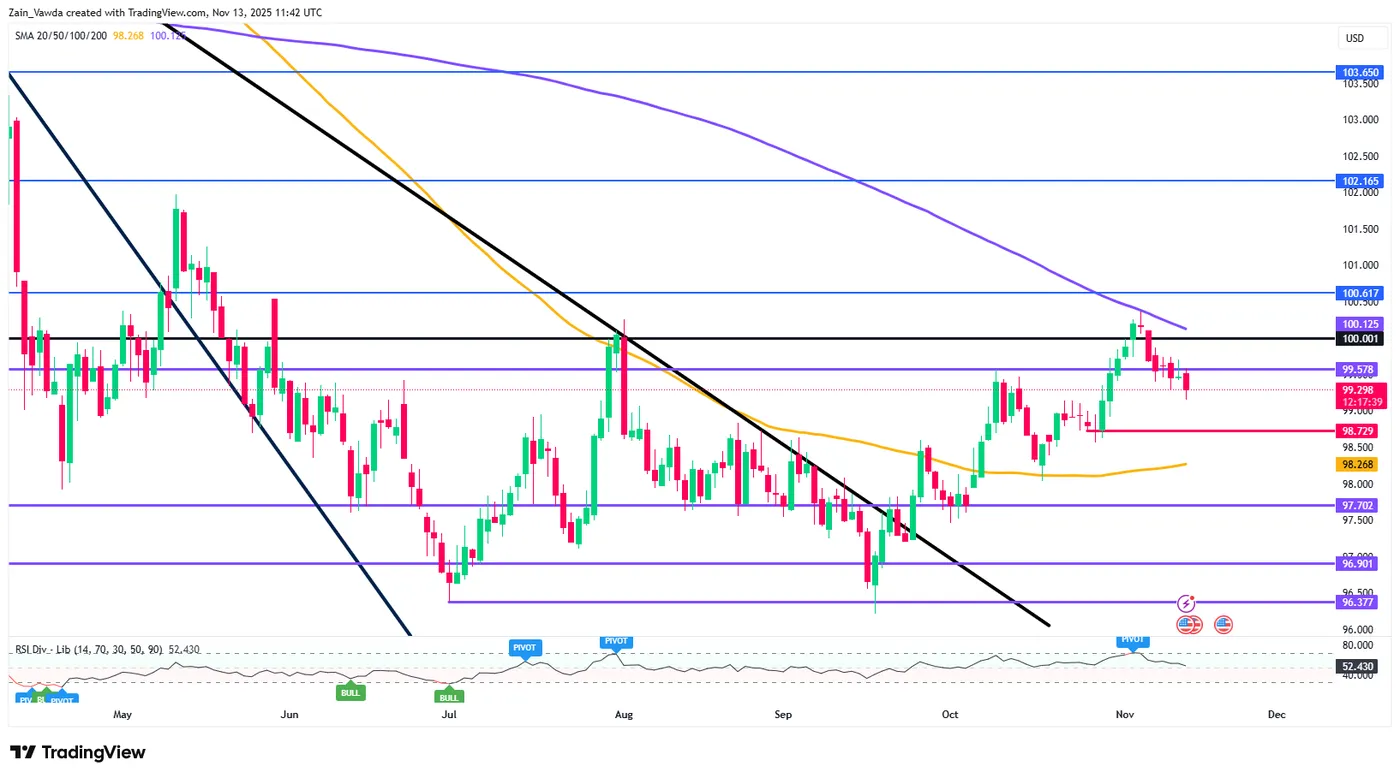
Source: TradingView
This sets the stage for further GBP resilience. However, the UK budget is coming up soon and that could be keeping bulls on a leash as Chancellor Rachel Reeves faces an unenviable task.
UK Budget Ahead
Chancellor Rachel Reeves faces a significant challenge in addressing a fiscal shortfall of approximately £25 billion per year.
Her primary task is to deliver a credible, "market-friendly" budget that closes this gap without unnerving investors or adding to inflation. The Treasury is reportedly keen to avoid any tax hikes, such as on VAT, that could fuel inflation and limit the Bank of England's scope for future rate cuts.
This forces Reeves to find a difficult balance between raising revenue, likely through measures like freezing tax thresholds and increasing bank taxes all the while implementing politically sensitive spending cuts, which markets are skeptical will be delivered. Any failure to demonstrate fiscal discipline risks a negative market reaction, undoing the recent fall in gilt yields.
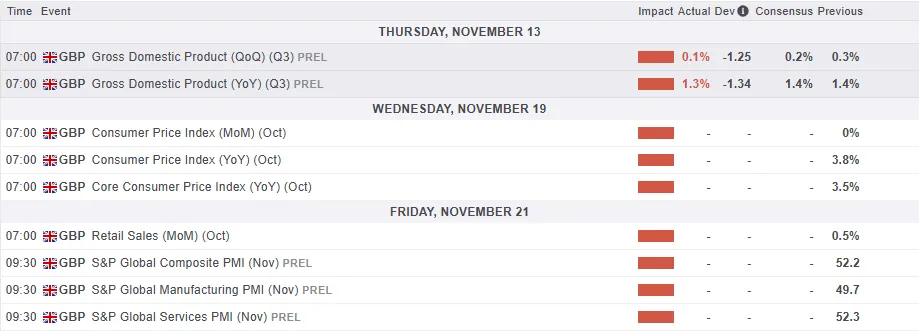
For all market-moving economic releases and events, see the MarketPulse Economic Calendar. (click to enlarge)
Technical Analysis - GBP/USD
From a technical point of view, GBP/USD has been in consolidation since Friday, November 7.
On the four-hour timeframe, there is a red block between the 1.3180 and 1.3100 with a four-hour candle close above opening up the possibility of a move in either direction.
The overarching macro picture points to further upside but bulls may remain slightly hesitant ahead of the UK budget.
Immediate upside resistance is provided by the 100-day MA at 1.31927 before the long-term descending trendline comes into play. Beyond that we have the 200-day MA resting at 1.3300 and resistance around the 1.3333 handles to consider.
The 1.3000 handle remains key for GBP/USD, the longer it holds the more bulls may be emboldened. If the UK fails to inspire a break of that level, GBP/USD may be set to end the year higher.
GBP/USD Daily Chart, November 13, 2025
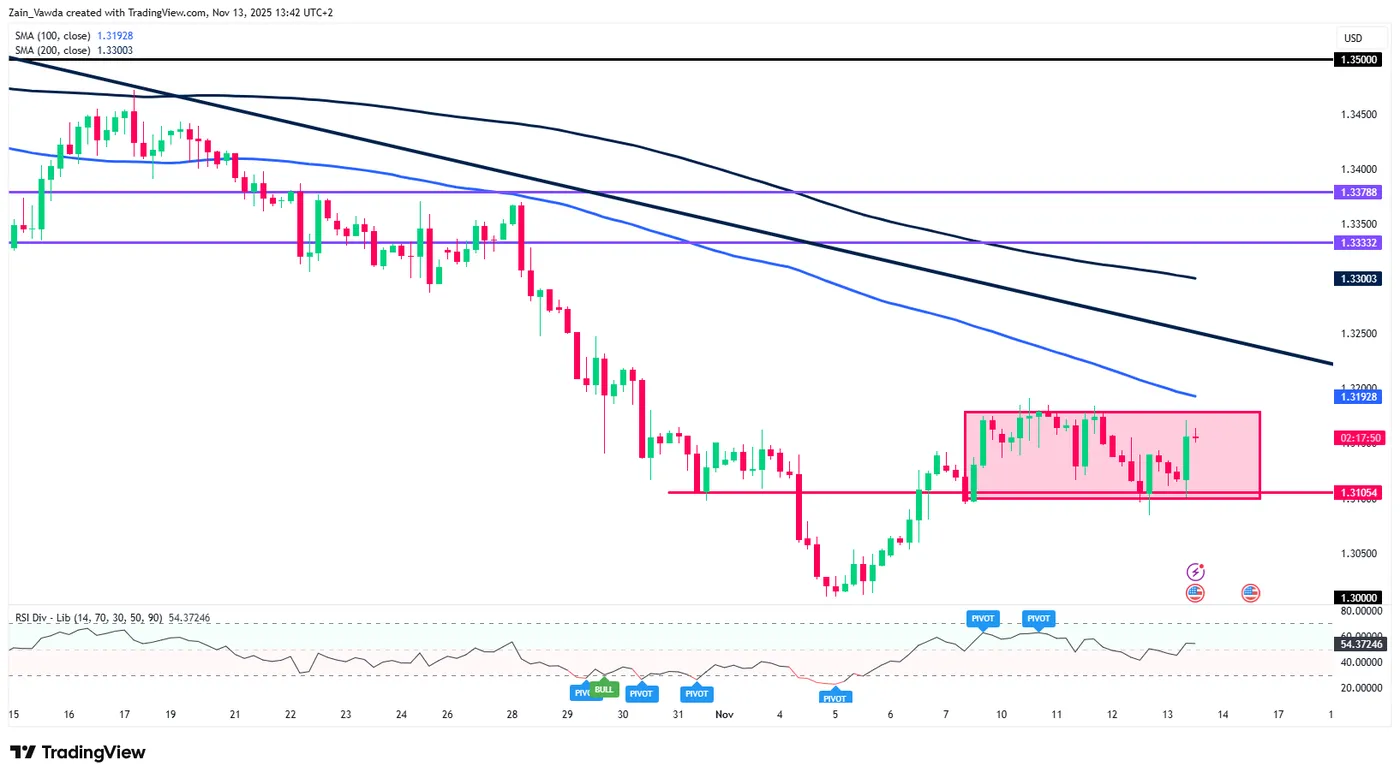
Source: TradingView.com
Cryptocurrency Market Stagnating, Lagging Competitors
Market Overview
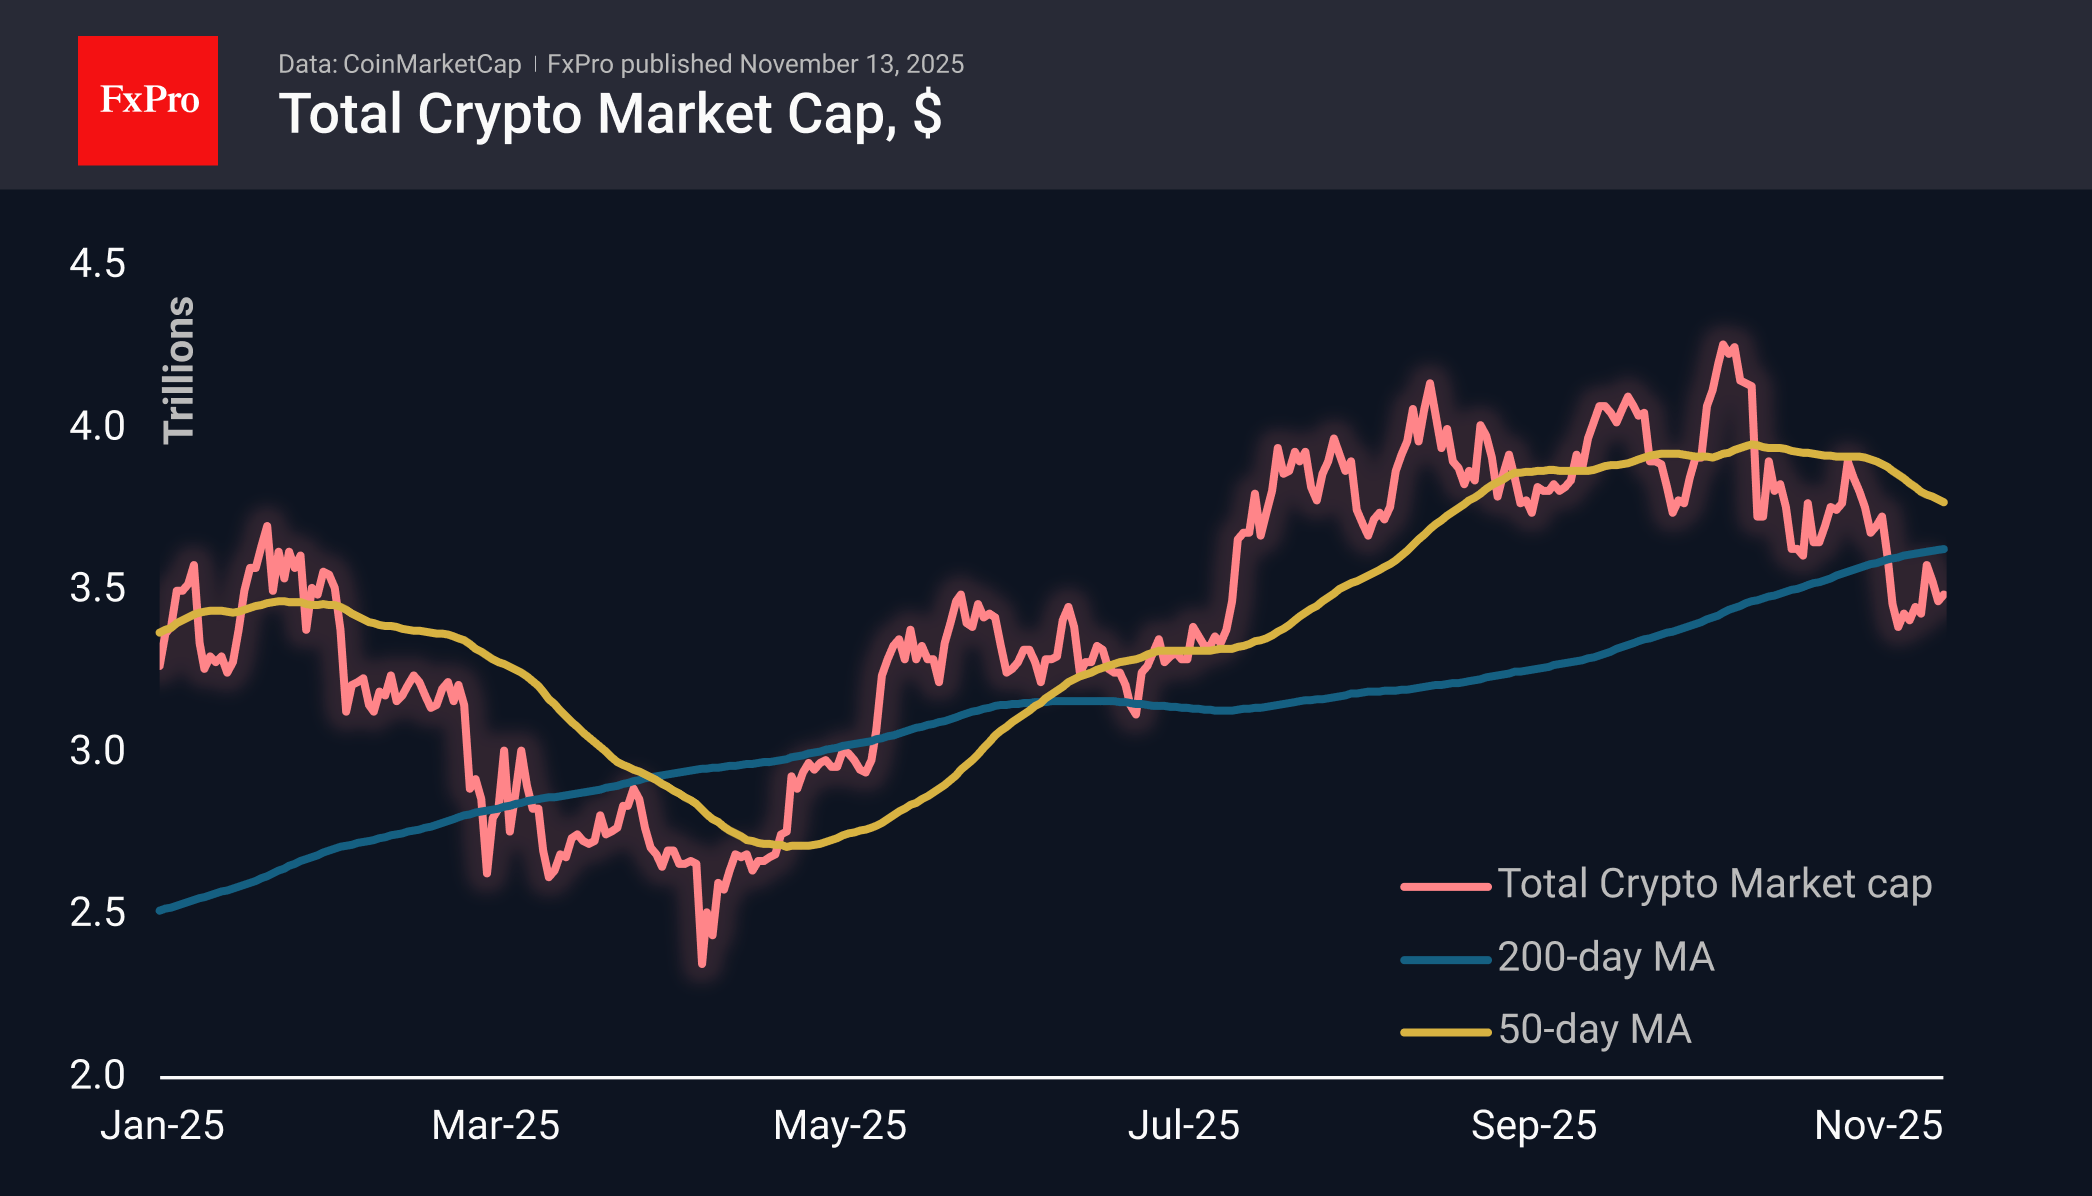
The cryptocurrency market capitalisation has changed little over the past day, fluctuating around $3.5 trillion. The cryptocurrency fear index has fallen to 15, its lowest level since 4 March. Notably, the cryptocurrency market has been left out of the recent rally in precious metals and stock indices. If this is not an attempt by whales to lock in profits from the rally since April or even from the growth of the last two years, then it is an alarming signal of deep-seated risk aversion that is about to manifest itself in larger markets.
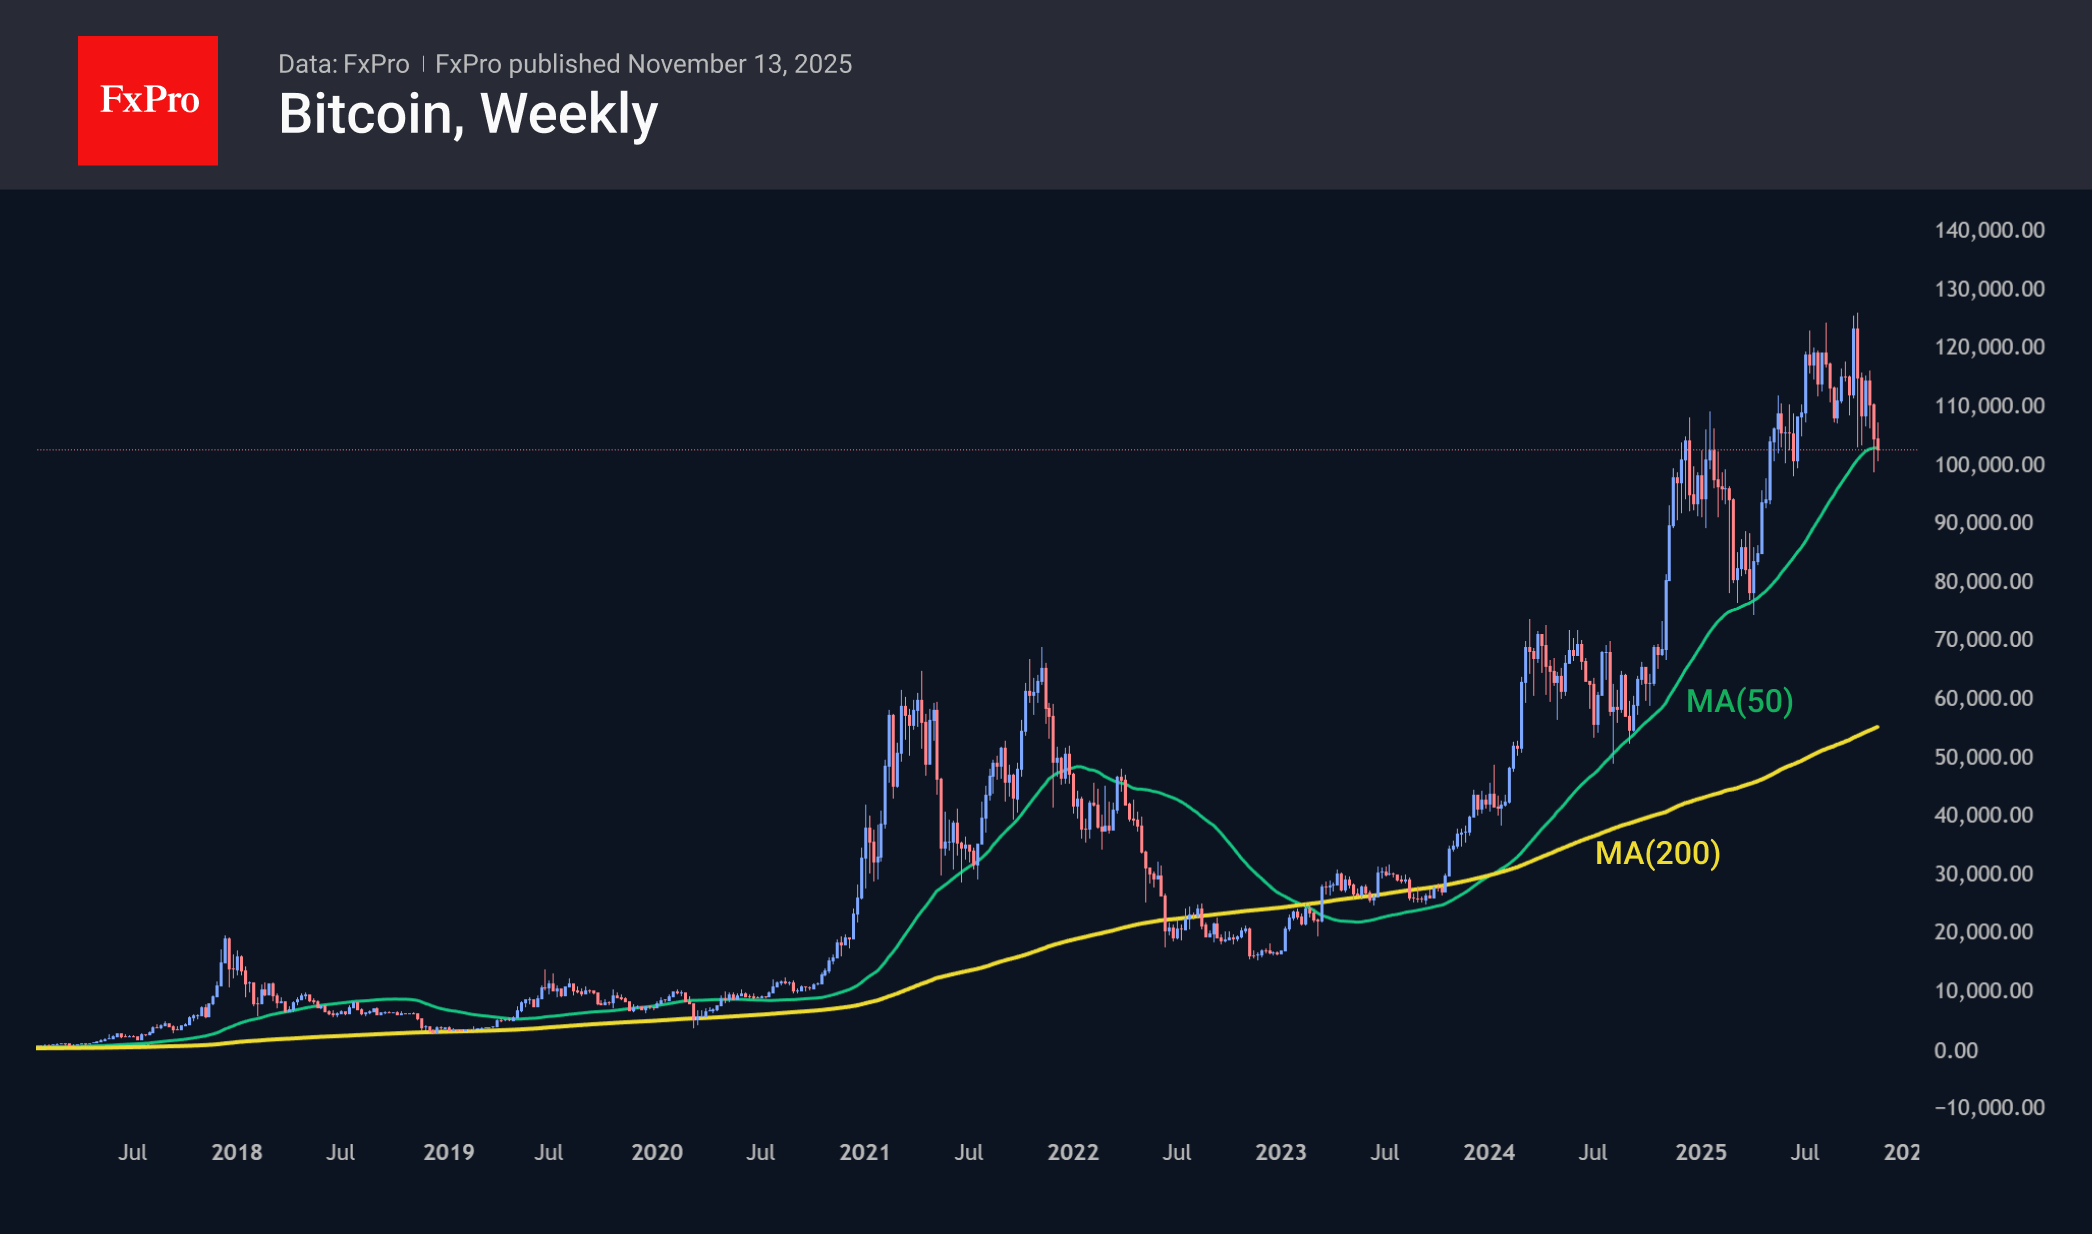
Bitcoin continues to struggle to remain within the bull market on weekly timeframes, trying to stay above the 50-week moving average. Last week’s close was on the edge, and attempts to develop an offensive this week are running into selloffs, despite the favourable external backdrop. The previous such transition occurred at the end of 2021, and so far, everything aligns with the 4-year halving cycles that many were quick to dismiss.
News Background
Over the past three months, a clear break has occurred in the correlation between Bitcoin and the stock market. The S&P 500 stock index has risen 7% during this time, while BTC has lost 15%. Judging by four years of close correlation, it can be argued that Bitcoin is currently undervalued, according to Santiment.
Jan3 founder Samson Mow attributes Bitcoin’s decline to a massive sell-off by investors who bought it over the past 12 to 18 months. They are rushing to lock in profits amid rumours of an imminent bearish trend in the crypto market.
The crypto market’s growth phase is nearing its end, so it is time for investors to consider locking in profits and reducing the share of crypto assets in their portfolios, according to Morgan Stanley, which cites a four-year cycle that the cryptocurrency market has consistently followed since 2009.
The bitcoin mining industry is facing a difficult period due to growing competition and declining profitability, said MARA CEO Fred Thiel. According to him, only those miners who have access to cheap energy or new business models will survive.
According to SoSoValue, spot Solana ETFs in the US have attracted more than $350 million in 11 trading sessions. The steady inflow of funds into new SOL ETFs came as a surprise to the market. The results significantly exceeded initial conservative forecasts, according to LVRG Research.
Visa has unveiled a pilot project called Visa Direct, which allows US customers to make direct cross-border payments in USDC stablecoin to recipients’ wallets. The initiative is aimed at content creators and freelancers.
The crypto industry is entering a new phase of capital raising. The launch of Coinbase’s ICO platform is expected to be a key event in this trend, according to Bitwise. The exchange will select and launch one verified project per month.
EUR/USD Holds Steady as US Government Shutdown Ends
The EUR/USD pair is trading flat on Thursday, hovering around 1.1587, following the House of Representatives' approval of a short-term budget bill that ends the longest US government shutdown in history.
The bill now awaits President Donald Trump's signature – a formality that will allow shuttered government agencies to resume operations within days.
While the resolution clears the way for the publication of a backlog of delayed macroeconomic data, the White House has cautioned that key October reports on employment and inflation may still be withheld from the public.
Market expectations for a December interest rate cut by the Federal Reserve have moderated but persist. The probability of a 25-basis-point cut has eased to 60%, down from 67% the day before.
This cautious sentiment was fuelled earlier in the week by ADP data, which showed that the US private sector shed an average of 11,250 jobs per week throughout October, amplifying concerns over a cooling labour market.
Technical Analysis: EUR/USD
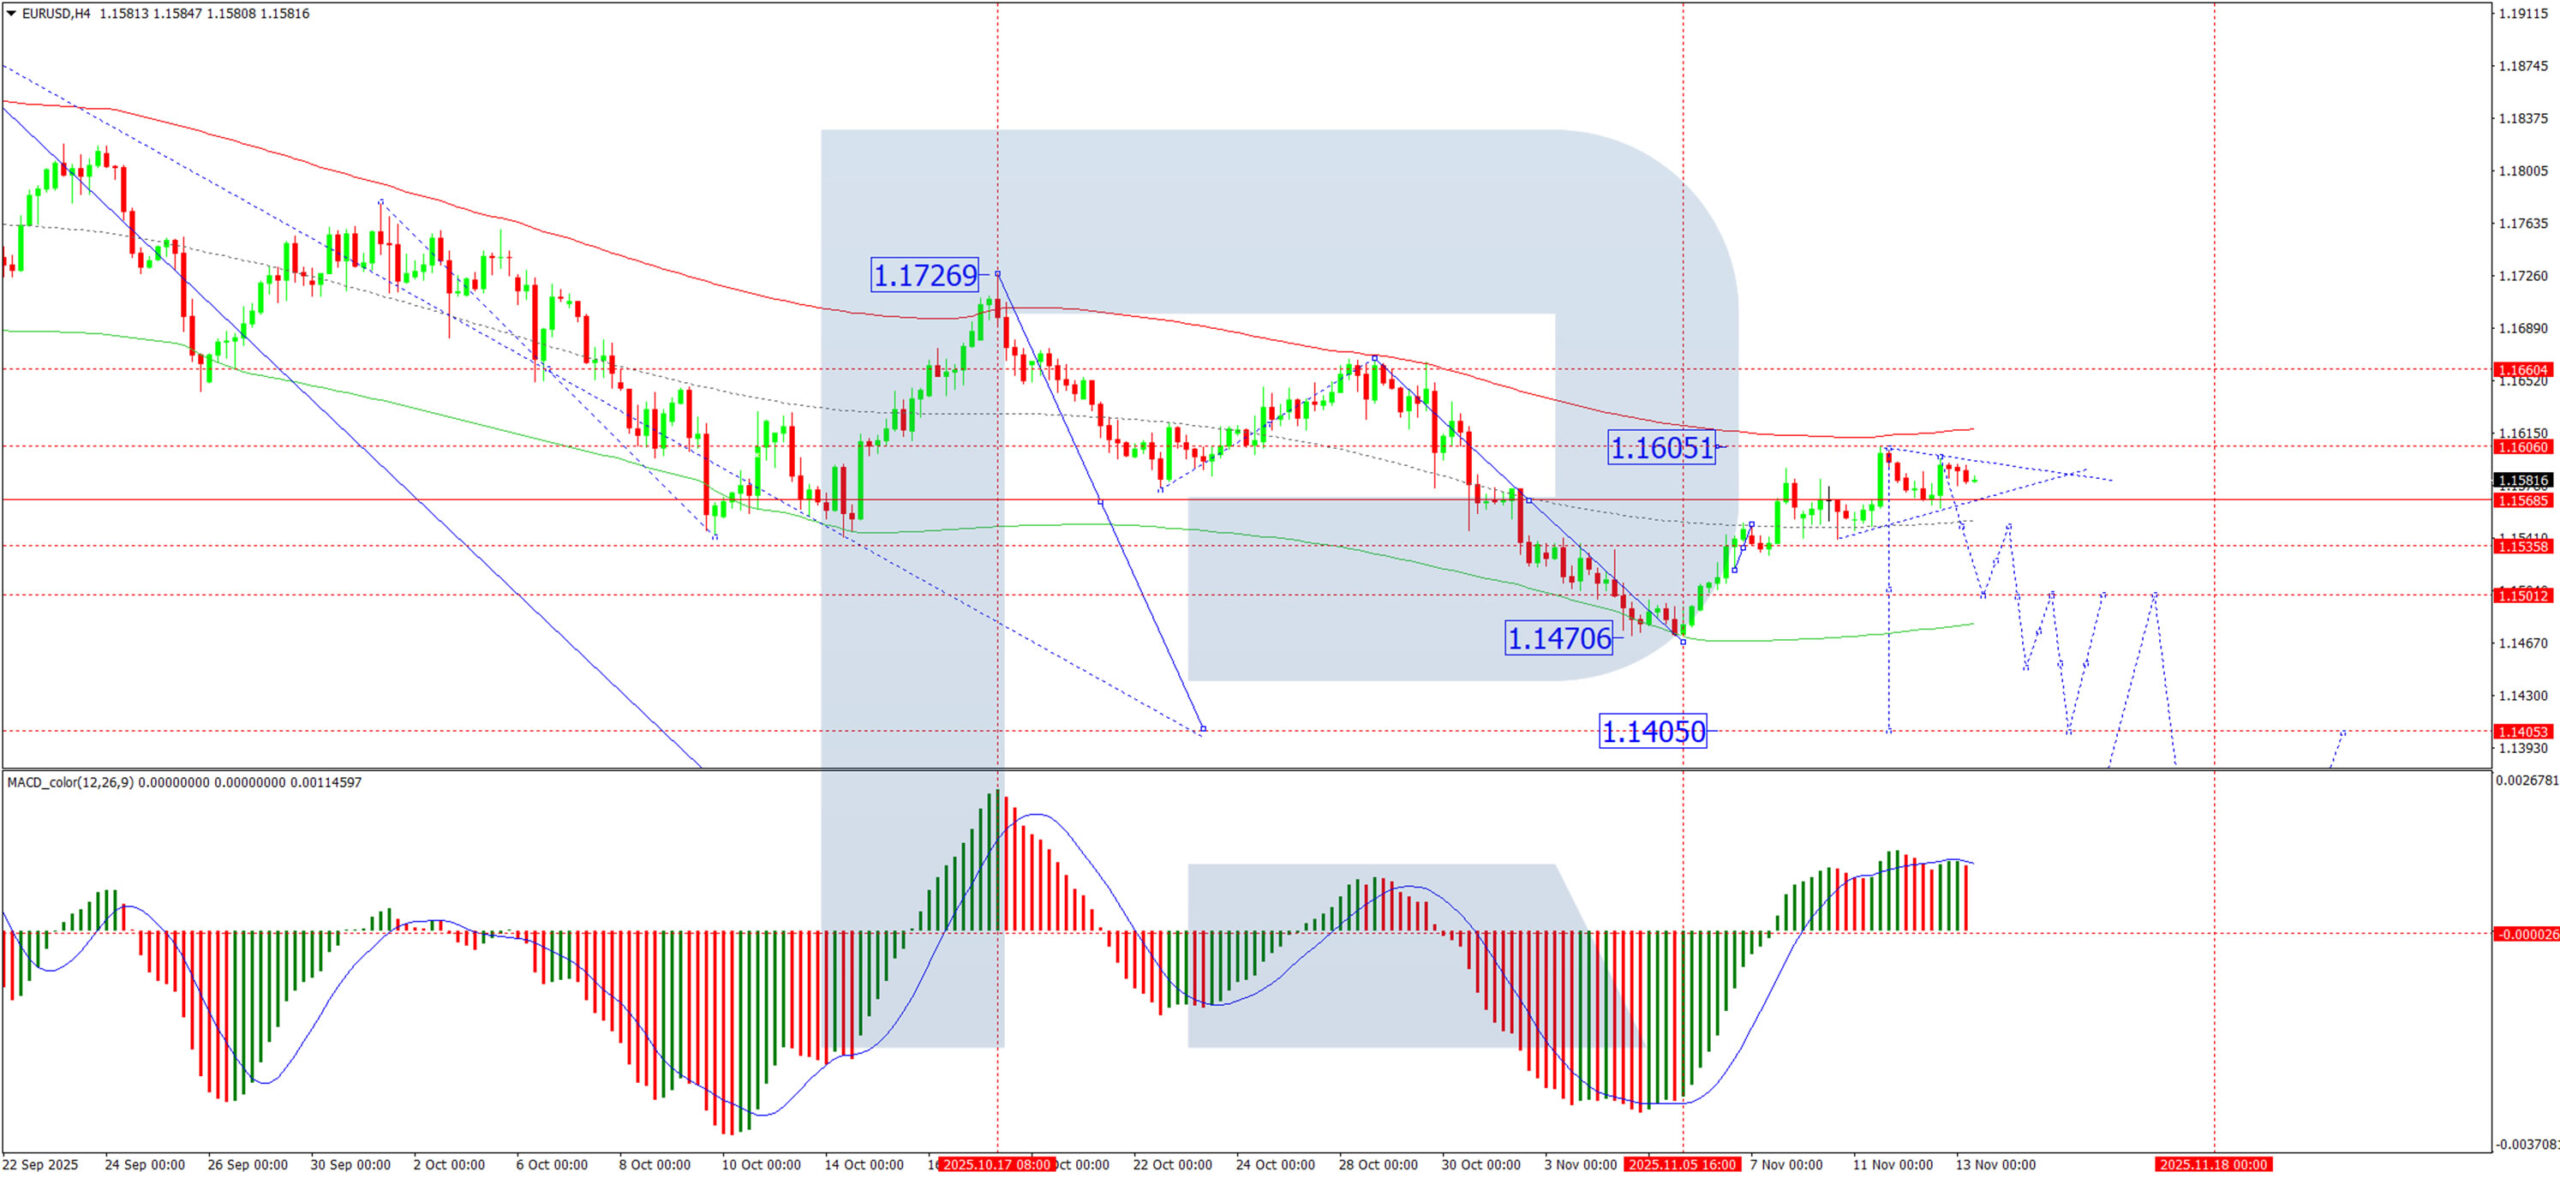
H4 Chart:
On the H4 chart, EUR/USD has completed a corrective wave to 1.1605 and has formed a tight consolidation range below this resistance level. We anticipate a downward breakout from this range, triggering a decline towards an initial target of 1.1505. A breach of this level would open the path for a further extension of the downtrend to 1.1405. This bearish outlook is technically supported by the MACD indicator. Its signal line is above zero but has diverged from its histogram and is pointing decisively downward, suggesting the recent upward correction has run its course and bearish momentum is reasserting itself.
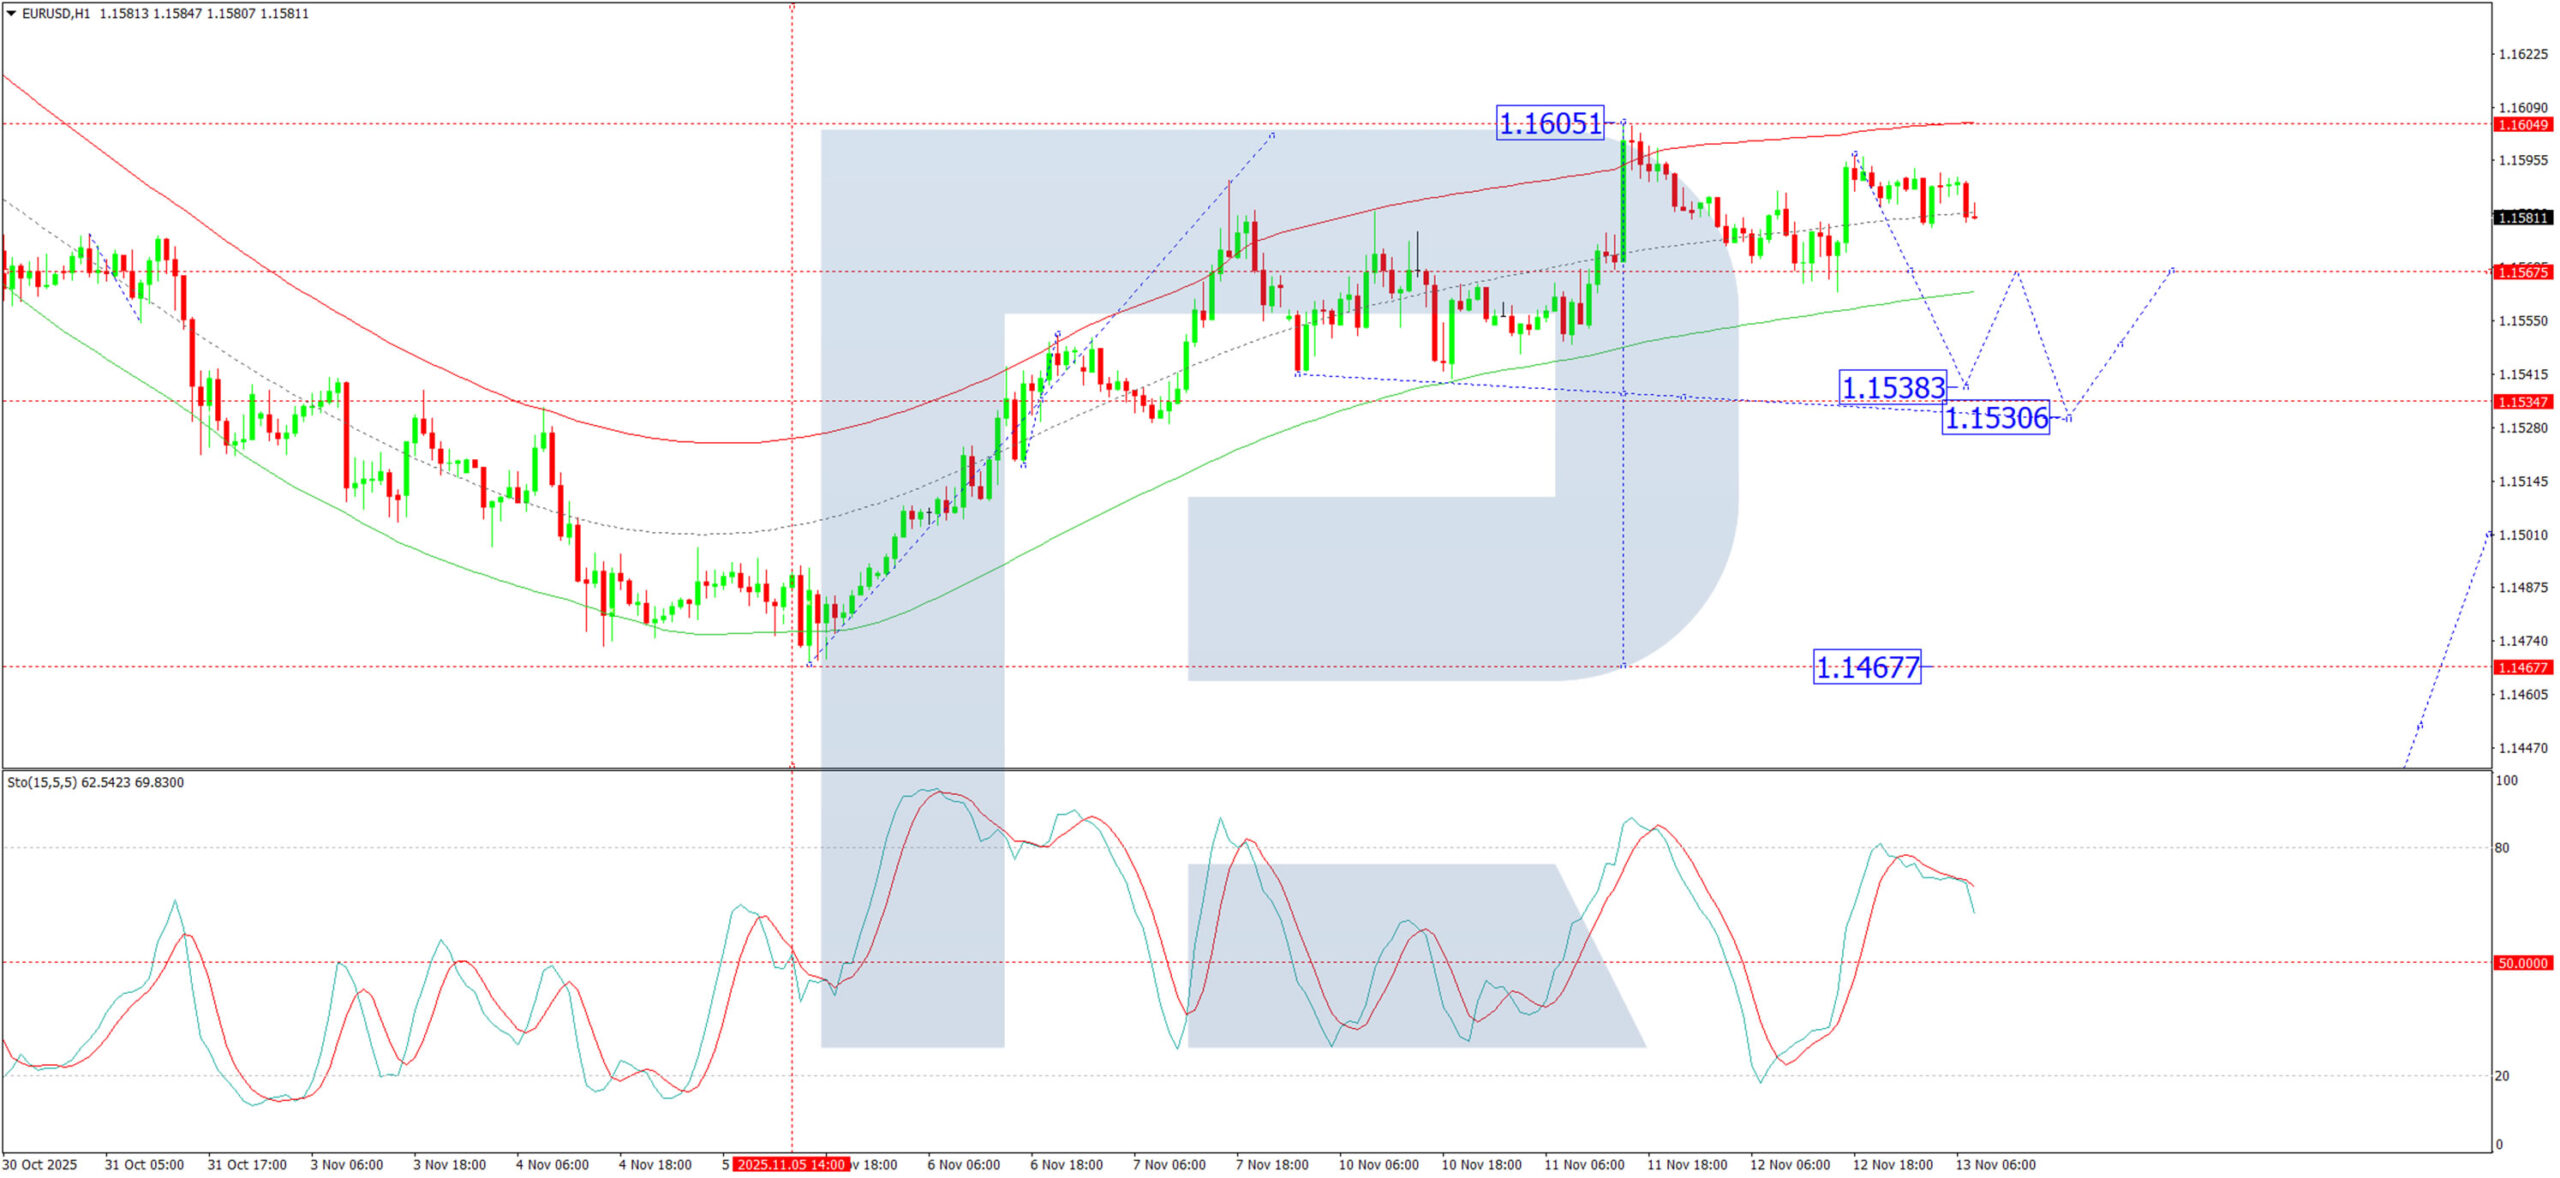
H1 Chart:
On the H1 chart, the pair completed a downward impulse to 1.1563, followed by a corrective bounce to 1.1597. These two levels define the upper and lower boundaries of a new consolidation range. A downward breakout is expected, leading to a resumption of the sell-off towards initial targets at 1.1538 and 1.1530. The Stochastic oscillator corroborates this view. Its signal line has turned down from below the 80 level and is falling steadily towards 20, indicating that short-term downward momentum is building.
Conclusion
While the end of the US government shutdown removes a key market overhang, the EUR/USD pair remains capped by underlying concerns about the US economy and a still-dovish Fed outlook. Technically, the structure points to a bearish resolution. The completion of the correction near 1.1605 suggests the pair is poised for a fresh leg lower, with key downside targets at 1.1505 and 1.1405.