Sample Category Title
USDJPY Elliott Wave View: Extends Rally After Buyers Zone Reaction
Hello fellow traders. In this technical article we’re going to take a look at the Elliott Wave charts of USDJPY Forex pair published in members area of the website. As our members know USDJPY is in overall bullish trend. Recently the pair made a clear three-wave correction. The pull back completed right at the extreme area ( buyers zone) and made rally as we expected. In this discussion, we’ll break down the Elliott Wave forcast.
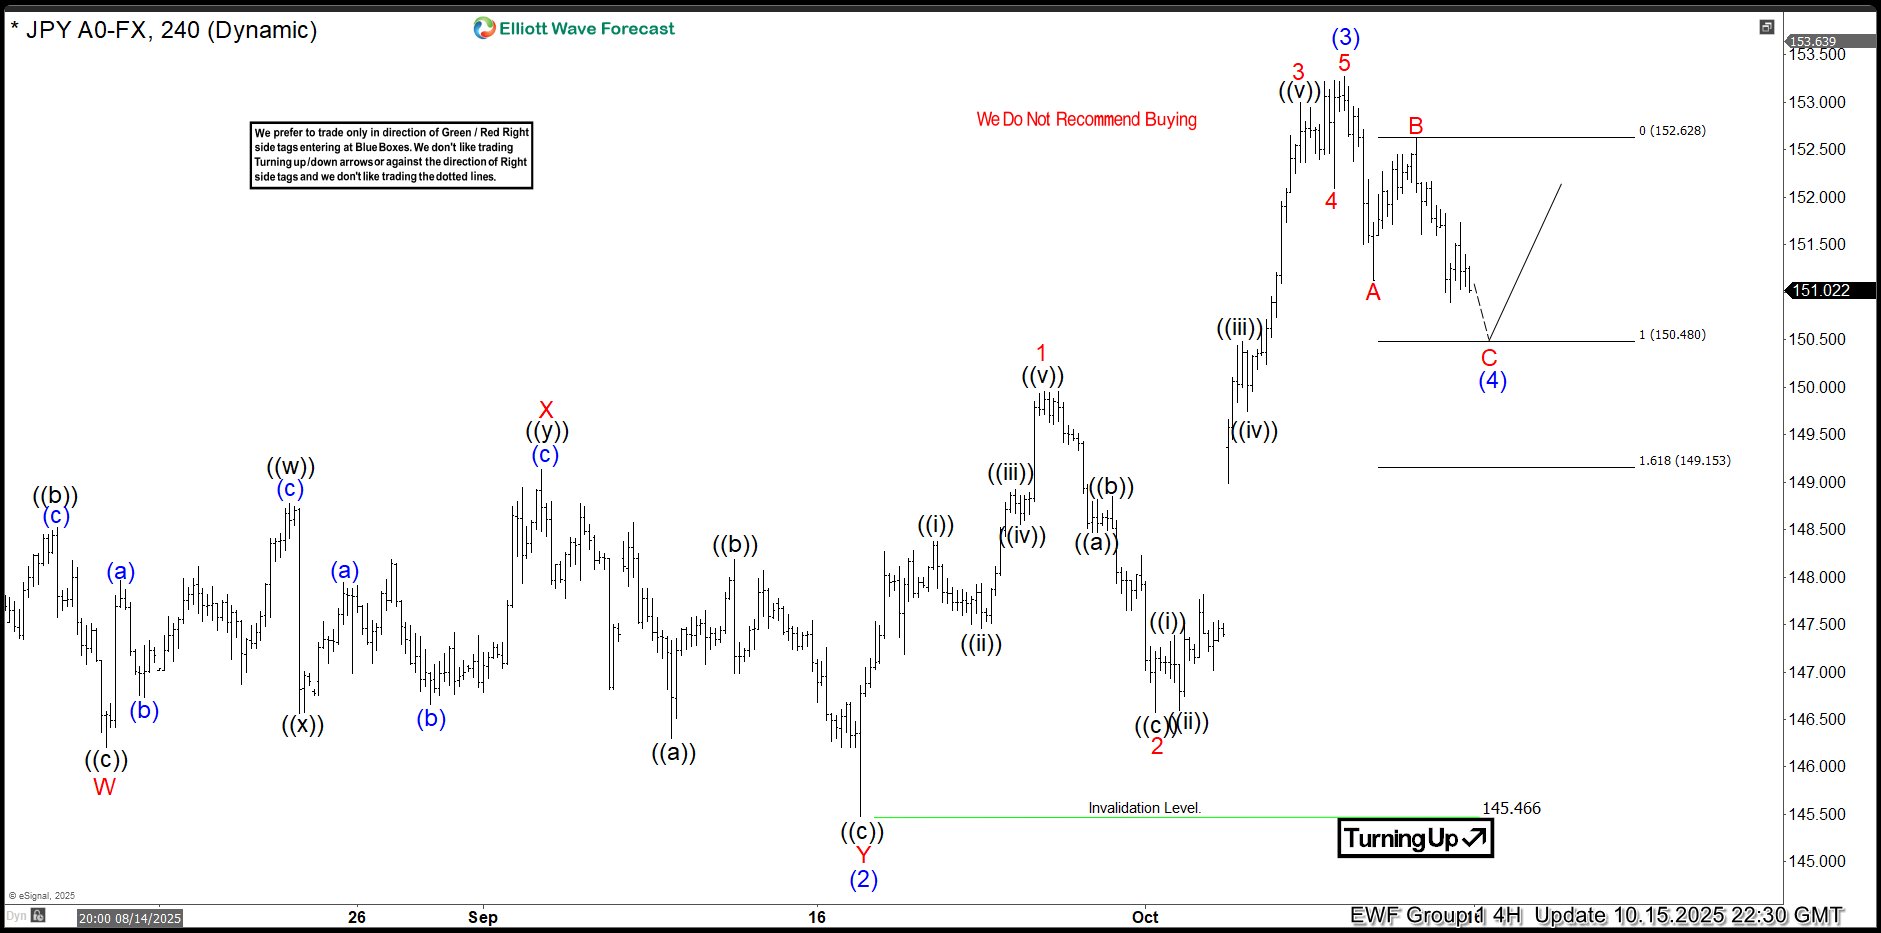
USDJPY Elliott Wave 4 Hour Chart 10.15.2025
USDJPY is forming a Zig Zag pullback. The correction shows incomplete sequences at the moment. We expect to see an extension down toward the marked equal legs zone at 150.48–149.15. In that area, buyers should appear again and take the lead. Ideally, we expect a rally toward new highs, or at least a 3-wave bounce as an alternative view. We advise against selling $USDJPY and instead favor the long side from the marked equal legs area at 150.48–149.15.
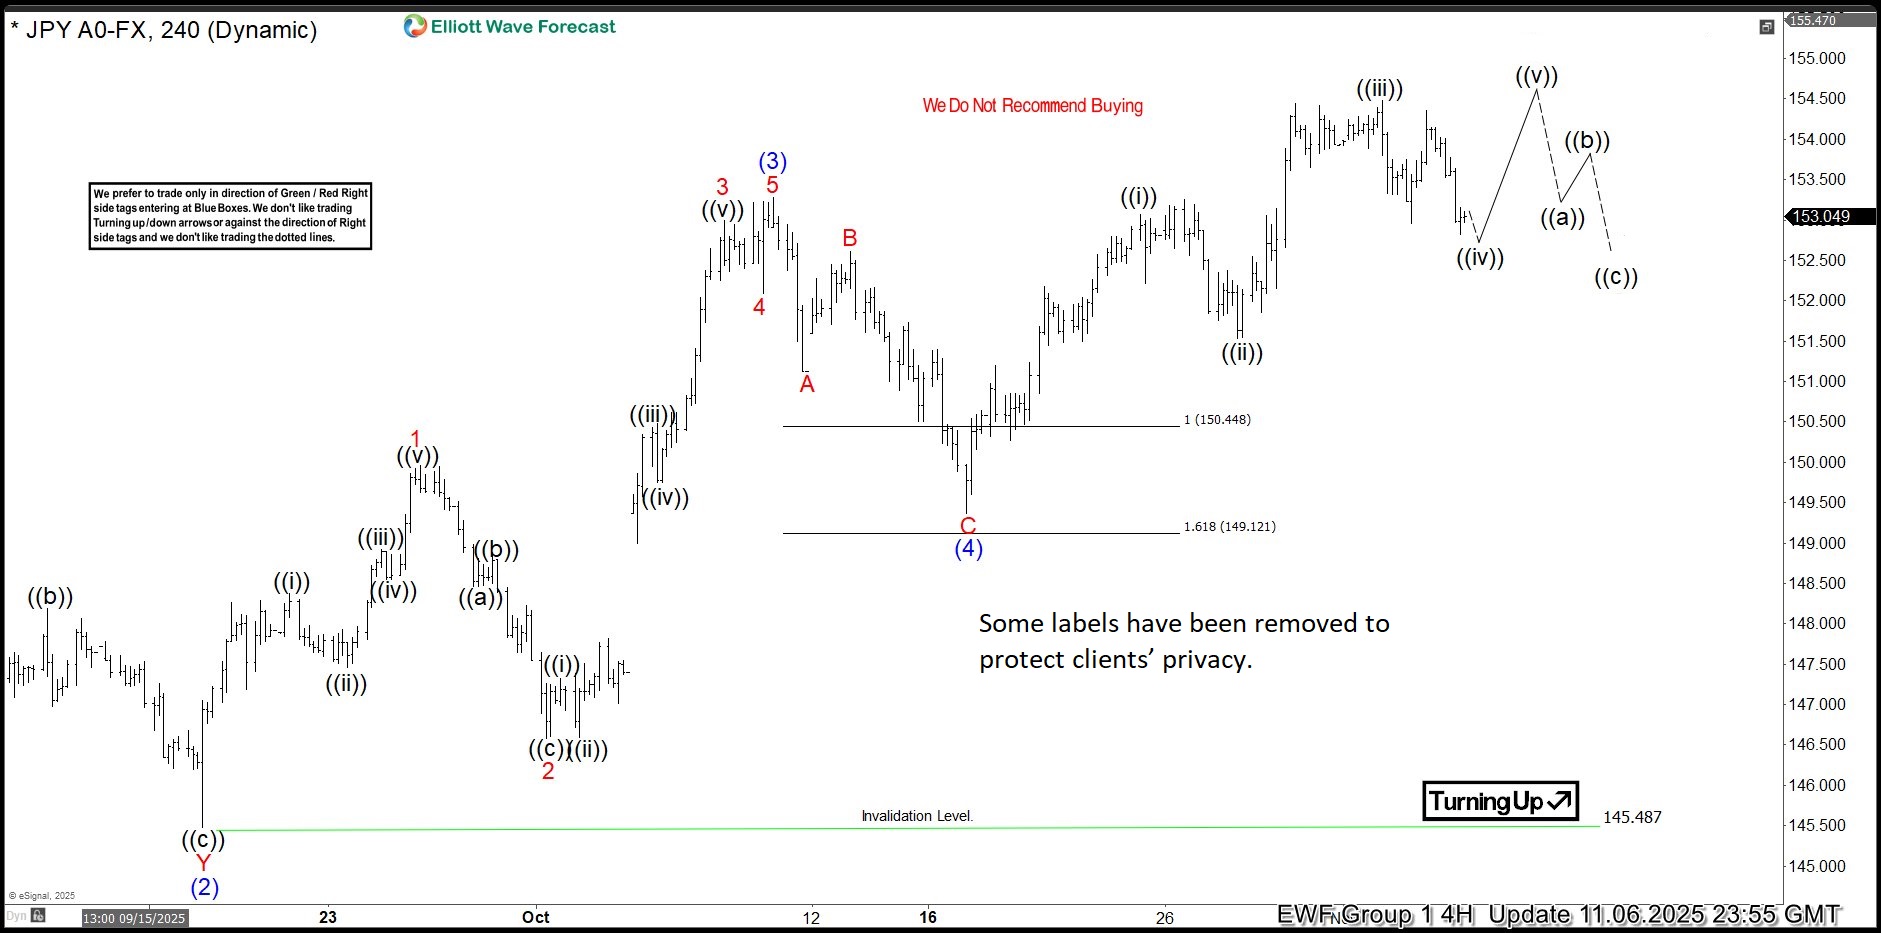
USDJPY Elliott Wave 4 Hour Chart 10.15.2025
USDJPY found buyers at the equal legs zone as expected. The forex pair has reacted strongly and eventually we got a break toward new highs.
Keep in mind that market is dynamic and presented view could have changed in the mean time.
XAU/USD: Takes a Breather After Recent Rally But Bulls Remain in Control Above $4,100
Gold price holds in consolidating mode for the second consecutive day, as bulls take a breather after strong rally on Monday, which broke above some key barriers and generated fresh bullish signals.
Very limited profit taking keeps the price afloat above $4100 (reverted to solid support) while upticks were capped at $4145 and so far unable to register close above cracked important Fibo resistance at $4134 (50% retracement of $4381/$3886/daily Kijun-sen/bull-channel upper boundary), clear break of which to spark fresh acceleration higher.
Daily studies show MA’s in full bullish setup but countered by 14-d momentum stuck at the centreline and overbought stochastic that currently lacks clear near-term direction signal.
However, the metal’s price holds steady after the latest rally that contributes overall bullish bias and keep focus at the upside.
Pause in the latest recovery was mainly caused by expectations of the US House vote on a deal to reopen the government and release delayed economic data which would provide more details about the condition of the US economy and Fed’s monetary policy path.
Bullish scenario sees sustained break of $4134 as a catalyst for fresh advance towards $4192/$4200 (Fibo 61.8% / psychological) and $4264 (Fibo 76.4%) in extension.
Broken $4100 level should ideally hold dips and guard a lower breakpoint at $4075 (broken Fibo 38.2% / 20DMA) loss of which will be bearish.
Res: 4100; 4134; 4150; 4192.
Sup: 4100; 4075; 4046; 4038.

Sunset Market Commentary
Markets
Market moves in FI and FX space are small and technically irrelevant today. They ignore the bullish risk sentiment lifting stock markets to new all-time highs. ECB speeches grabbed some attention in absence of eco data today. Austrian national bank governor Kocher expects that not much will happen with interest-rate policy in the next months. He didn’t see the strong reduction in growth rates and the inflationary effects of the trade conflicts materializing that were anticipated in March and April. The difficulty now is to assess whether there will still be some effects trickling down in the next couple of months or perhaps even years. If any, it’s hard to tell whether this will be overall inflationary or disinflationary, according to Kocher who recently replaced one of the most hawkish voices inside the ECB, governor Holzmann. Bank of France governor Villeroy talked about the country’s growth forecasts, but these might also influence the overall set for the euro zone when the ECB meets next in December. Villeroy believes that current French growth projections of 0.7% for this year and 0.9% for 2026 should now be considered as minimums as the economy continued to show resilience to political turmoil in Q3. For the overall EMU growth trajectory, the central bank penciled in 1.2%-1%-1.3% in September with a first indication for 2028 being available on December 18. When it comes to inflation, the central projected an average 2.1%-1.7%-1.9% over the policy horizon. The 2027 forecast might be subject to a downgrade after an EU parliamentary committee at the beginning of the week backed amendments to the draft climate law including a one-year delay to the Emissions Trading System 2. Without ETS2 taking effect, the inflation undershoot will be larger ceteris paribus. The ETS system caps emissions and lets companies trade allowances with ETS2 extending the concept to buildings and road transport from energy generation, aviation,… ECB Simkus is one the governors who emphasized that a return to 2% inflation by 2027 heavily depends on ETS2. Finally, hawkish ECB board member Schnabel thinks that (growth and inflation) risks are rather tilted a little bit to the upside. Her personal view is one of an economy that is recovering, with a closing output gap, expecting a significant fiscal impulse which stimulates the economy. Disinflationary pressures likes the danger of cheap Chinese goods or an extension of the euro rally are currently out of play while sticky services inflation and still pretty strong food price increases deserve attention.
News & Views
The Norwegian central bank (NB) published its H2 financial stability today. The Norwegian financial system is resilient as households and firms have adequate debt-servicing capacity and as banks are solid. Several events could weaken financial stability though. Norwegian households have high debt-to-income (DTI) ratios, but debt growth has been slower than income growth in recent years. The commercial real estate market is stable, but still challenging for developers. The NB assesses Norwegian banks’ commercial real estate (CRE) exposure as substantial. In recent years, the situation has become more difficult for CRE firms owing to higher financing costs and lower property values, but high employment and increased rental income have enabled most firms to cover expenses with current earnings. Solvency in the CRE sector as a whole improved somewhat. Somewhat higher bank losses on loans to real estate developers are likely though. On the financial sector as a whole; the NB denominates losses as low with banks satisfying capital and liquidity requirements. No reaction in the Norwegian krone with EUR/NOK holding near 11.65.
Indian headline inflation dropped in October to 0.25% Y/Y, down from 1.44% in September, the lowest level ever. The decline was for an important part driven by a sharp 3.72% Y/Y decline in prices of food and beverages. The Ministry of Statistics says that the decline in headline inflation and food inflation is mainly attributed to a full month’s impact of a decline in GST (sales tax) and a favorable base effect. The Reserve bank of India has an inflation target range of 2-6%. According to Bloomberg data, core inflation rose to 4.7% Y/Y (from 4.6%), but this was mainly due to higher gold prices (57.8%). Core CPI excluding gold and sliver in this respect also eased to 2.5% from 2.8%. Even as the inflation dynamics in October maybe reached the bottom, it still supports the case for further easing by the Reserve Bank of India at its early December meeting. The RBI currently has its policy rate at 5.50% after cutting the policy rate by 100 bps YTD. The rupee trades little changed near USD/INR 88.64.
EUR/USD Mid-Day Outlook
Daily Pivots: (S1) 1.1551; (P) 1.1578; (R1) 1.1610; More…
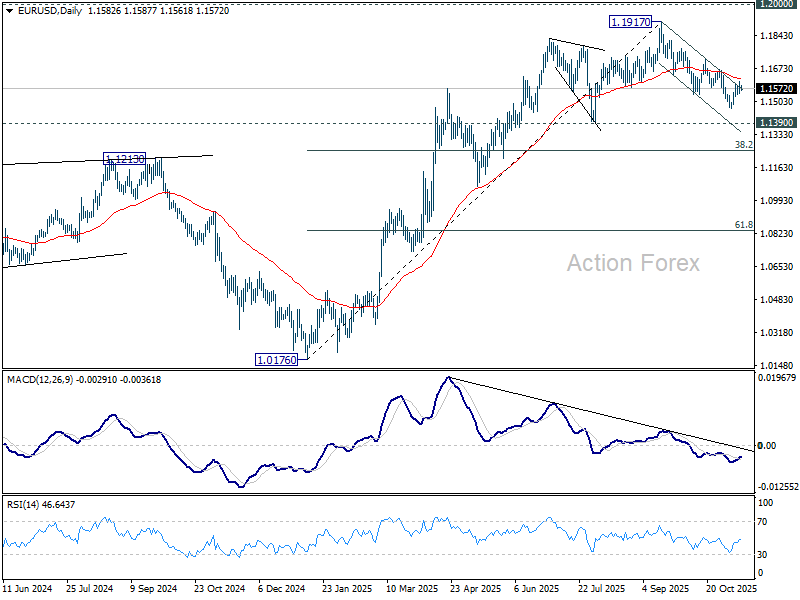
Outlook in EUR/USD is unchanged and intraday bias remains neutral. Further decline remains mildly in favor below 55 D EMA (now at 1.1620). Break of 1.1467 support will resume the decline from 1.1917 to 1.1390 support next. However, sustained trading above 55 D EMA will argue that fall from 1.1971 has completed as a correction only, and bring further rise to 1.1727 resistance next.
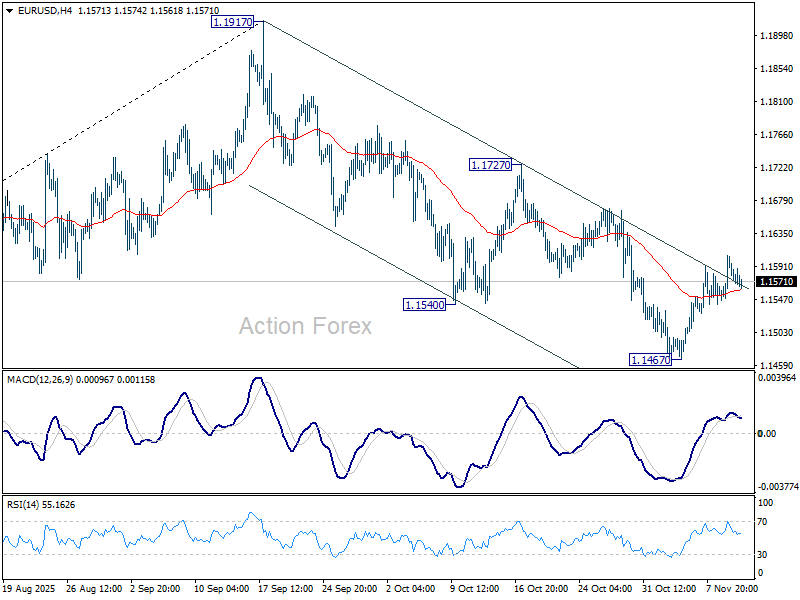
In the bigger picture, considering bearish divergence condition in D MACD, a medium term top is likely in place at 1.1917, just ahead of 1.2 key psychological level. As long as 55 W EMA (now at 1.1306) holds, the up trend from 0.9534 (2022 low) is still expected to continue. Decisive break of 1.2000 will carry larger bullish implications. However, sustained trading below 55 W EMA will argue that rise from 0.9534 has completed as a three wave corrective bounce, and keep long term outlook outlook bearish.
GBP/USD Mid-Day Outlook
Daily Pivots: (S1) 1.3116; (P) 1.3150; (R1) 1.3184; More...
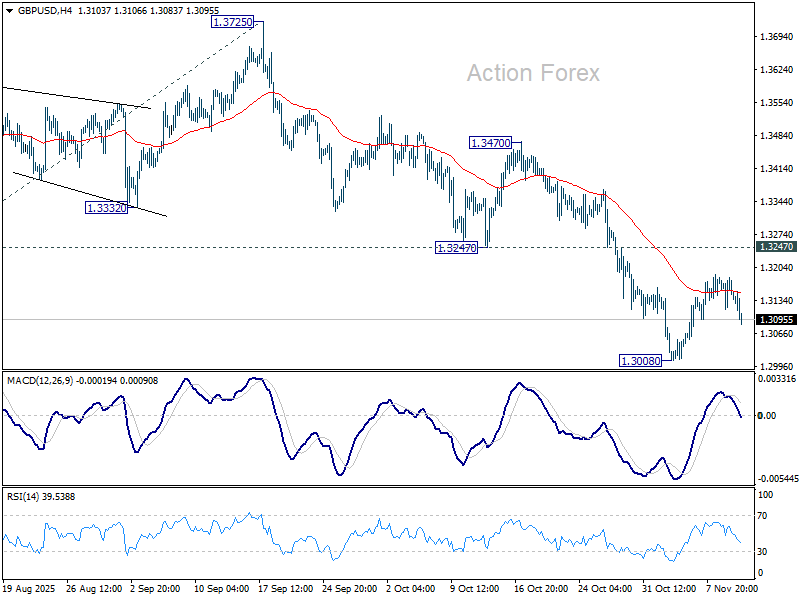
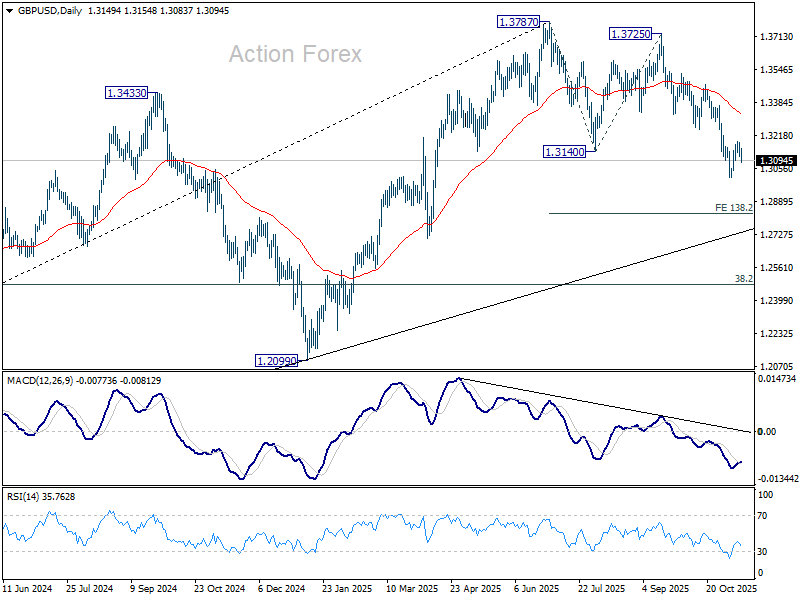
GBP/USD is still bounded in range above 1.3008 and intraday bias remains neutral. More consolidations could be seen but further decline is expected as long as 1.3247 support turned resistance holds. Break of 1.3008 will target 138.2% projection of 1.3787 to 1.3140 from 1.3725 at 1.2831. Nevertheless, firm break of 1.3247 will suggest that fall from 1.3787 has completed as a corrective move already.
In the bigger picture, the break of 55 W EMA (now at 1.3185) is taken as the first sign that corrective rise from 1.0351 (2022 low) has completed. Decisive break of trend line support (now at 1.2780) will solidify this case and target 38.2% retracement of 1.0351 to 1.3787 at 1.2474 next. Meanwhile, in case of another rise, strong resistance should emerge below 1.4248 (2021 high) to cap upside to preserve the long term down trend.
USD/CHF Mid-Day Outlook
Daily Pivots: (S1) 0.7972; (P) 0.8020; (R1) 0.8053; More…
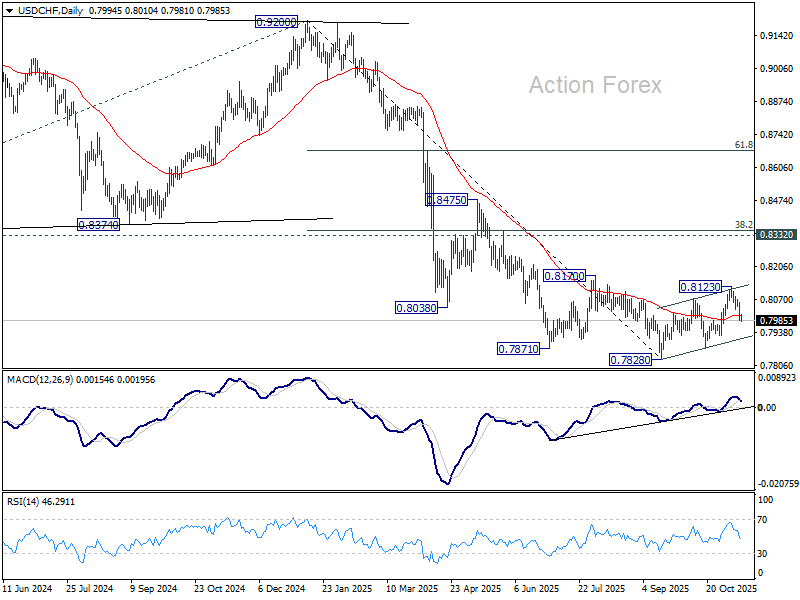
USD/CHF's fall from 0.8123 is in progress and intraday bias stays on the downside. Corrective rebound from 0.7828 should have completed with three waves up to 0.8123. Deeper decline should be seen to 0.7872 support. Firm break there will argue that larger down trend is ready to resume through 0.7828 low. On the upside, above 0.8031 minor resistance will turn intraday bias neutral again.
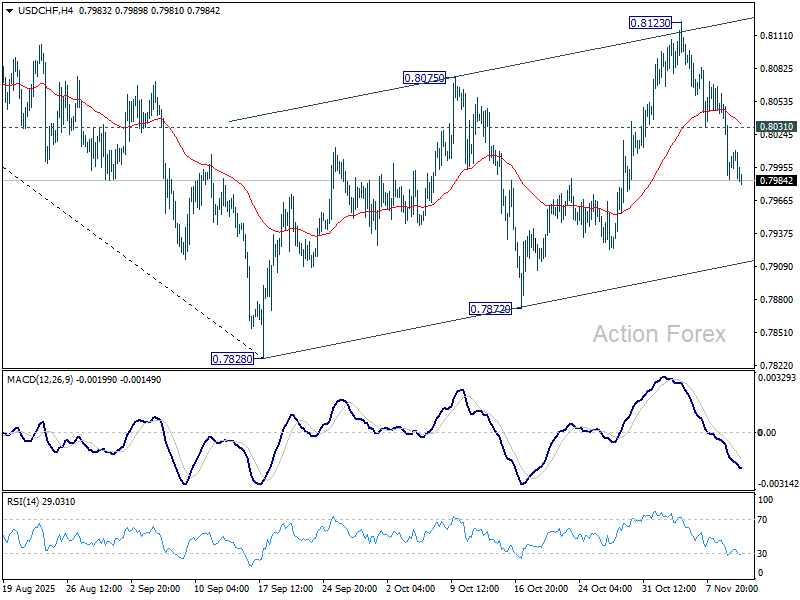
In the bigger picture, long term down trend from 1.0342 (2017 high) is still in progress. Next target is 100% projection of 1.0146 (2022 high) to 0.8332 from 0.9200 at 0.7382. In any case, outlook will stay bearish as long as 0.8332 support turned resistance holds (2023 low).
USD/JPY Mid-Day Outlook
Daily Pivots: (S1) 153.72; (P) 154.11; (R1) 154.54; More...
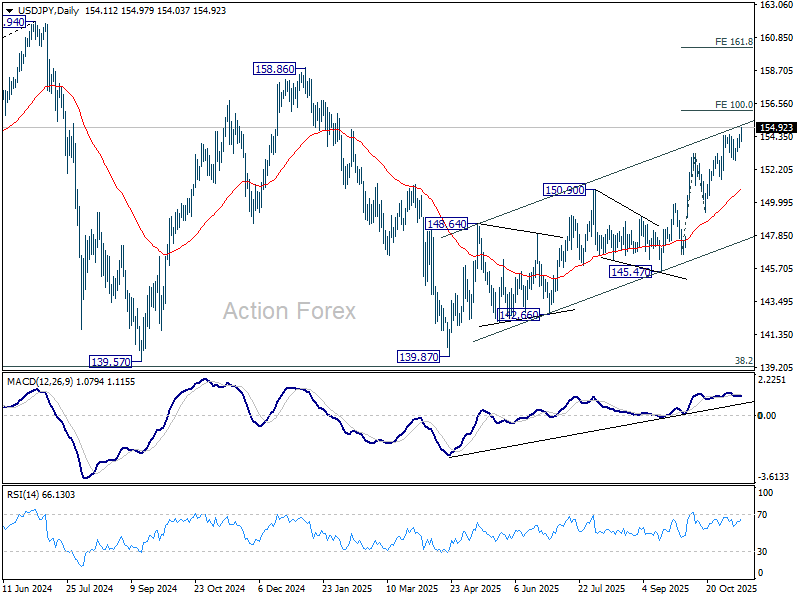
USD/JPY's rally continues today and intraday bias stays on the upside. Current rally from 139.87 should target 100% projection of 146.58 to 153.26 from 149.37 at 156.05. Firm break there will pave the way to 158.86 key structural resistance. For now, near term outlook will stay bullish as long as 152.81 support holds, in case of retreat.
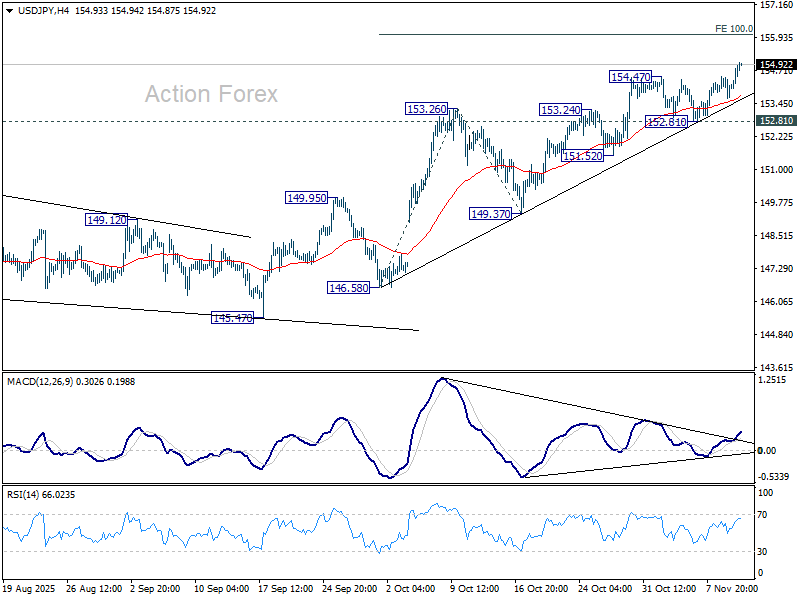
In the bigger picture, current development suggests that corrective pattern from 161.94 (2024 high) has completed with three waves at 139.87. Larger up trend from 102.58 (2021 low) could be ready to resume through 161.94 high. On the downside, break of 149.37 support will dampen this bullish view and extend the corrective pattern with another falling leg.
Another Day, Same Story: Yen Extends Losses, Sterling Under Pressure, Franc Firm
The key themes driving global FX markets this week continued to dominate today’s session, with Yen weakness, Sterling softness, and Swiss Franc strength dominating. Political pressure in Japan, renewed rate-cut expectations in the UK, and optimism over a U.S.–Swiss trade breakthrough have kept traders rotating between safety and growth exposures, while risk sentiment remains mixed.
In Japan, the Yen’s selloff extended as Prime Minister Sanae Takaichi again urged the BoJ to hold off on tightening, arguing that the current bout of inflation—driven largely by food prices—is not the kind policymakers should welcome. Her public stance has effectively narrowed the odds of a rate hike this year. Governor Kazuo Ueda would likely refrain from proposing any move at the December meeting, with January seen as the earliest possible window for resuming normalization.
In the UK, Sterling remained under pressure as traders grew more confident that the BoE will deliver a rate cut in December, following weak employment data earlier this week. The Q3 GDP figures due tomorrow will be a critical input into those expectations, while the Autumn Budget on November 26 is viewed as the final political hurdle before easing can proceed.
Meanwhile, the Swiss Franc continued to outperform on mounting optimism that Washington and Bern are close to finalizing a trade deal that would slash U.S. tariffs on Swiss exports from 39% to 15%. Such a move would align Swiss treatment with that of EU goods, boosting the country’s export competitiveness and capital inflows.
Across broader markets, investors are awaiting a crucial U.S. House vote expected later today that could finally bring an end to the historic government shutdown. Yet sentiment remains tentative, with AI-related and semiconductor stocks oscillating after recent heavy swings. The uncertainty has kept risk appetite from gaining a firm footing, especially among commodity-linked currencies.
For the week so far, Swiss Franc leads as the strongest performer, followed by Aussie and Kiwi, though both antipodeans remain capped below last week’s highs, reflecting the prevailing indecision in risk trades. On the other end, Yen is the weakest, trailed by Sterling and Dollar, while Euro and Loonie are holding mid-pack.
In Europe, at the time of writing, FTSE is up 0.03%. DAX is up 1.27%. CAC is up 1.35%. UK 10-year yield is up 0.029 at 4.421. Germany 10-year yield is up 0.002 at 2.665. Earlier in Asia, Nikkei rose 0.43%. Hong Kong HSI rose 0.85%. China Shanghai SSE fell -0.07%. Singapore Strait Times rose 0.59%. Japan 10-year JGB yield fell -0.004 to 1.691.
ECB’s Schnabel: Rates appropriately set, inflation still sticky
ECB Executive Board member Isabel Schnabel said interest rates are “in a good place,” indicating no immediate need to shift policy as long as major shocks are avoided. “If there is no big shock, I would be rather relaxed,” she saidat a conference today.
Still, Schnabel warned that the risks to inflation are "tilted a little bit to the upside". “Services inflation is a bit higher than we thought,” she noted, adding that pay pressures are cooling “more slowly than expected.”
Schnabel also pointed to signs that the Eurozone economy is recovering faster than feared, citing October’s PMI improvement as evidence that growth momentum is picking up even under higher U.S. tariffs.
“My narrative is one of an economy that is recovering, with a closing output gap,” she said.
RBA’s Jones warns on geopolitical risk underpricing, notes Gold shift
RBA Assistant Governor Brad Jones cautioned that global markets may be underestimating geopolitical risks and systemic fragmentation. At a conference today, he highlighted that risk premiums across major asset classes have fallen to “concerning lows,” suggesting investors are failing to fully price in potential shocks.
“We’re just surprised that there’s not a bit more reflected in spreads given what we observe,” Jones said, pointing to what he called “a confronting set of potential risks.”
Jones also drew attention to shifting dynamics in global reserve management, noting “emerging evidence of fragmentation” in how central banks allocate their assets. He said a distinct group of countries has driven the recent surge in official Gold holdings, reflecting a growing desire to diversify away from dollar- and euro-denominated assets amid heightened concerns about "risk of asset seizure sanctions".
USD/JPY Mid-Day Outlook
Daily Pivots: (S1) 153.72; (P) 154.11; (R1) 154.54; More...
USD/JPY's rally continues today and intraday bias stays on the upside. Current rally from 139.87 should target 100% projection of 146.58 to 153.26 from 149.37 at 156.05. Firm break there will pave the way to 158.86 key structural resistance. For now, near term outlook will stay bullish as long as 152.81 support holds, in case of retreat.
In the bigger picture, current development suggests that corrective pattern from 161.94 (2024 high) has completed with three waves at 139.87. Larger up trend from 102.58 (2021 low) could be ready to resume through 161.94 high. On the downside, break of 149.37 support will dampen this bullish view and extend the corrective pattern with another falling leg.
ECB’s Schnabel: Rates appropriately set, inflation still sticky
ECB Executive Board member Isabel Schnabel said interest rates are “in a good place,” indicating no immediate need to shift policy as long as major shocks are avoided. “If there is no big shock, I would be rather relaxed,” she saidat a conference today.
Still, Schnabel warned that the risks to inflation are "tilted a little bit to the upside". “Services inflation is a bit higher than we thought,” she noted, adding that pay pressures are cooling “more slowly than expected.”
Schnabel also pointed to signs that the Eurozone economy is recovering faster than feared, citing October’s PMI improvement as evidence that growth momentum is picking up even under higher U.S. tariffs.
“My narrative is one of an economy that is recovering, with a closing output gap,” she said.
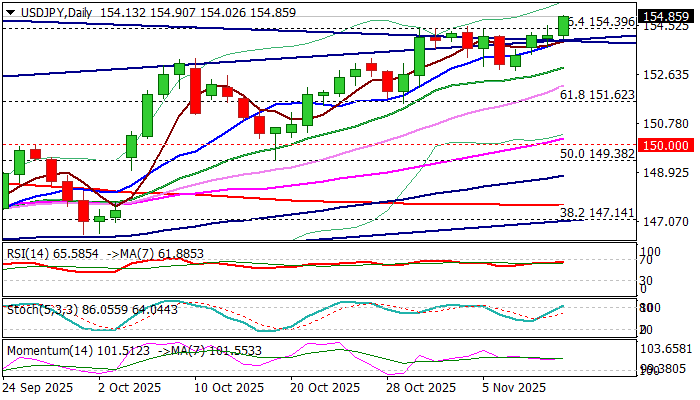
USDJPY Hits New Multi-Month High, But Possible FX Intervention Urges Caution
USDJPY accelerated higher on Wednesday, as breach of recent multi-tops (148.50) triggered stops and pushed the price to the highest since early February.
The pair was up 0.45% on Wednesday morning, with recent break above bull-channel upper boundary and bear-trendline off 161.95 (153.92/95) / Fibo 76.4% of 158.87/139.88 (154.39 respectively) generating fresh bullish signal.
Daily close above the latter to verify the signal.
Bulls neared 155.00 (round-figure barrier), violation of which would provide fresh boost on triggering stops, parked just above and expose next targets at 155.88 and 156.24.
Technical studies remain firmly bullish on daily chart and supports the action, with currently preferred scenario of limited profit taking to mark positioning for further advance.
Dips should stay above 154.00 (converged and crossing trendlines) to keep bias firmly with bulls.
However, market participants remain very cautious of potential intervention of the Japanese central bank, which is not very happy with sharp weakening of the national currency.
Although the intervention signals were so far only verbal, without more significant signals, it remains as one of very likely scenarios in the near-term.
Res: 155.00; 155.88; 156.24; 156.50
Sup: 154.39; 154.00; 153.40; 152.90