
Sample Category Title
USD/CHF Daily Outlook
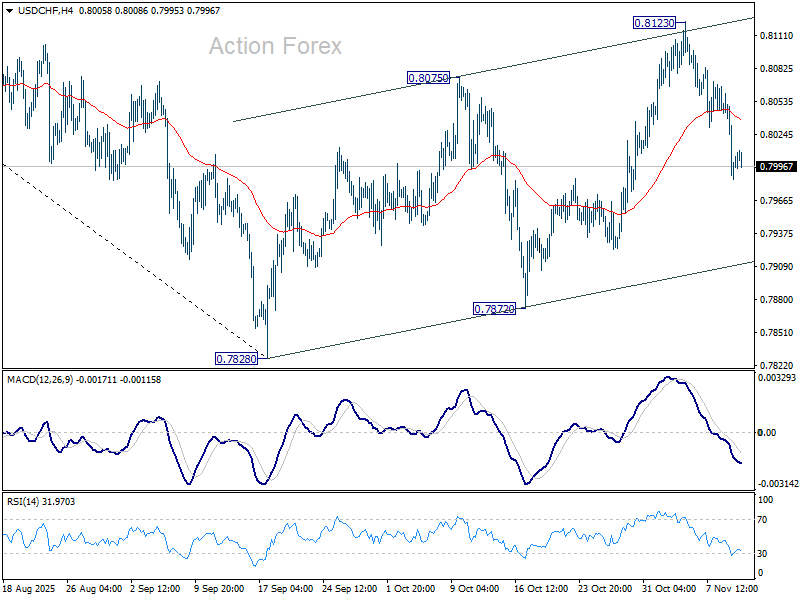
Daily Pivots: (S1) 0.7972; (P) 0.8020; (R1) 0.8053; More…
Intraday bias in USD/CHF remains on the downside for the moment. Corrective rebound from 0.7828 should have completed with three waves up to 0.8123. Deeper fall should be seen to 0.7872 support. Firm break there will argue that larger down trend is ready to resume through 0.7828 low. For now, risk will stay on the downside as long as 0.8123 resistance holds, in case of recovery.
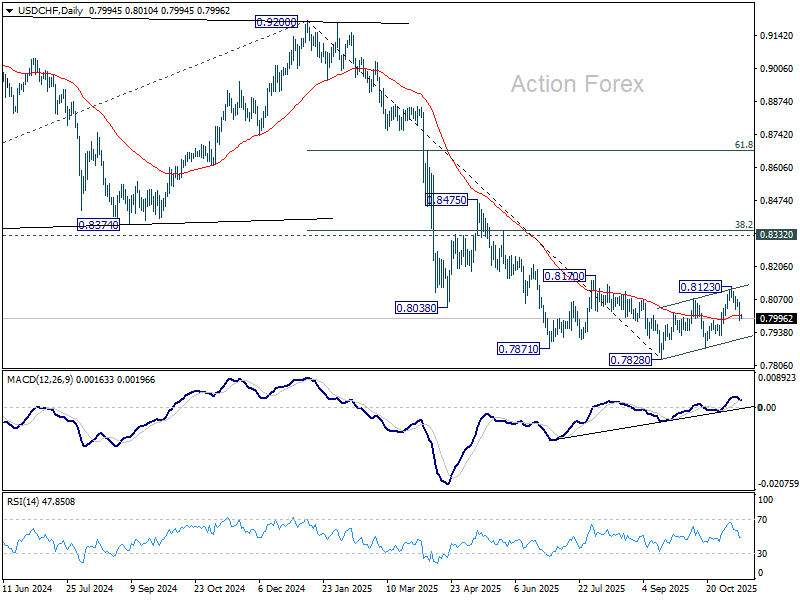
In the bigger picture, long term down trend from 1.0342 (2017 high) is still in progress. Next target is 100% projection of 1.0146 (2022 high) to 0.8332 from 0.9200 at 0.7382. In any case, outlook will stay bearish as long as 0.8332 support turned resistance holds (2023 low).
AUD/USD Daily Report
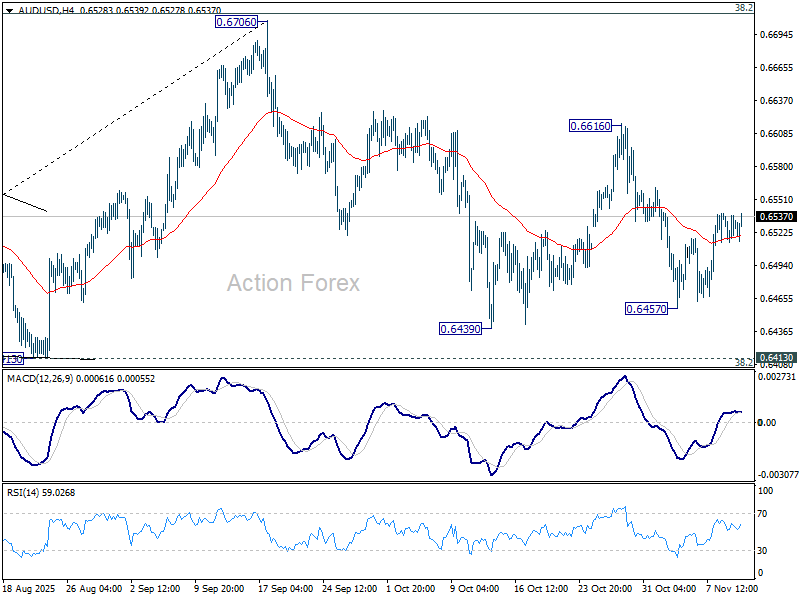
Daily Pivots: (S1) 0.6515; (P) 0.6527; (R1) 0.6538; More...
Intraday bias in AUD/USD remains neutral for the moment. On the downside, break of 0.6457 will target 0.6413 cluster (38.2% retracement of 0.5913 to 0.6706 at 0.6403). Decisive break there will carry larger bearish implications. On the upside, break of 0.6616 will bring retest of 0.6706 high instead.
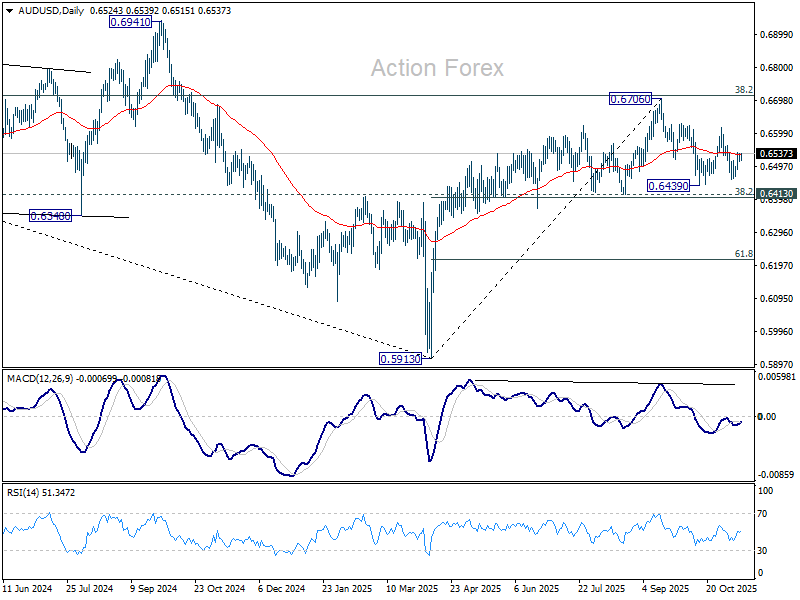
In the bigger picture, there is no clear sign that down trend from 0.8006 (2021 high) has completed. Rebound from 0.5913 is seen as a corrective move. Outlook will remain bearish as long as 38.2% retracement of 0.8006 to 0.5913 at 0.6713 holds. Break of 0.6413 support will suggest rejection by 0.6713 and solidify this bearish case. Nevertheless, considering bullish convergence condition in W MACD, sustained break of 0.6713 will be a strong sign of bullish trend reversal, and pave the way to 0.6941 structural resistance for confirmation.
USD/CAD Daily Outlook
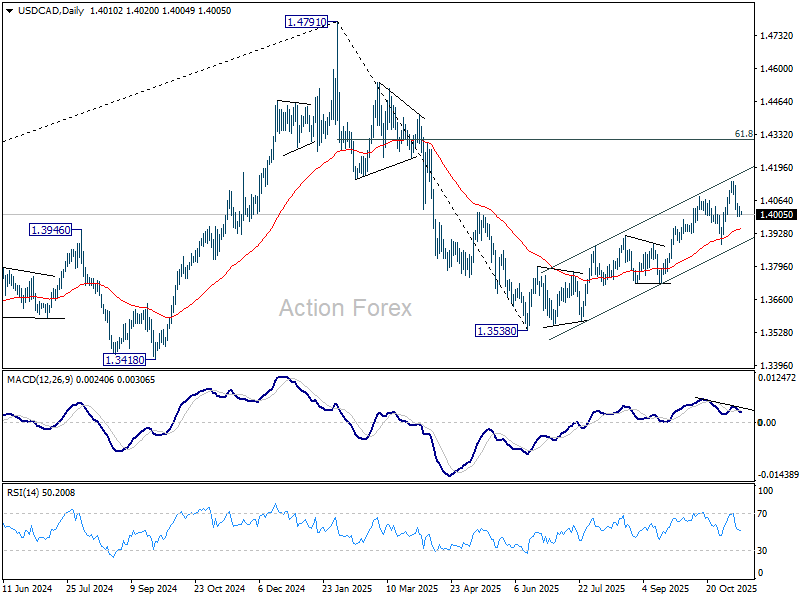
Daily Pivots: (S1) 1.4001; (P) 1.4021; (R1) 1.4040; More...
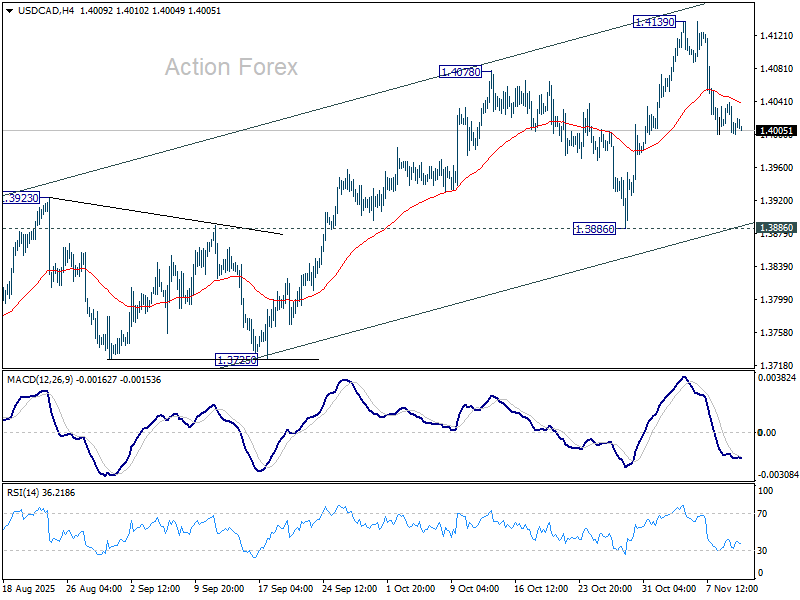
In the bigger picture, price actions from 1.4791 medium term top is likely just unfolding as a correction to up trend from 1.2005 (2021 low), with rise from 1.3538 as the second leg. A third leg should follow before up trend resumption. That is, range trading is set to extend for the medium term. For now, this will remain the favored case as long as 1.3886 support holds. However, firm break of 1.3886 will revive the case that fall from 1.4791 is indeed a larger scale correction.
EUR/CHF Daily Outlook
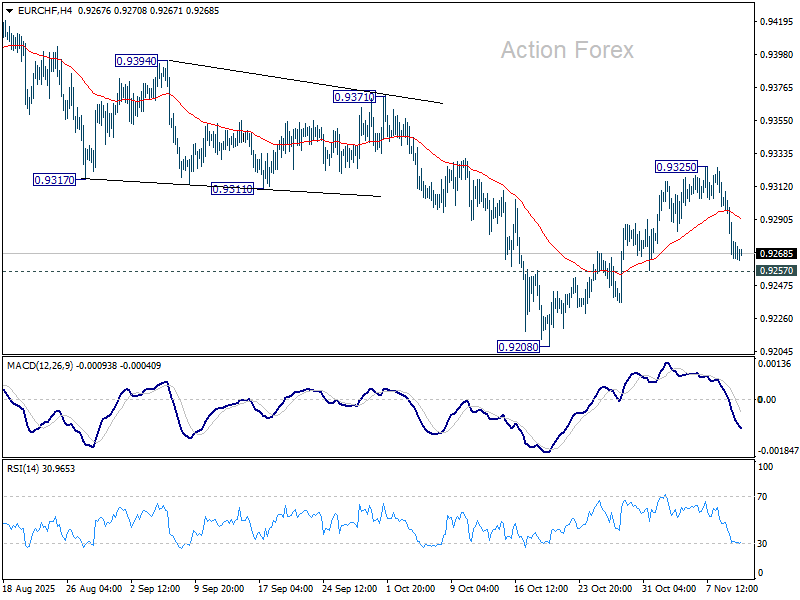
Daily Pivots: (S1) 0.9252; (P) 0.9287; (R1) 0.9309; More....
Intraday bias in EUR/CHF remains neutral at this point. On the downside, break of 0.9257 support will indicate that rebound from 0.9208 has completed as a corrective move. Deeper fall should be seen to retest 0.9204/8 support zone. Decisive break there will confirm larger down trend resumption. On the upside, break of 0.9325 will resume the rebound from 0.9208.
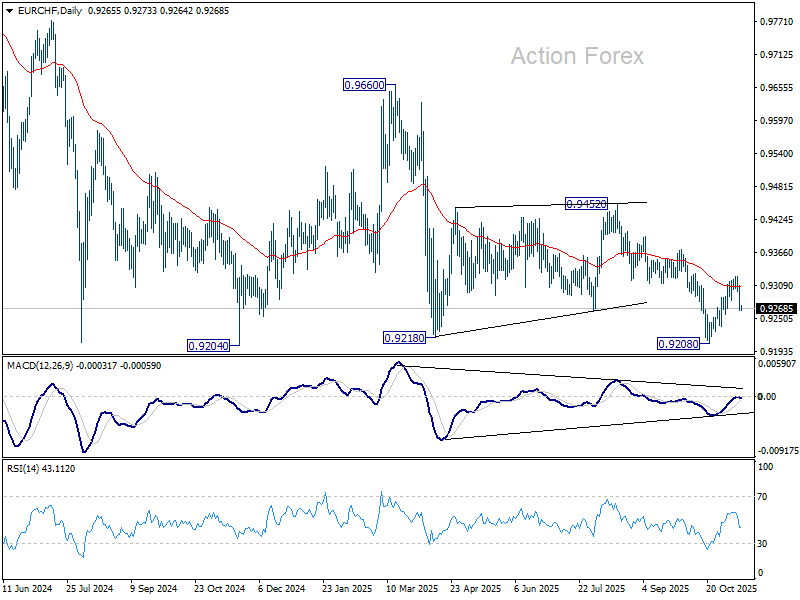
In the bigger picture, outlook remains bearish with EUR/CHF staying well inside long term falling channel after multiple rejection by 55 W EMA (now at 0.9383). Firm break of 0.9204 will resume the whole down trend from 1.2004 (2018 high). Next target is 61.8% projection of 1.1149 to 0.9407 from 0.9928 at 0.8851. However, break of 0.9452 resistance will now be the first sign of medium term bottoming.
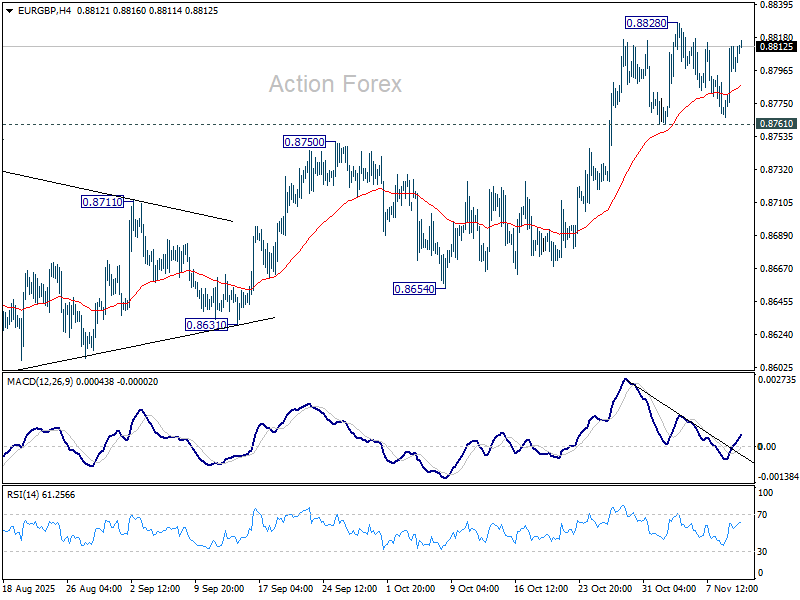
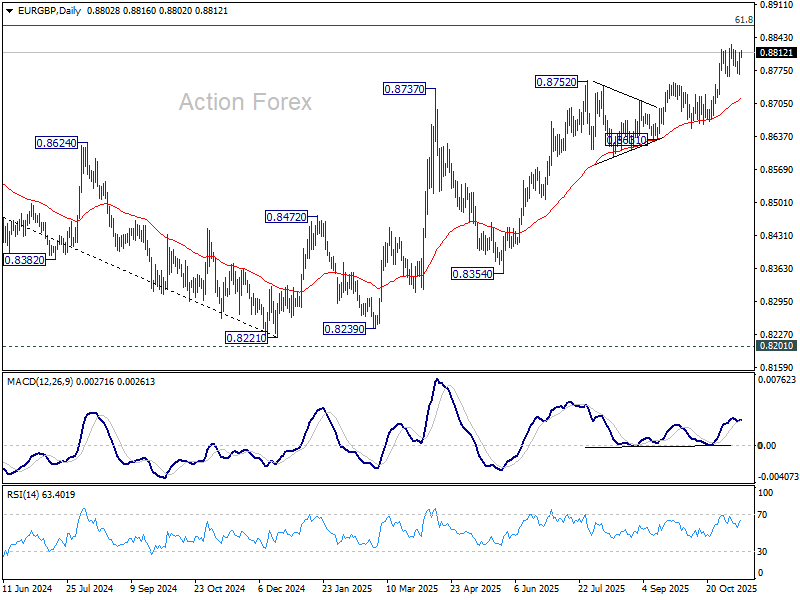
EUR/GBP Daily Outlook
Daily Pivots: (S1) 0.8779; (P) 0.8796; (R1) 0.8824; More…
Range trading continues in EUR/GBP and intraday bias stays neutral. Further rally is expected as long as 0.8761 support holds. On the upside, break of 0.8828 will resume the whole rise from 0.8221 and target 0.8867 fibonacci level. Firm break there will carry larger bullish implications. However, considering bearish divergence condition in 4H MACD, decisive break of 0.8761 will confirm short term topping, and bring deeper fall to 55 D EMA (now at 0.8717).
In the bigger picture, rise from 0.8221 medium term bottom is still seen as a corrective move. Upside should be limited by 61.8% retracement of 0.9267 to 0.8221 at 0.8867. Firm break of 0.8654 support will be the first sign that this corrective bounce has completed. However, decisive break of 0.8867 will suggest that EUR/GBP is already reversing whole decline from 0.9267 (2022 high).
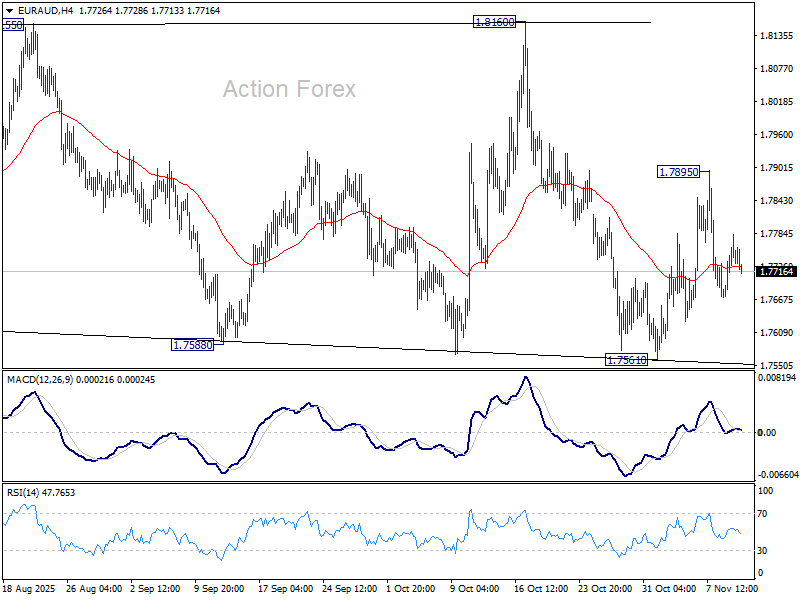
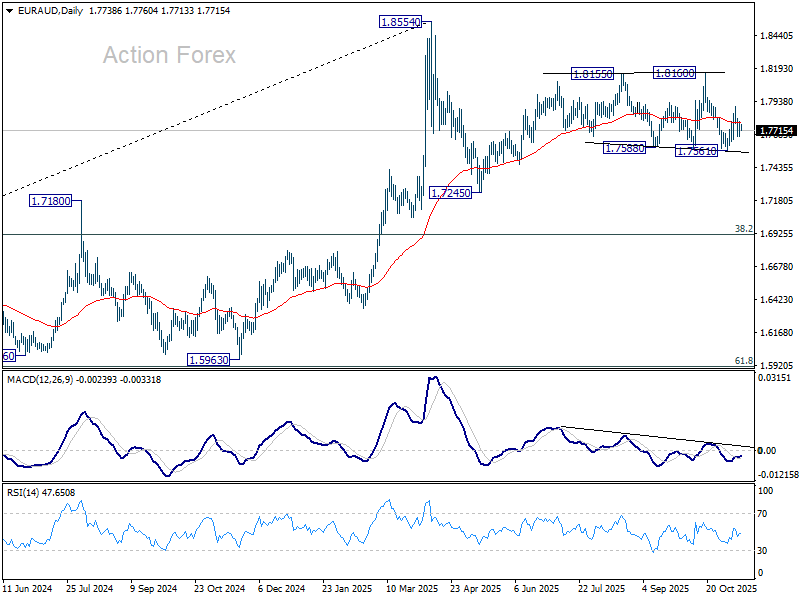
EUR/AUD Daily Outlook
Daily Pivots: (S1) 1.7687; (P) 1.7736; (R1) 1.7793; More...
Intraday bias in EUR/AUD stays neutral for the moment, and outlook is unchanged. On the downside, break of 1.7561 support will revive the bearish case that corrective pattern from 1.8554 is in the third leg, and target 1.7245 support. On the upside, though, above 1.7895 will resume the rebound from 1.7561 to 1.8160 resistance next.
In the bigger picture, price actions from 1.8554 medium term top are seen as a corrective pattern. Sustained break of 55 W EMA (now at 1.7424) will suggest that it's correcting the whole rally from 1.4281 (2022 low). In this case, deeper decline would be seen to 38.2% retracement of 1.4281 to 1.8554 at 1.6922. Nevertheless, strong rebound form 55 W EMA will likely bring resumption of the up trend sooner.
GBP/JPY Daily Outlook
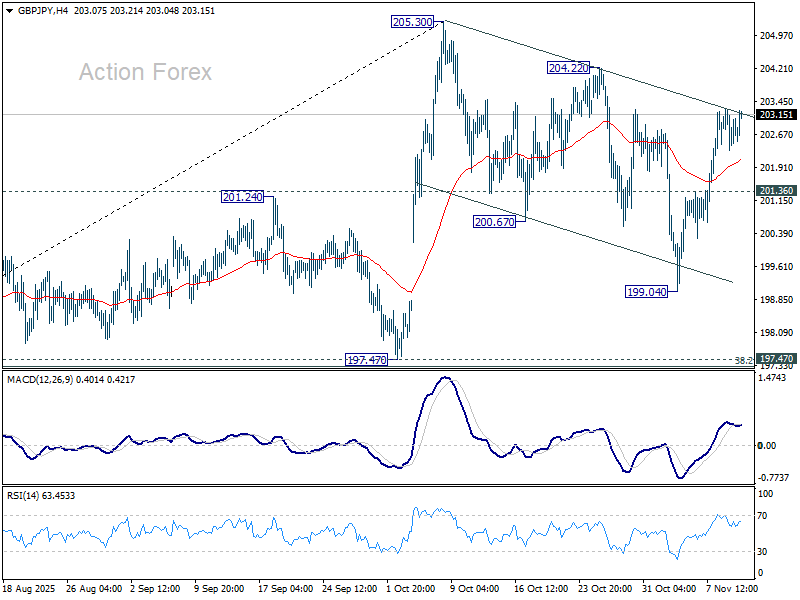
Daily Pivots: (S1) 202.21; (P) 202.72; (R1) 203.63; More...
No change in GBP/JPY's outlook and intraday bias remains neutral. On the upside, break of 204.22 resistance should confirm that correction from 205.30 has completed with three waves at 199.04. Further rise should be seen through 205.30 to resume the larger rally from 184.53. On the downside, below 201.36 minor support will turn bias to the downside to 199.04 and below to extend the correction.
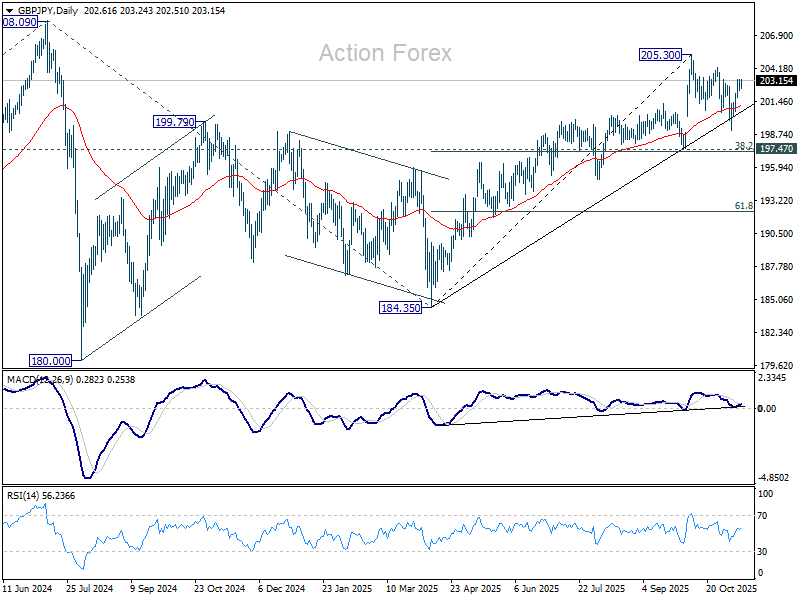
In the bigger picture, price actions from 208.09 (2024 high) are seen as a corrective pattern which might have completed at 184.35. Firm break of 208.09 high will resume the up trend from 123.94 (2020 low). Next target is 61.8% projection of 148.93 to 208.09 from 184.35 at 220.90. However, decisive break of 197.47 support will dampen this view and extend the corrective pattern with another fall.
EUR/JPY Daily Outlook
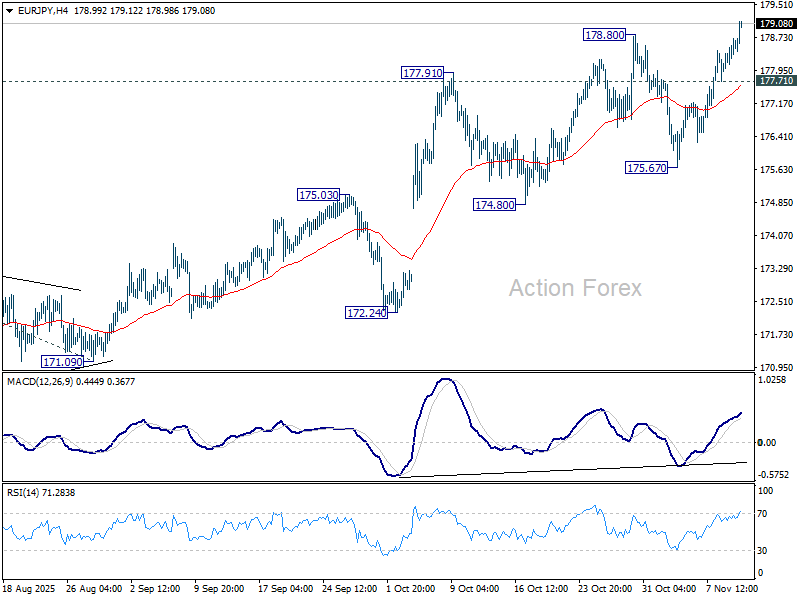
Daily Pivots: (S1) 178.11; (P) 178.43; (R1) 178.87; More...
EUR/JPY's up trend resumed by breaking through 178.80 resistance and intraday bias is now on the upside. Next target is 100% projection of 161.06 to 173.87 from 171.09 at 183.90. On the downside, below 177.71 minor support will turn intraday bias neutral and bring consolidations. But outlook will stay bullish as long as 175.67 support holds, in case of retreat.
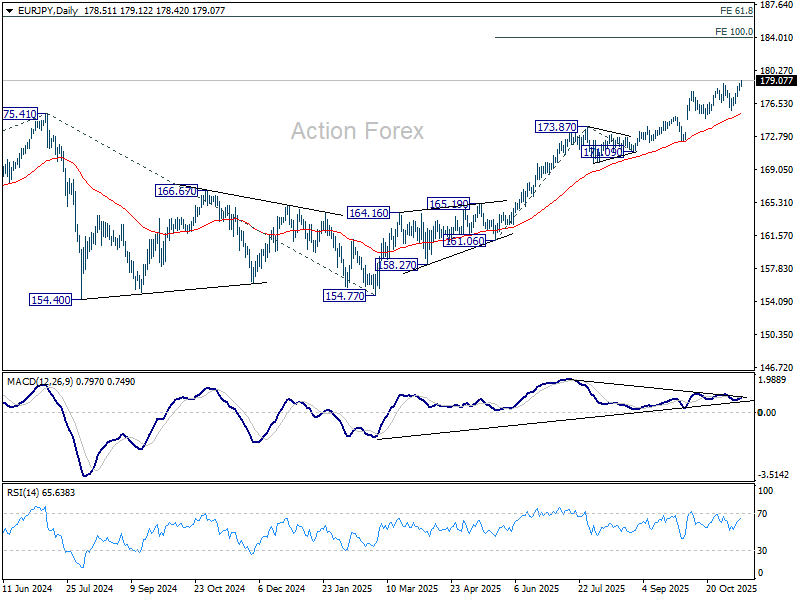
In the bigger picture, up trend from 114.42 (2020 low) is in progress and should target 61.8% projection of 124.37 to 175.41 from 154.77 at 186.31. Outlook will continue to stay bullish as long as 55 W EMA (now at 168.56) holds, even in case of deep pullback.
Yen Falls as Takaichi Urges BoJ to Hold Fire; U.S. Fiscal Vote in Focus
Yen extended its broad decline in Asian session as Japanese Prime Minister Sanae Takaichi doubled down on her call for the BoJ to delay further rate hikes. Addressing parliament, Takaichi said consumer prices—up around 3%—are being lifted mainly by food costs, particularly rice, rather than by wage growth or strong demand. She described the current trend as “not good” for households or the broader economy.
Takaichi said such price increases “hurt people’s livelihood and could weigh on the economy,” warning that Japan still faces the risk of returning to deflation if households pull back on spending. Deflation, she cautioned, would damage corporate profits and undermine wage-setting behavior, reversing the progress made since the BoJ’s ultra-loose policy began to unwind. “This is a matter that affects monetary policy in a big way,” she added, pledging close coordination with the BoJ—a signal many traders took as further confirmation that rate hikes are politically discouraged for now.
The remarks extend a theme of political caution surrounding the BoJ’s normalization efforts. While several policymakers, including dissenting board members, have pushed for tightening to resume soon, the message from Tokyo suggests that Governor Kazuo Ueda will face significant pressure to hold off at the next meeting. The dovish overhang has driven fresh weakness in the Yen, which continues to underperform against all major peers this week.
Elsewhere, attention is turning to Washington, where the Republican-controlled House of Representatives is set to vote later today on a compromise bill to restore government funding and end the historic 42-day shutdown. The Senate approved the deal on Monday, and House Speaker Mike Johnson expressed confidence that it will clear his chamber. The bill would reopen shuttered federal departments and extend funding through January 30.
Equity sentiment, however, turned mixed. Technology stocks lagged after SoftBank confirmed plans to sell its stake in Nvidia to fund its own AI investments, dragging semiconductor shares lower and trimming early gains on Wall Street futures. The move came amid broader caution as investors awaited the House vote.
In the currency markets, Yen remains the weakest performer so far this week, followed by Sterling and Dollar. At the top end, Swiss Franc leads the pack, buoyed by optimism over a potential U.S.–Swiss tariff deal. Aussie and Kiwi also gained ground on improving risk appetite, while Loonie and Euro are trading in mid-range positions.
In Asia, at the time of writing, Nikkei is up 0.24%. Hong Kong HSI is up 0.60%. China Shanghai SSE is down -0.23%. Singapore Strait Times is up 0.34%. Japan 10-year JGB yield is down -0.006 at 1.690. Overnight, DOW rose 1.18%. S&P 500 rose 0.21%. NASDAQ fell -0.25%. 10-year yield rose 0.010 to 4.120.
RBA’s Jones warns on geopolitical risk underpricing, notes Gold shift
RBA Assistant Governor Brad Jones cautioned that global markets may be underestimating geopolitical risks and systemic fragmentation. At a conference today, he highlighted that risk premiums across major asset classes have fallen to “concerning lows,” suggesting investors are failing to fully price in potential shocks.
“We’re just surprised that there’s not a bit more reflected in spreads given what we observe,” Jones said, pointing to what he called “a confronting set of potential risks.”
Jones also drew attention to shifting dynamics in global reserve management, noting “emerging evidence of fragmentation” in how central banks allocate their assets. He said a distinct group of countries has driven the recent surge in official Gold holdings, reflecting a growing desire to diversify away from dollar- and euro-denominated assets amid heightened concerns about "risk of asset seizure sanctions".
FTSE pushes toward 10k, GBP/CHF vulnerable, next hinges on UK GDP
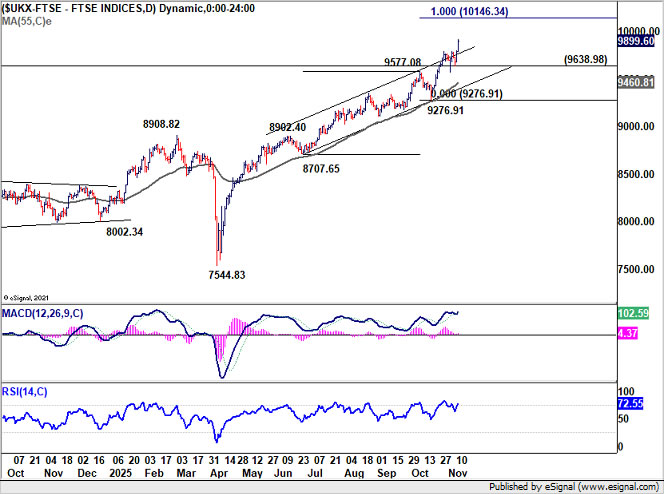
Markets are increasingly convinced the BoE will deliver a rate cut next month, after weak labour data showed the UK economy is losing traction. The shift in sentiment has sent the FTSE 100 powering to fresh record highs, with 10,000 level now within reach. Sterling has come under broad pressure, particularly against its European peers. The labor market’s deterioration—rising unemployment, slower pay growth, and growing slack—suggests more weakness than the MPC’s November forecast assumed.
Attention now turns to Thursday’s Q3 GDP report, expected to show a modest 0.2% qoq expansion and stagnation in September. Such subdued momentum could persist into next year, reinforcing calls for the BoE to resume its gradual easing cycle. The Bank is seen returning to a quarterly cut rhythm, delayed only by uncertainty surrounding last week’s Autumn Budget. A weaker-than-expected GDP print would likely fuel talk of a deeper, more sustained rate-cut trajectory into 2026.
In markets, FTSE’s decisive break above its recent channel signals strong bullish acceleration. Near term outlook will stay bullish as long as 9638.98 support holds. Further rise should be seen through 10k psychological level at 100% projection of 8707.65 to 9577.08 from 9276.91 at 10146.34.
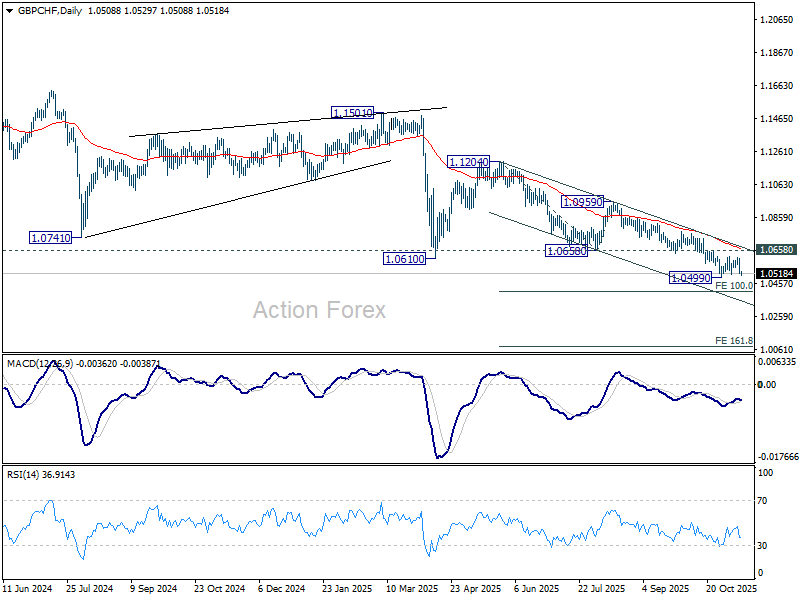
GBP/CHF is still bounded in range above 1.0499 support despite yesterday's dip. Yet, outlook remains bearish with 1.0658 support turned resistance intact. Firm break of 1.0499 will resume the larger down trend to 100% projection of 1.1204 to 1.0658 from 1.0959 at 1.0413.
EUR/JPY Daily Outlook
Daily Pivots: (S1) 178.11; (P) 178.43; (R1) 178.87; More...
EUR/JPY's up trend resumed by breaking through 178.80 resistance and intraday bias is now on the upside. Next target is 100% projection of 161.06 to 173.87 from 171.09 at 183.90. On the downside, below 177.71 minor support will turn intraday bias neutral and bring consolidations. But outlook will stay bullish as long as 175.67 support holds, in case of retreat.
In the bigger picture, up trend from 114.42 (2020 low) is in progress and should target 61.8% projection of 124.37 to 175.41 from 154.77 at 186.31. Outlook will continue to stay bullish as long as 55 W EMA (now at 168.56) holds, even in case of deep pullback.
FTSE pushes toward 10k, GBP/CHF vulnerable, next hinges on UK GDP
Markets are increasingly convinced the BoE will deliver a rate cut next month, after weak labour data showed the UK economy is losing traction. The shift in sentiment has sent the FTSE 100 powering to fresh record highs, with 10,000 level now within reach. Sterling has come under broad pressure, particularly against its European peers. The labor market’s deterioration—rising unemployment, slower pay growth, and growing slack—suggests more weakness than the MPC’s November forecast assumed.
Attention now turns to Thursday’s Q3 GDP report, expected to show a modest 0.2% qoq expansion and stagnation in September. Such subdued momentum could persist into next year, reinforcing calls for the BoE to resume its gradual easing cycle. The Bank is seen returning to a quarterly cut rhythm, delayed only by uncertainty surrounding last week’s Autumn Budget. A weaker-than-expected GDP print would likely fuel talk of a deeper, more sustained rate-cut trajectory into 2026.
In markets, FTSE’s decisive break above its recent channel signals strong bullish acceleration. Near term outlook will stay bullish as long as 9638.98 support holds. Further rise should be seen through 10k psychological level at 100% projection of 8707.65 to 9577.08 from 9276.91 at 10146.34.
GBP/CHF is still bounded in range above 1.0499 support despite yesterday's dip. Yet, outlook remains bearish with 1.0658 support turned resistance intact. Firm break of 1.0499 will resume the larger down trend to 100% projection of 1.1204 to 1.0658 from 1.0959 at 1.0413.