Sample Category Title
BoJ’s Ueda highlights tight job market, resilient consumption
BoJ Governor Kazuo Ueda told parliament today that Japan’s inflation is gradually aligning with the central bank’s 2% goal, supported by improving wages and steady domestic demand. He reiterated the BoJ aims for moderate inflation accompanied by rising incomes and economic improvement, rather than price gains driven solely by import costs or temporary shocks.
Ueda noted that while demand for food and other non-durable goods has softened, household consumption remains resilient thanks to higher incomes and a tight labor market. He highlighted that stronger wage growth is helping sustain a moderate cycle of rising prices and pay—an essential precondition for durable inflation in the BoJ’s framework.
He added that underlying inflation—stripping out volatile components—is gradually accelerating toward the 2% target, driven not only by food but also by price increases across a broader range of goods and services.
"When we look at underlying inflation that strips away temporary factors, it is gradually accelerating toward our 2% target," he said.
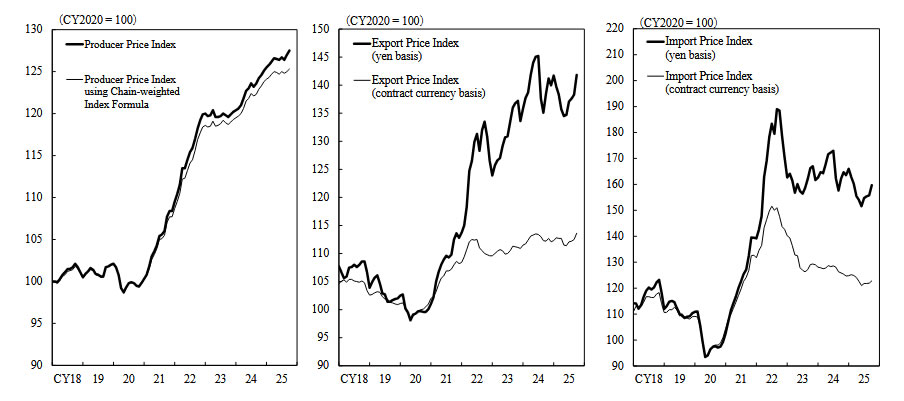
Japan CGPI rises 2.7% yoy in October, weak yen fails to lift import prices
Japan’s Corporate Goods Price Index rose 2.7% yoy in October, easing slightly from 2.8% in September but exceeding expectations of 2.5%, according to Bank of Japan data.
Notably, the Yen-based import price index fell -1.5% from a year earlier, marking its ninth straight month of decline. The persistent drop indicates that the weak Yen is not translating into renewed cost-push inflation—contradicting the typical currency-inflation link.
Bitcoin BTCUSD Elliott Wave Analysis : Forecasting Decline After 3-Wave Recovery
Hello traders. In this technical article we’re going to look at the Elliott Wave charts of Bitcoin BTCUSD published in members area of the website. BTCUSD has recently given us a 3 waves recovery that found sellers as expected. In this discussion, we’ll break down the Elliott Wave forecast and present the target area.
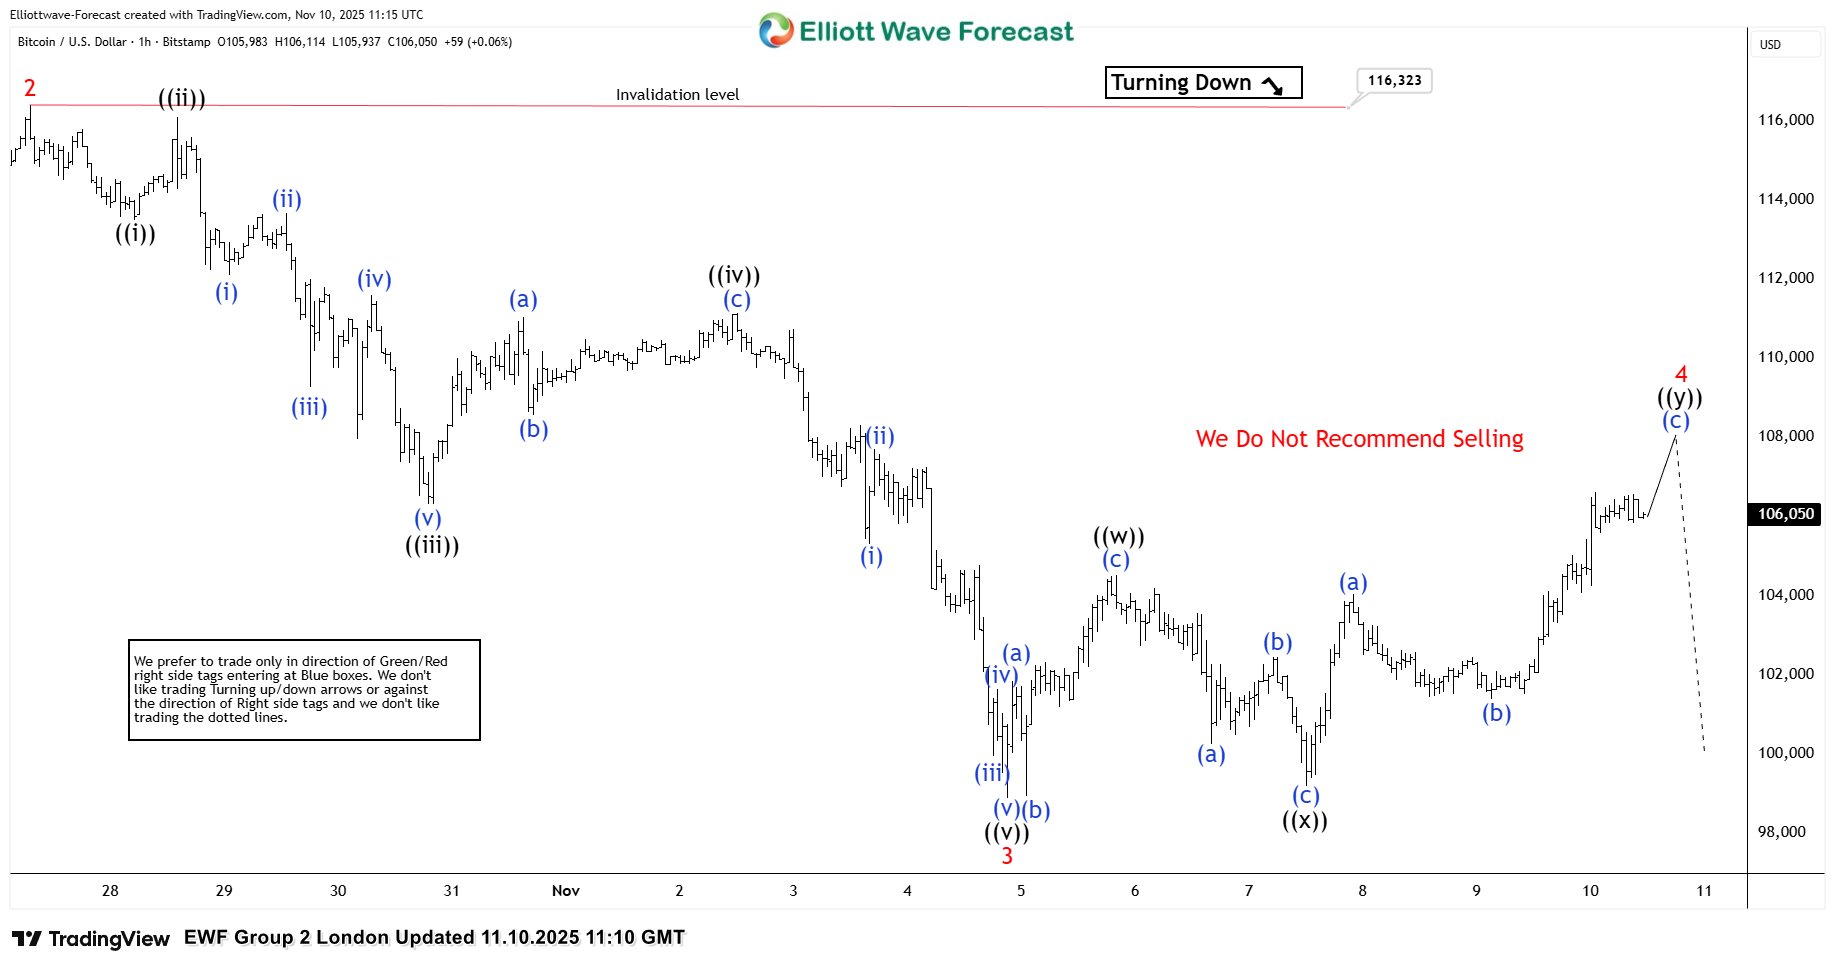
BTCUSD Elliott Wave 1 Hour Chart 11.10.2025
BTCUSD ended a 5-wave decline in the cycle from the 116.323 peak. Currently, the crypto is showing a recovery against that peak — wave 4 red. As our members know, we determine the potential ending point of a correction by measuring the equal legs area. In this case, we measure the 1.00–1.618 Fibonacci extension of waves ((w))–((x)). The reversal area (sellers’ zone) comes at 104.942–108.471. The price is already within the sellers’ zone, and we anticipate another leg down from this area or at least a 3-wave pullback.
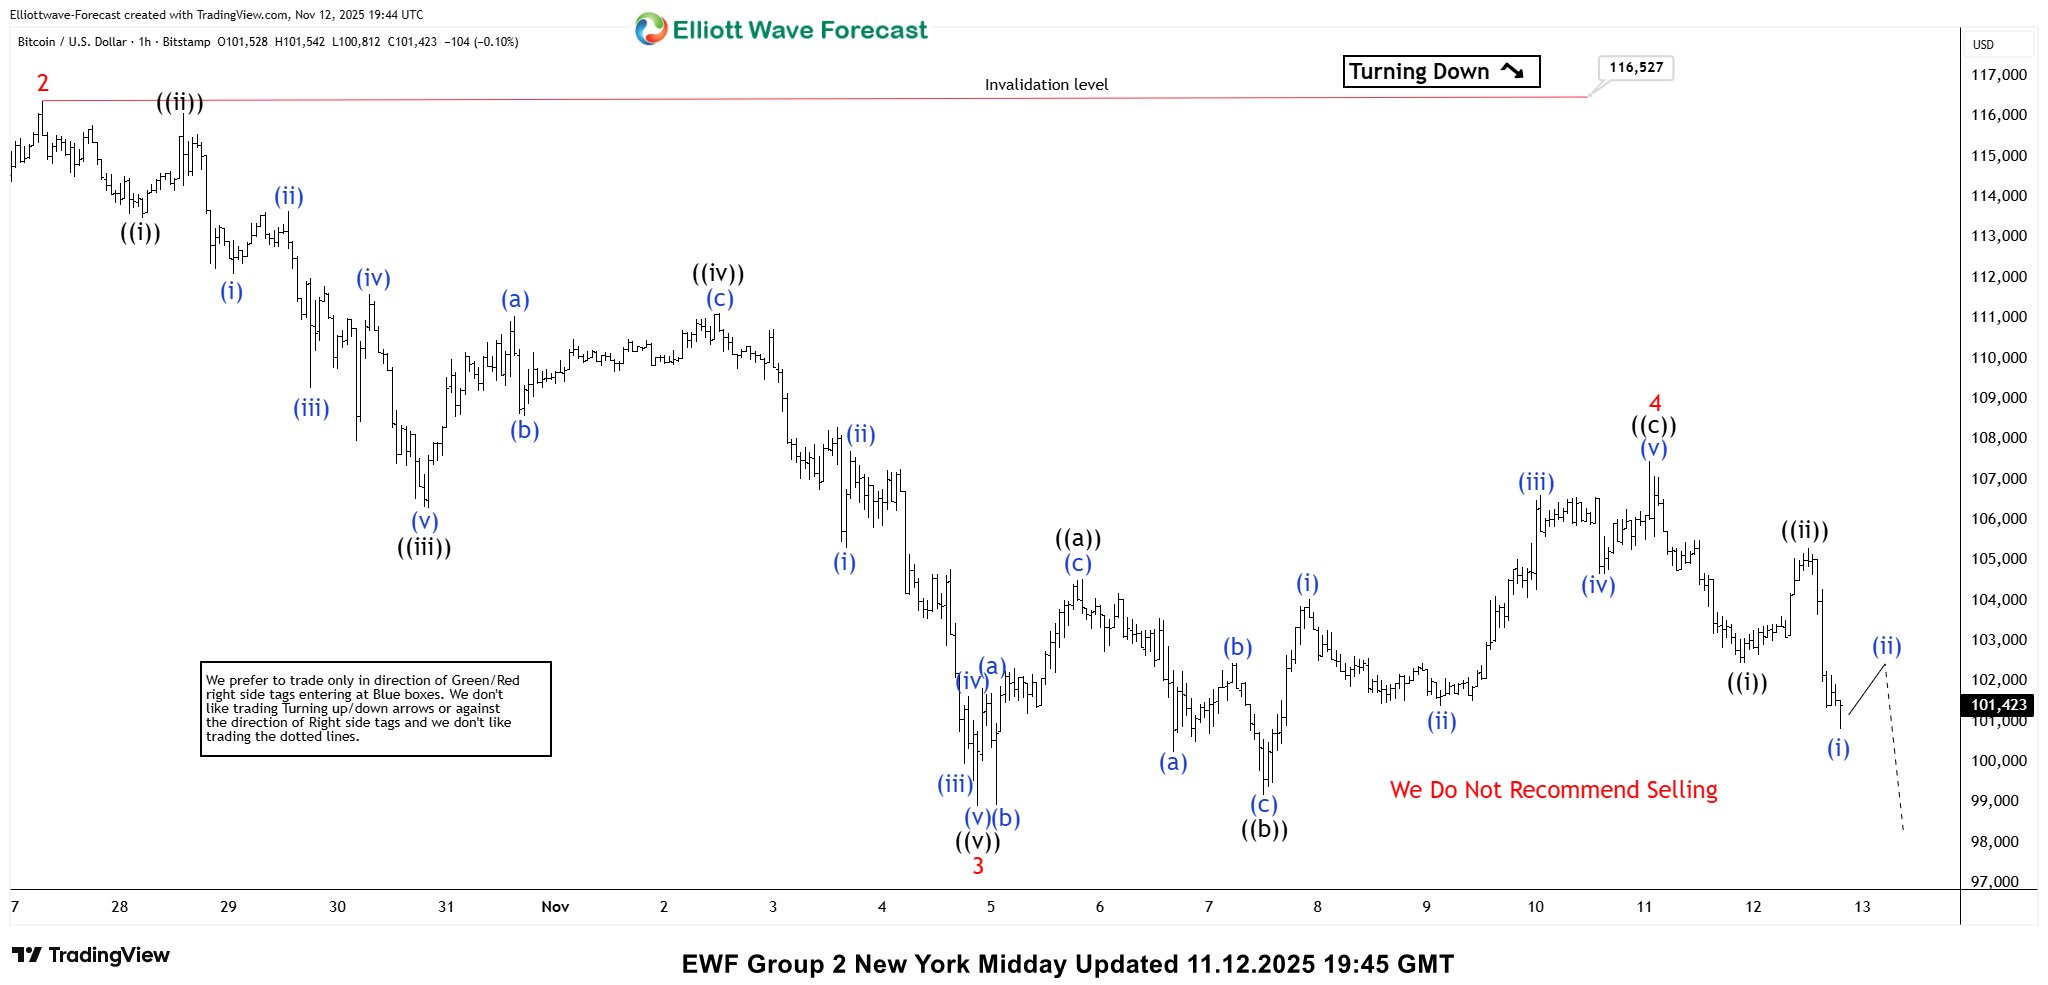
BTCUSD Elliott Wave 1 Hour Chart 11.12.2025
The crypto ended wave 4 within the mentioned area, and we got a decent decline as expected. Ideally, the price should break below the previous low – wave 3 red – to confirm that wave 5 is in progress toward the 96,962–93,704 area. Keep in mind, we don’t recommend selling Bitcoin. The overall trend remains bullish according to higher time frames, and we will treat any pullback as a potential buying opportunity. For trading setups, please follow our Live Trading Room.
WTI Oil Dives 4%: Black Gold Freefalls After OPEC Report – Outlook
After yesterday’s 1.7% rally, many participants believed that the bottom was finally in for Oil—and for good reason.
Exxon (XOM) shares surged to 2025 highs, while a series of headlines about India and other major buyers of Russian oil reinforced strong fundamentals to the fakeout.
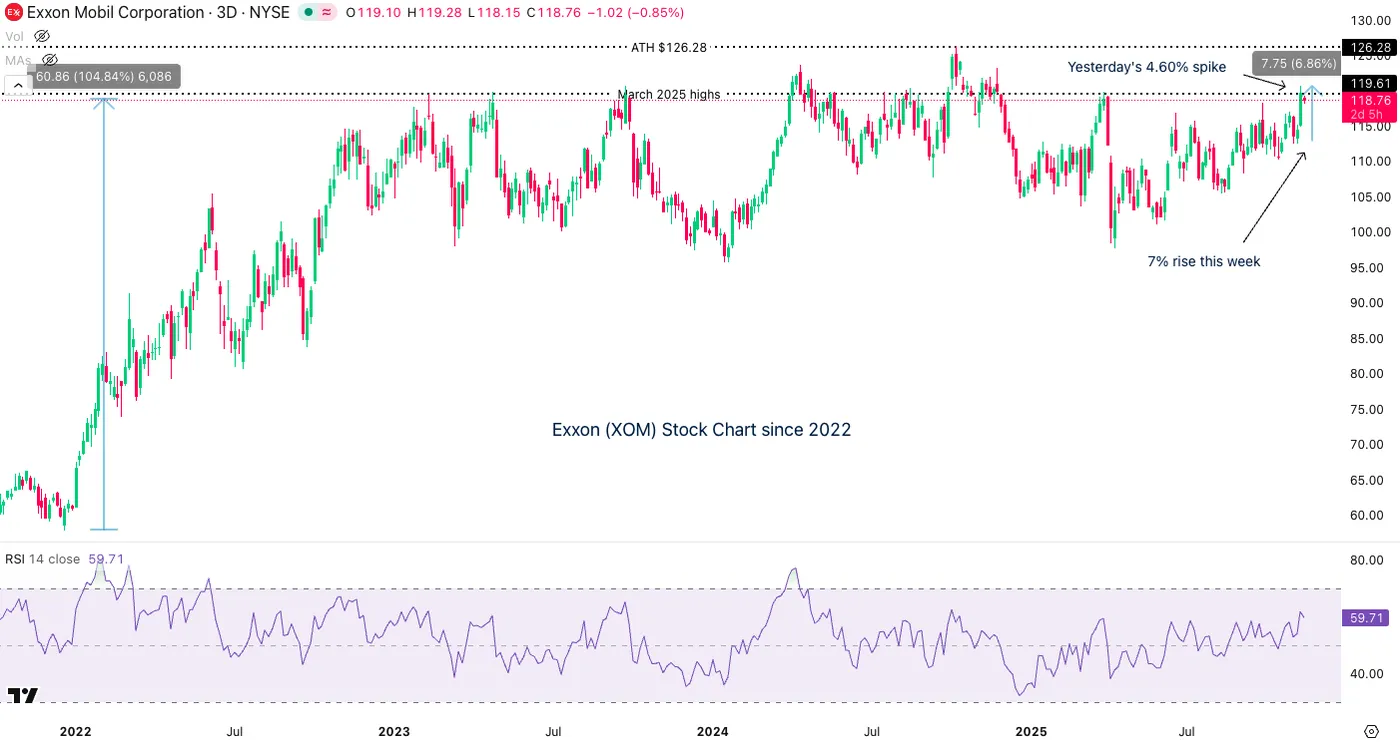
Exxon (XOM) 3-Day Chart, November 12, 2025 – Source: TradingView
But that would hardly fit this year’s pattern for Oil, which has preferred to zig-zag in a cloud of pricing confusion.
As discussed in last month’s Oil analysis, almost every price pop has been followed by a sharp correction, resulting in a rangebound-but-downtrending market.
The latest catalyst came from the Monthly OPEC report released this morning. It highlighted high US strategic reserves, sluggish Chinese growth, and persistent oversupply from nations funding their conflicts—such as Russia and Iran.
The report offers a mine (pun intended) of insightful charts and is worth even a quick glance – You can access it right here.
This dynamic may extend across the energy complex, as other commodities have stalled since the 2022 price spikes, plateauing through much of this year.
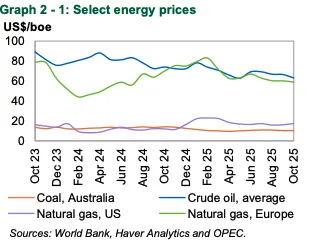
Trends in Energy Commodities throughout the year, November 12, 2025 – Source: OPEC
OPEC+’s internal rivalries only add to the pressure, with member states competing for market share while the major producers continue to flood the market amid elevated supply regimes.
Let's dive in our multi-timeframe analysis for WTI Oil.
US Oil multi-timeframe analysis
Daily Chart
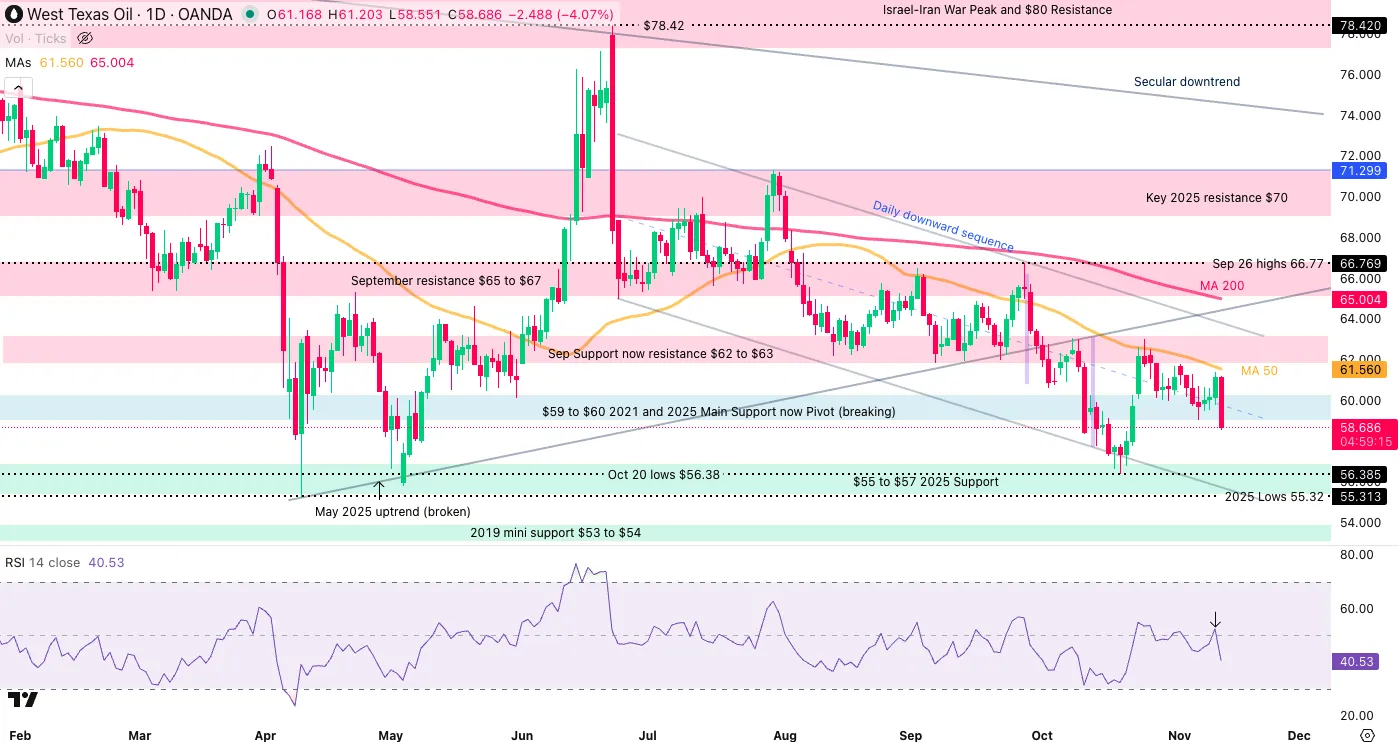
US Oil (WTI) Daily Chart, November 12, 2025 – Source: TradingView
Still evolving in a key downward channel, Oil has been contained by its 50-Day moving average throughout the past week and really stands out as the key technical indicator to watch.
Breaking below its $59 to $60 support yet again, there isn't much to restrain prices from re0-entering the 2025 low support region between $55 to $57.
The lows of the channel is a level to keep in mind at around $55.70 which would come very close to the Liberation Day lows.
As long as prices fail to break and close above the 50-Day MA, the downtrend has more probabilities to hold.
4H Chart and levels
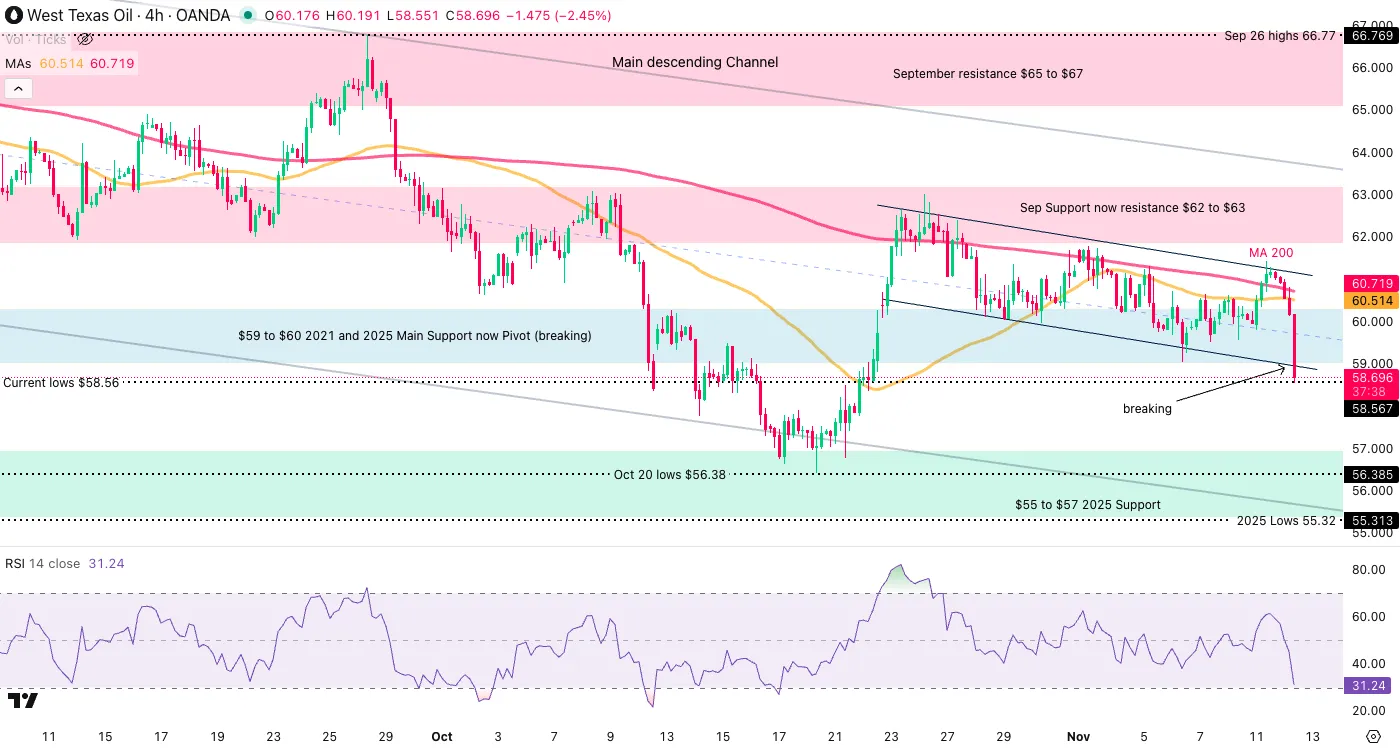
US Oil (WTI) 4H Chart, November 12, 2025 – Source: TradingView
Levels to place on your WTI charts:
Resistance Levels
- Key September Resistance $65 to $66
- Sep Support now resistance $62 to $63
- $61.50 50-Day MA
- $59 to $60 2021 Support now Pivot (breaking)
Support Levels
- $55 to $57 2025 Support
- Oct 20 lows $56.38
- $55.70 channel lows
- Current lows $58.56
1H Chart
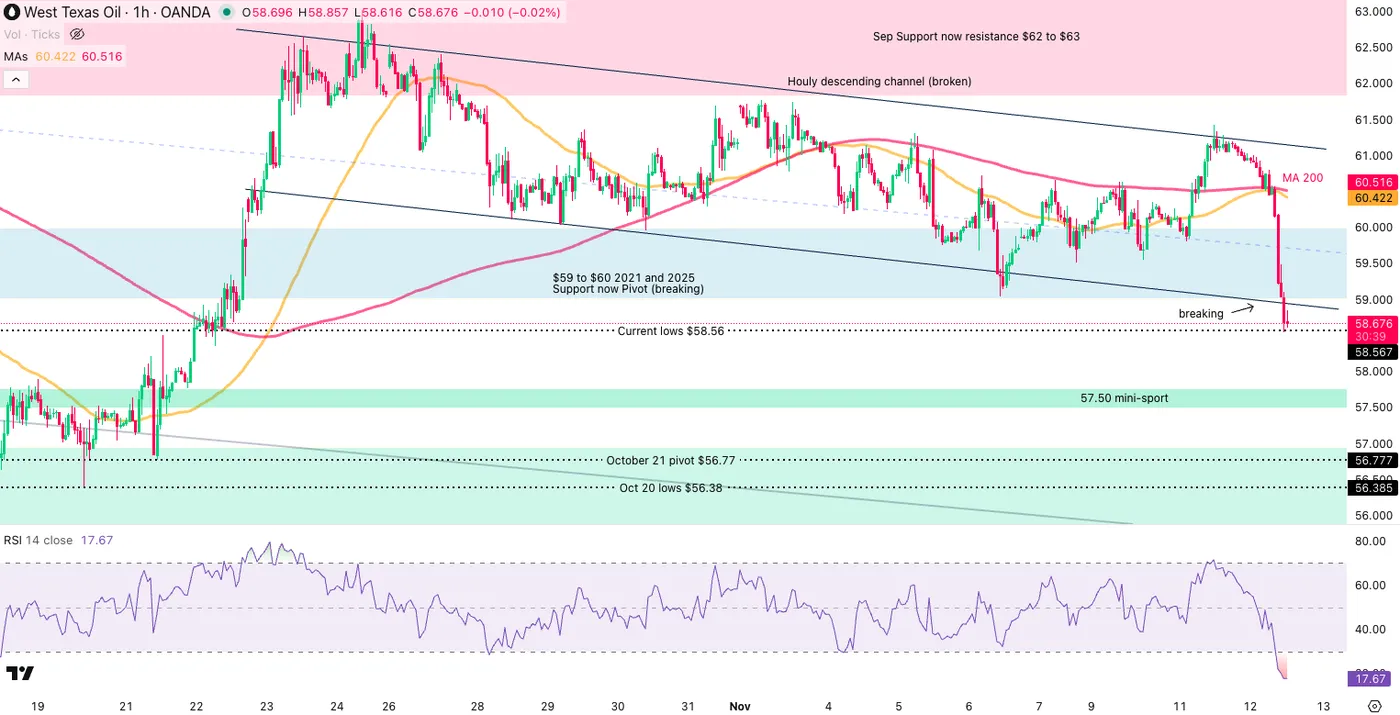
US Oil (WTI) 1H Chart, November 12, 2025 – Source: TradingView
The 1H picture shows one of bear dominance in this morning of price action which even led to the breakdown of this week's fresh Downward hourly channel.
Still, the 1H RSI is oversold, which is slowing the current fall.
A daily Close below hints at further downside, while a return within keeps a more balanced-bearish outlook.
Expect more volatility looking forward and keep an eye on geopolitical headlines.
Safe Trades!
USD/JPY Outlook as It Hits 155.00: PM Takaichi Drives the Pair to New Cycle Highs
When the USD/JPY was free-falling toward 146.00 before the election results, few traders could have imagined such a sharp reversal was about to unfold.
Appointed in early October as a replacement for the departed Prime Minister Ishiba, PM Sanae Takaichi immediately turned on the taps of massive economic support for the Japanese economy.
The issue for yen bulls is that the Bank of Japan was on track to normalize monetary policy—after two decades of ultra-loose conditions—amid a return of inflation.
That trajectory now faces resistance from a prime minister eager to influence the BoJ, saying she “strongly hopes the BOJ conducts policy appropriately” in a speech at the Japanese Parliament.
Such remarks often trigger strong market reactions, as traders progressively price a not-so-independent central bank and politic influences hurting a stable resolution of inflation – both not good for any currency.
As a result, USD/JPY has surged more than 800 pips (about 0.56%), now trading just below the 155.00 handle, a level that has already prompted verbal intervention from the Finance Minister, who condemned the yen’s rapid slide.
In any case, let’s dive into a multi-timeframe analysis of USD/JPY to identify where the pair could be heading next.
USD/JPY multi-timeframe analysis
Daily chart
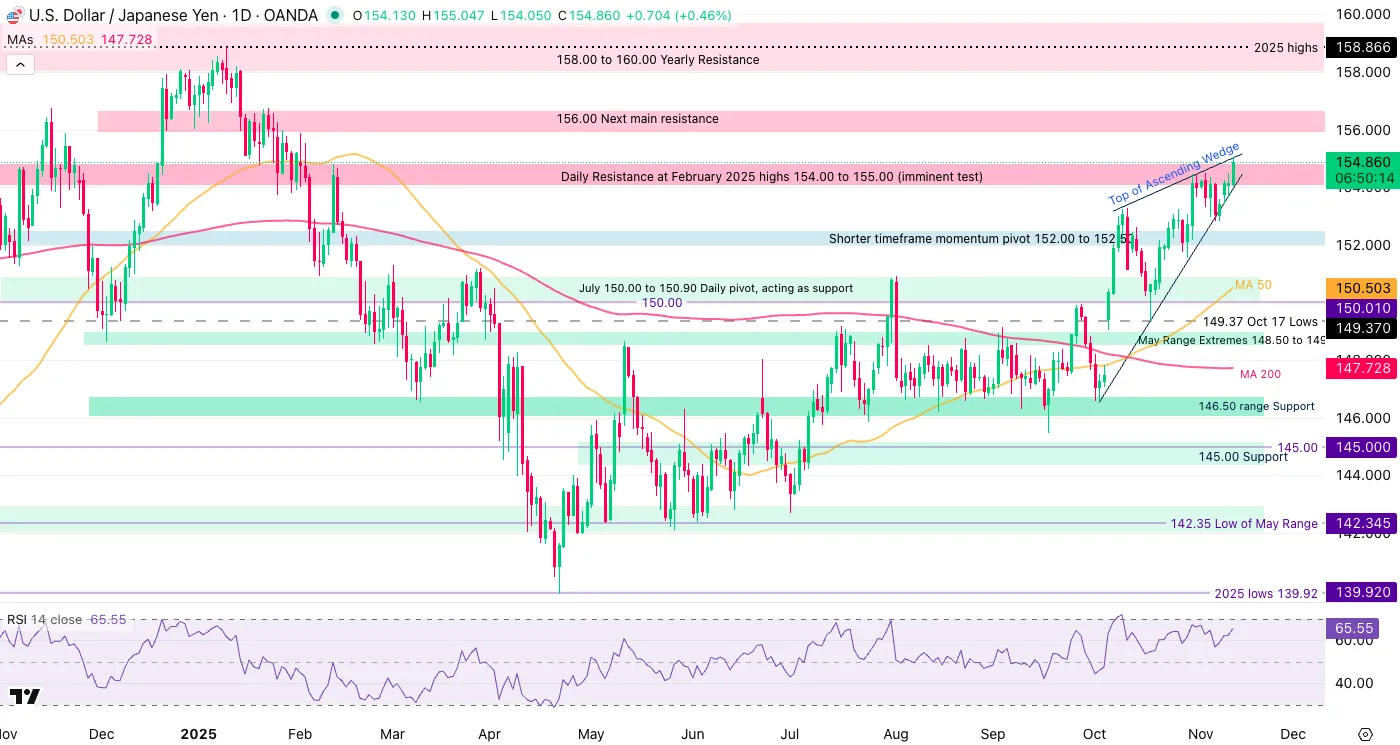
USD/JPY Daily Chart, November 12, 2025 – Source: TradingView
USD/JPY bulls launch a new offensive to break the 154.50 to 155.00 resistance which will act as a last barrier to a full-on breakout in the pair.
With the Bank of Japan still hesitant to pull the trigger on a hike, only a few technical barriers are stalling the move.
The 155.00 level is acting strong and will be a key point to monitor towards the session close:
- Expect large reactions if the pair closes above the level.
- Failing to close above will give more points for mean-reversion, with the market assuming that today's comments were priced in.
An ascending wedge is also largely in place which contains the price action for now but also gives another element to watch on breakout/rejection scnearios.
Let's take a closer look.
4H Chart and levels
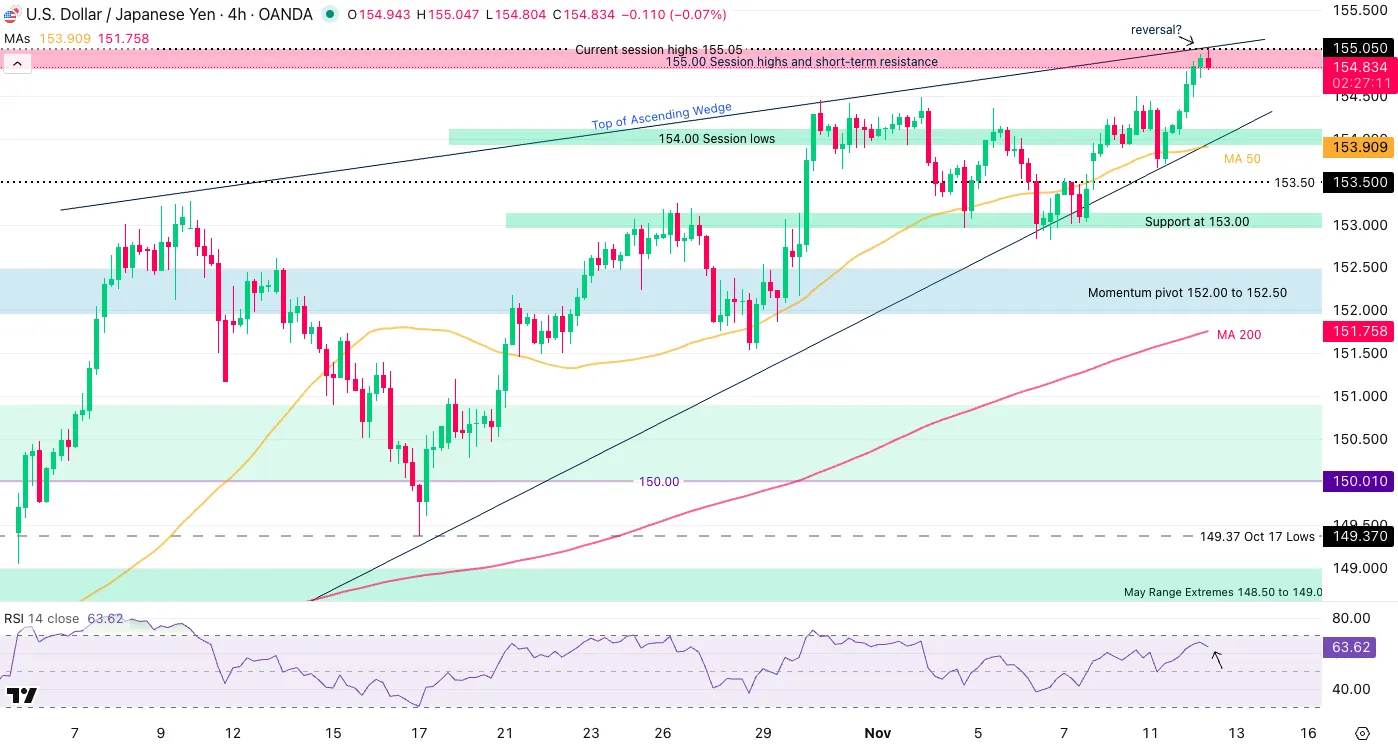
USD/JPY 4H Chart, November 12, 2025 – Source: TradingView
USD/JPY technical levels of interest:
Support Levels:
- Session lows and short-term support 154.050
- Short-term support 153.50
- Momentum pivot 152.00 to 152.50
- 151.50 Oct 28 rebound (minor support)
Resistance Levels:
- Session highs 155.047
- Daily Resistance at February 2025 highs 154.50 to 155.00 (imminent resistance)
- 156.00 to 156.70 Next main resistance
- 158.00 to 160.00 Yearly Resistance
1H Chart
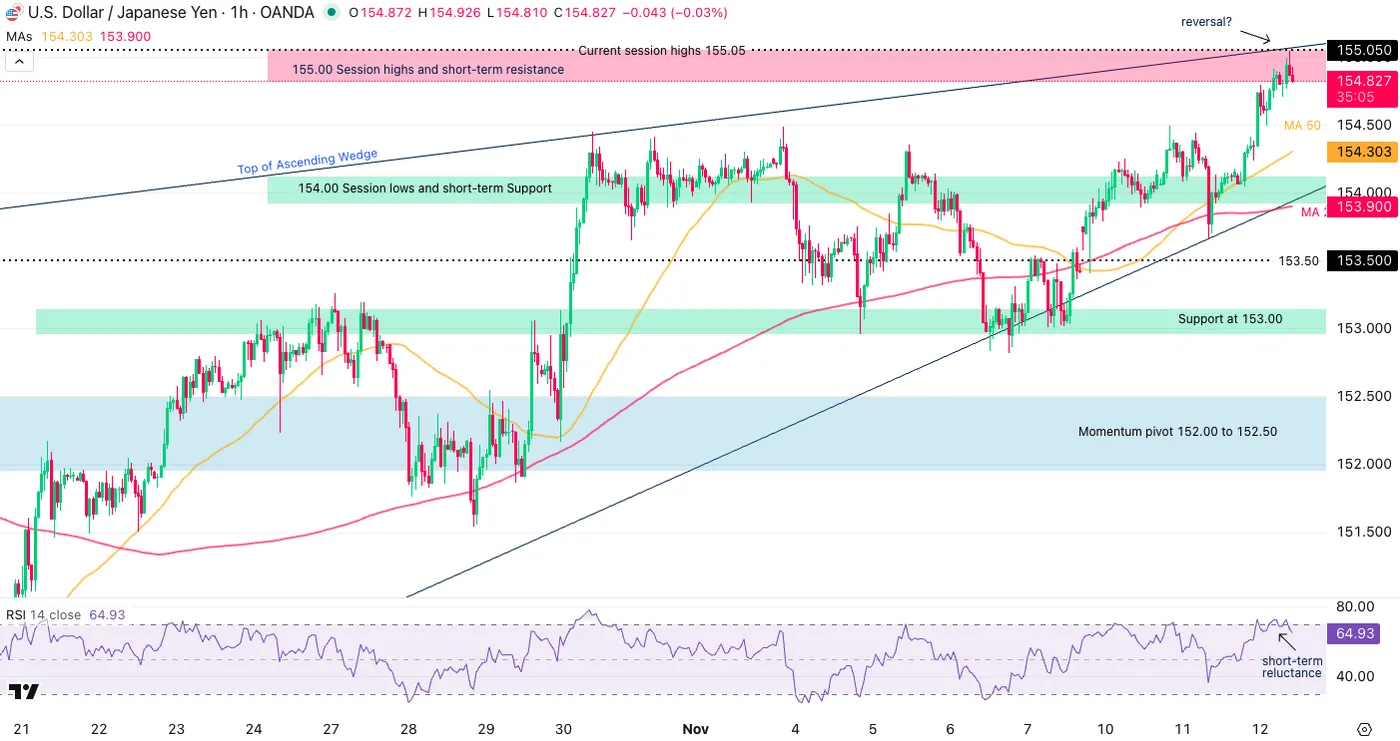
USD/JPY 1H Chart, November 12, 2025 – Source: TradingView
The shorter timeframe shows a more balanced price action on the short-term, with some bull-exhaustion towards overbought levels.
This gives that much more emphasis on the 155.00 handle which will be the level which dictates upcoming trends.
If a small retracement extends from here, watch the reactions at the bottom trendline of the wedge to spot if buyers recharge – Failing to do so may prompt further downside.
Safe Trades!
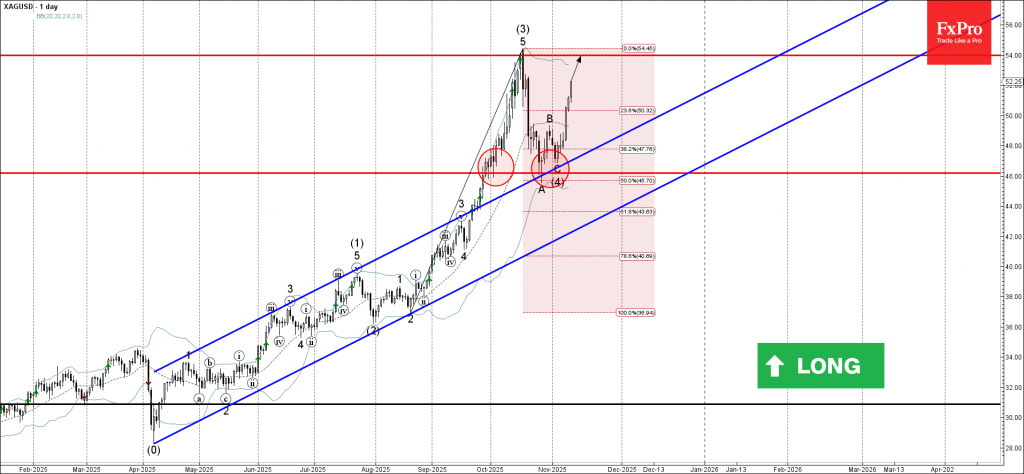
Silver Wave Analysis
Silver: ⬆️ Buy
- Silver broke round resistance level 50.00
- Likely to reach resistance level 54.00
Silver continues to rise inside the intermediate impulse wave (5), which started earlier from the support zone between the support level 46.00, lower daily Bollinger Band and the 50% Fibonacci correction of the upward impulse from August.
The price earlier broke the round resistance level 50.00 – which accelerated the active impulse wave (5).
Given the strong daily uptrend, Silver can be expected to rise further to the next resistance level 54.00 (which stopped the earlier impulse wave (3) in October).
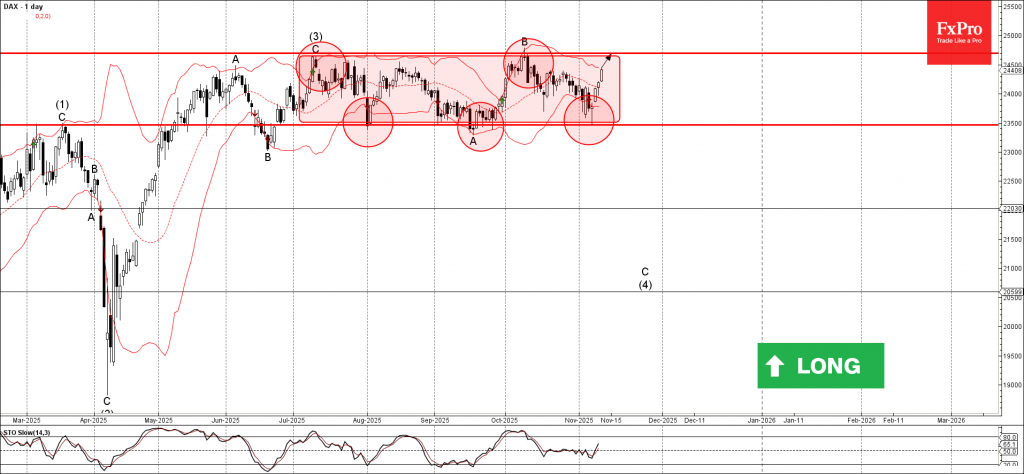
DAX index Wave Analysis
DAX index: ⬆️ Buy
- DAX index reversed from support level 23500.00
- Likely to rise to resistance level 24695.00
DAX index recently reversed with the daily Hammer from the support level 23500.00 (lower border of the sideways price range inside which the index has been moving from July, as can be seen from the daily DAX chart below).
The support level 23500.00 was strengthened by the lower daily Bollinger Band.
Given the clear daily uptrend, DAX index can be expected to rise further to the next resistance level 24695.00 (upper border of the active sideways price range, which stopped earlier waves (3) and B).
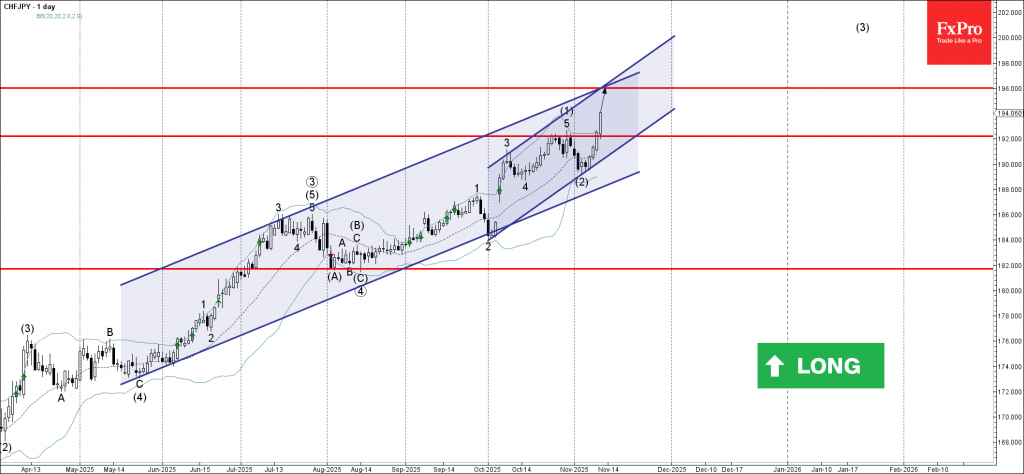
CHFJPY Wave Analysis
CHFJPY: ⬆️ Buy
- CHFJPY broke pivotal resistance level 192.00
- Likely to rise to resistance level 196.00
CHFJPY currency pair recently broke above the pivotal resistance level 192.00 (which stopped the previous impulse wave (1), as can be seen from the daily CHFJPY chart below).
The breakout of the resistance level 192.00 accelerated the active intermediate impulse wave (3) from the start of November.
Given the overriding daily uptrend, CHFJPY currency pair can be expected to rise to the next resistance level 196.00 (coinciding with the resistance trendlines of the two up channels from October and May).
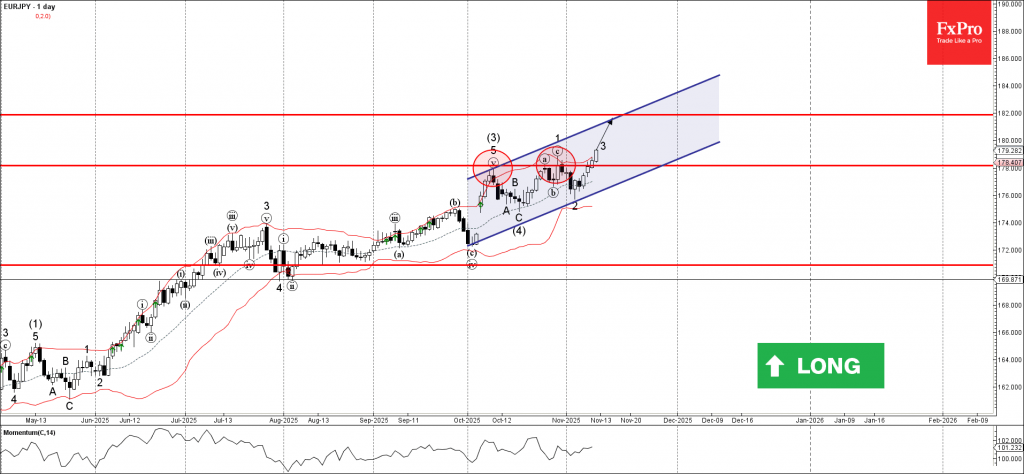
EURJPY Wave Analysis
EURJPY: ⬆️ Buy
- EURJPY broke strong resistance level 178.00
- Likely to rise to resistance level 182.00
EURJPY currency pair recently broke above the strong resistance level 178.00 (which has been reversing the price from the start of October, having stopped the previous waves (3) and 1, as can be seen below).
The breakout of the resistance level 0.9325 accelerated the active impulse wave 3 of the intermediate impulse wave (5) from the middle of October.
Given the strong daily uptrend and the bearish yen sentiment seen today, EURJPY currency pair can be expected to rise to the next resistance level 182.00.