Sample Category Title
Trump Signs Funding Deal, Ending Record-Long Shutdown
In focus today
- In the UK, September GDP data is released. Growth rates are low but close to potential, a challenging cocktail with inflation close to 4%.
- In Sweden, October inflation details are published this morning. Last week's flash estimate saw yet another upside surprise, as CPIF overshot over forecast by a tenth and the Riksbank by 0.4 p.p. Core inflation rose as well, in contrast to expectations, which raises some questions regarding the Riksbank's confidence in their current inflation assessment. As such, today's details will prove an important input in assessing the 'temporary nature' of this inflation overshoot. For what it is worth, all 'temporary surprises' this year have been to the upside.
- Additionally, the Riksbank will publish their bi-annual Financial Stability Report. The first edition, from spring, highlighted the elevated political uncertainty abroad and the need for Swedish banks to have a more active liquidity management. On top of the usual comments regarding the resilience of households and the real estate sector, we are particularly keen to hear if the Riksbank has more to say on banks' liquidity management.
- Overnight, China will release the monthly batch of data for retail sales, industrial production and indicators for the housing market. We expect to see a continued picture of a two-speed economy with robust manufacturing, partly driven by strong exports, while retail sales and housing data will likely continue to show weak domestic demand.
Economic and market news
What happened overnight
President Donald Trump signed legislation to end the 43-day government shutdown, the longest in US history, after the House of Representatives passed the funding package in a 222-209 vote. The deal extends federal funding through 30 January, allowing federal workers to return to their jobs as early as Thursday and restoring disrupted government services such as food assistance and air traffic control. However, the shutdown has caused lasting disruptions, with key economic data releases for October, such as employment and CPI reports, unlikely to be published. The funding package did not include healthcare subsidies, a contentious issue that will be revisited in December.
What happened yesterday
In the US, two Fed speakers were on the wire. Atlanta Fed President Bostic, who announced he will retire in February 2026, stated he favours keeping rates unchanged until there is clear evidence that inflation is returning to the 2% target, citing inflation as a greater risk than labour market signals. Bostic was not scheduled to become a voting member until 2027, so his decision to retire will not impact near-term monetary policy decisions. Meanwhile, New York Fed President John Williams discussed the Federal Reserve's upcoming end to quantitative tightening on 1 December and signalled plans for gradual asset purchases to maintain ample reserves.
Furthermore, Anthropic announced a USD 50bn investment to build data centres in Texas and New York, with additional sites planned. Partnering with Fluidstack, the initiative aims to boost AI infrastructure and aligns with the Trump administration's push to maintain American leadership in AI. The project is expected to create 800 permanent jobs and 2,400 construction jobs, further highlighting the rapid expansion of AI investment in the US.
In France, lawmakers voted to suspend President Macron's contested pension reform, keeping the minimum retirement age at 62 years and nine months until after the 2027 elections. The suspension, secured through concessions to Socialist lawmakers, provides Prime Minister Lecornu's government with a temporary reprieve as it struggles to pass next year's budget in a hung parliament. However, the freeze, combined with other spending trade-offs, raises fresh concerns over the country's ability to rein in its euro zone-high budget deficit.
In oil markets, OPEC's latest report forecasts a small surplus of 20,000 bpd in 2026, revising its earlier predictions of a deficit. The shift reflects higher production from OPEC+ and non-OPEC+ producers, contrasting sharply with the IEA's projection of a 4 million bpd surplus next year. Following the release, oil prices fell over 3% to USD 63 per barrel.
Equities: Equities moved higher again yesterday across regions, with fresh all-time highs set in several indices. Interestingly, the US was not leading this leg higher, Europe outperformed once again, as did several other regions. Also noteworthy, yesterday's session did not feature a tech-led catch-up after the previous day's tech underperformance. Instead, defensives continued to outperform, with healthcare once again the best-performing sector globally. To put that into context, global healthcare has now gained more than 15% over the past three months, outperforming the next best sector by over 5 percentage points despite an already strong equity tape. That fits perfectly with our call made during summer, both in terms of reasoning and performance pattern, and we are obviously quite pleased with how that thesis has played out. In Europe, banks were again the best-performing industry yesterday. Over the past 12 months, European banks are now up more than 77%. Despite the strong run, our conviction remains unchanged, the sector still I not expensive, and the fundamental drivers continue to align with our view. In the US yesterday, Dow +0.7%, S&P 500 +0.1%, Nasdaq -0.3%, Russell 2000 -0.3%. Asian equities trade higher this morning, and futures are modestly firmer in both Europe and the US.
FI and FX: Yields have edged marginally higher on the expected end to the US government shutdown. 10Y US Treasury yields continue to trade close to the 4.10 mark while the US swap curve has steepened slightly during the Asia-hours. In commodities oil prices traded heavy following remarks from OPEC that supplies had surpassed demand earlier than expected. This contributed to sending Brent crude down below USD 63/bbl and by extension EUR/NOK up in the high 11.60s. AUD is the big FX outperformer overnight following better-than-expected labour market figures. EUR/USD has been steady overnight after having risen close to 1.16 during yesterday's US session. Finally, the JPY is under pressure with markets continuing to test the Japanese authorities' preparedness to intervene in the market.
What is Safe, Anyway?
Optimism continues – and extends to a fourth session – as the US government shutdown ends and the latest news regarding AI are rather encouraging. Among them, AMD jumped 9% after forecasting accelerating sales growth over the next five years, and Cisco beat analyst estimates for last quarter and raised its annual guidance, saying that AI-boosted networking demand improved performance. Not only are they selling more hardware, but they’re also securing large AI infrastructure orders. That was exactly what investors wanted to hear: that AI investments are starting to show up somewhere in revenue generation. Cisco jumped 7.5% in after-hours trading.
But it doesn’t solve the puzzle of when Cisco’s clients — those who invest in chips, networks and data centers — will turn that investment, that spending, into revenue. And I’m afraid we won’t have the answer this quarter. Nvidia will probably announce another jaw-dropping result next week, but again, it won’t mean that those buying the chips are yet selling more stuff to end users.
Alibaba, for example, displayed slower growth in Singles Day sales this year despite using AI tools to boost activity, sending the stock price straight below the 50-DMA. We keep coming back to the same story: big spending, delayed results. For China, and for Alibaba, the big story isn’t even AI — it’s that consumer dynamics have been very difficult to revive since the pandemic. Meanwhile, in the US, consumers face the pressure of trade tensions, economic uncertainty and rising layoffs — partly due to AI-driven automation.
That being said, many of us continue to believe that short-term pain during this transition period will lead to long-term gain, as during the Industrial Revolution. On that note, Anthropic said it will invest $50 billion to build data centers in several locations including New York and Texas, a project expected to create around 3,000 jobs. There you go.
But still, Big Tech valuations and big spending will remain front of mind for investors until Microsoft, for example, can say that AI-boosted software sales have exploded — and that’s not yet the case.
Inspired by a comment claiming that most Big Tech companies are “safer than the US”, I looked at corporate growth through the lens of compound annual growth rates, pulled out their debt, and compared it with that of the US. It’s an odd comparison — apples to spaceships — since the US is a government while the tech giants are growth companies, they’re riskier by definition: if they go bankrupt, taxpayers won’t save them and they can’t print money. But the comparison was still revealing.
In terms of growth, Nvidia’s revenue has compounded by roughly 70% a year over the past three years, while Microsoft, Meta, and Amazon have grown between 10% and 25% annually — all multiples of the US’s roughly 3% GDP growth.
More importantly, although these companies have spent massively — maybe too much — their debt has either remained flat or grown far more slowly than their sales. In other words, their spending has been financed by cash, not borrowing. That makes their debt-to-revenue ratios much lower than the US. Numerically, the US debt-to-GDP ratio is around 118%, meaning the country spends more than it produces. Meanwhile, the debt-to-revenue ratios for Microsoft, Meta, and Amazon range between 20% and 45%, while Nvidia’s is almost null.
So, if we compared the US government to Big Tech using the same revenue-to-debt logic, Washington would look like the world’s most overleveraged company.
But of course, there’s more to the story. Big Tech has recently started selling bonds to finance higher spending and — more worryingly — teaming up with private equity firms to take on debt, keeping some of it off balance sheet. That’s something to watch.
As for the “safety” narrative: the US government remains safer as long as investors keep financing its debt by buying Treasuries. For now, they do. But developed market debt as a whole is increasingly seen as riskier, which may also explain why investors keep flocking into higher-risk assets despite stretched valuations. We’ll see how Rachel Reeves handles the Autumn Budget to keep investors on board — she’ll likely need to raise taxes. That ultimately means the UK will have to finance more of its own debt. The point is: “safe” status can be easier to lose than many think.
Coming back to market dynamics: futures are positive, and sentiment is more risk-on than risk-off this week. Investors are hopeful that upcoming US data will clarify the Federal Reserve’s (Fed) December intentions. But since the odds of a December cut are roughly 50-50, any data point could swing expectations either way.
I won’t waste time speculating whether the data will come in before the Fed decision — we’ll see as it flows in and watch how markets reposition. My guess for the next few weeks is as good as anyone’s.
What’s clearer, though, is that sentiment among oil bulls keeps deteriorating. OPEC’s latest monthly report said supplies exceeded demand sooner than expected — duh — due to rising non-OPEC production. The report sent US crude straight below $60 per barrel. Even the IEA’s prediction that global demand will keep growing until 2050, from around 100 mbpd today to 113 mbpd, couldn’t bring the bulls back. The barrel is now testing the $58 support with enough momentum to justify a deeper move below $55 per barrel, which acted as solid support earlier this year.
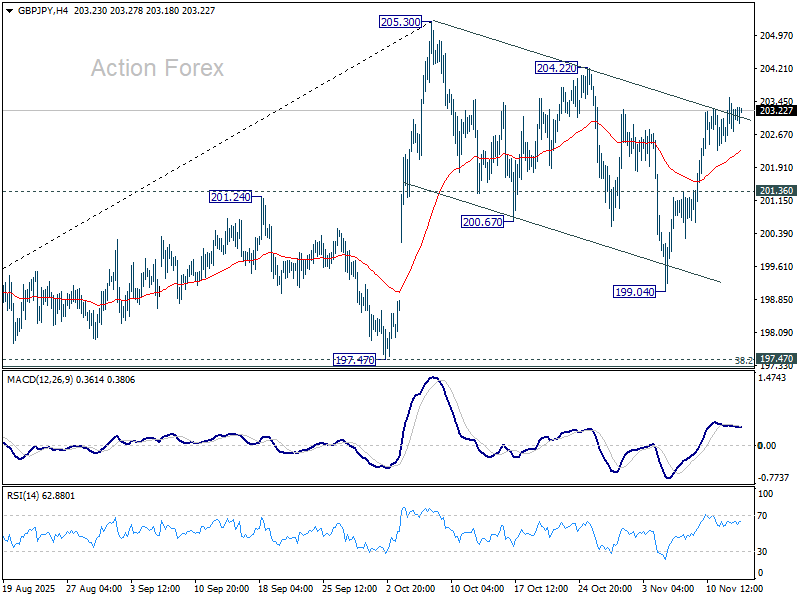
GBP/JPY Daily Outlook
Daily Pivots: (S1) 202.73; (P) 203.15; (R1) 203.69; More...
Intraday bias in GBP/JPY stays neutral for the moment. On the upside, break of 204.22 resistance should confirm that correction from 205.30 has completed with three waves at 199.04. Further rise should be seen through 205.30 to resume the larger rally from 184.53. On the downside, below 201.36 minor support will turn bias to the downside to 199.04 and below to extend the correction.
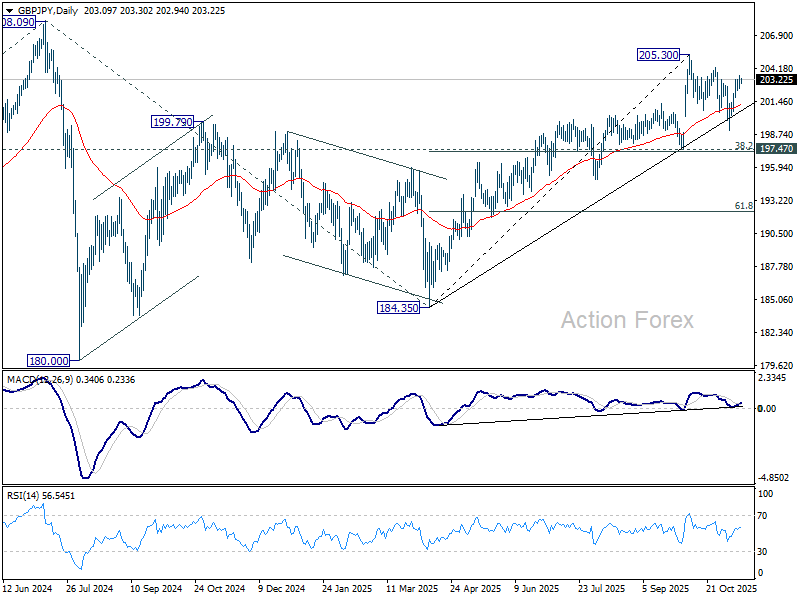
In the bigger picture, price actions from 208.09 (2024 high) are seen as a corrective pattern which might have completed at 184.35. Firm break of 208.09 high will resume the up trend from 123.94 (2020 low). Next target is 61.8% projection of 148.93 to 208.09 from 184.35 at 220.90. However, decisive break of 197.47 support will dampen this view and extend the corrective pattern with another fall.
EUR/JPY Daily Outlook
Daily Pivots: (S1) 178.80; (P) 179.12; (R1) 179.77; More...
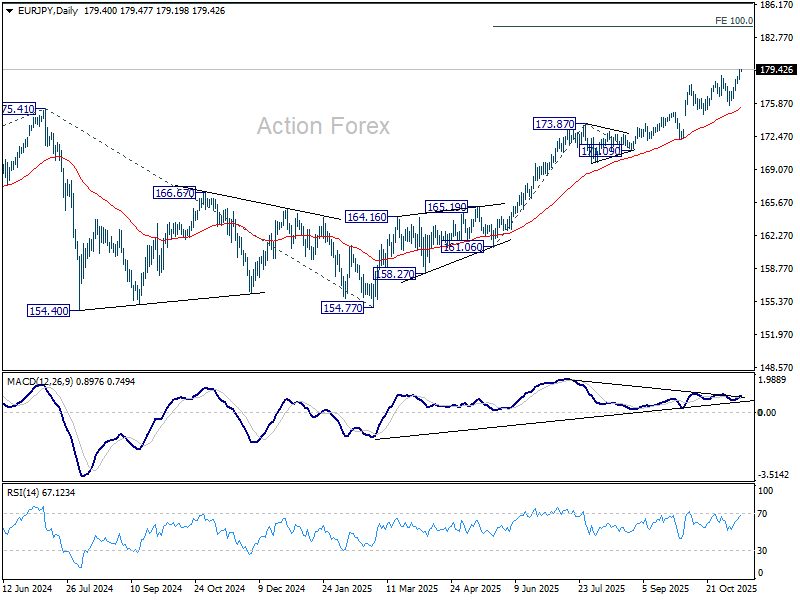
Intraday bias in EUR/JPY remains on the upside at this point. Current up trend should target 100% projection of 161.06 to 173.87 from 171.09 at 183.90 next. On the downside, below 178.42 minor support will turn intraday bias neutral and bring consolidations. But outlook will stay bullish as long as 175.67 support holds, in case of retreat.
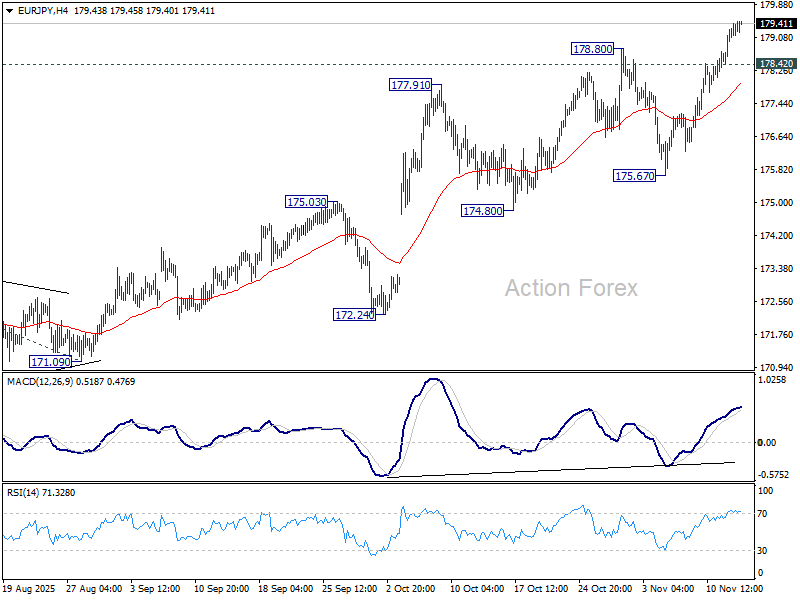
In the bigger picture, up trend from 114.42 (2020 low) is in progress and should target 61.8% projection of 124.37 to 175.41 from 154.77 at 186.31. Outlook will continue to stay bullish as long as 55 W EMA (now at 168.56) holds, even in case of deep pullback.
EUR/GBP Daily Outlook
Daily Pivots: (S1) 0.8806; (P) 0.8823; (R1) 0.8844; More…
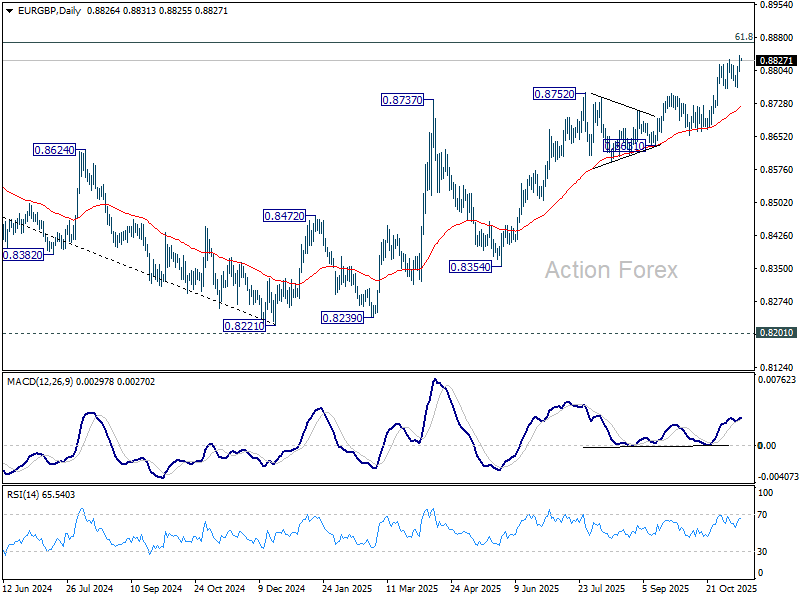
EUR/GBP's rally resumed by breaking through 0.8828 resistance and intraday bias is back on the upside. Current rise from 0.8221 shoe target 0.8867 fibonacci level. Firm break there will carry larger bullish implications. For now, risk will stay on the upside as long as 0.8765 support holds, in case of retreat.
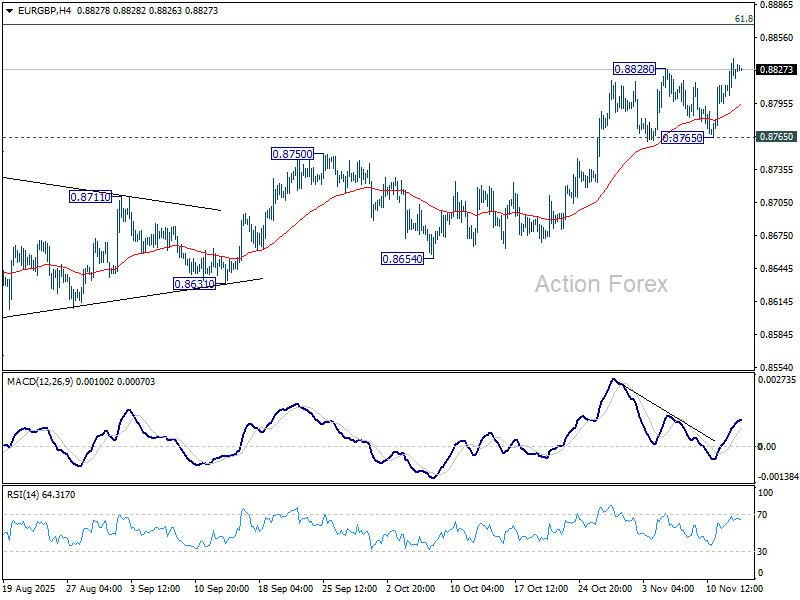
In the bigger picture, rise from 0.8221 medium term bottom is still seen as a corrective move. Upside should be limited by 61.8% retracement of 0.9267 to 0.8221 at 0.8867. Firm break of 0.8654 support will be the first sign that this corrective bounce has completed. However, decisive break of 0.8867 will suggest that EUR/GBP is already reversing whole decline from 0.9267 (2022 high).
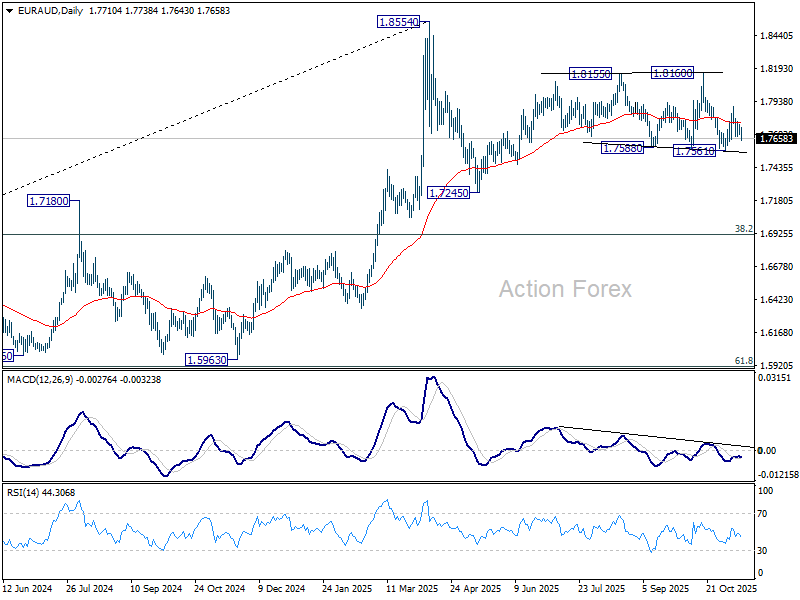
EUR/AUD Daily Outlook
Daily Pivots: (S1) 1.7681; (P) 1.7726; (R1) 1.7767; More...
No change in EUR/AUD's outlook and intraday bias stays neutral. On the downside, break of 1.7561 support will revive the bearish case that corrective pattern from 1.8554 is in the third leg, and target 1.7245 support. On the upside, though, above 1.7895 will resume the rebound from 1.7561 to 1.8160 resistance next.
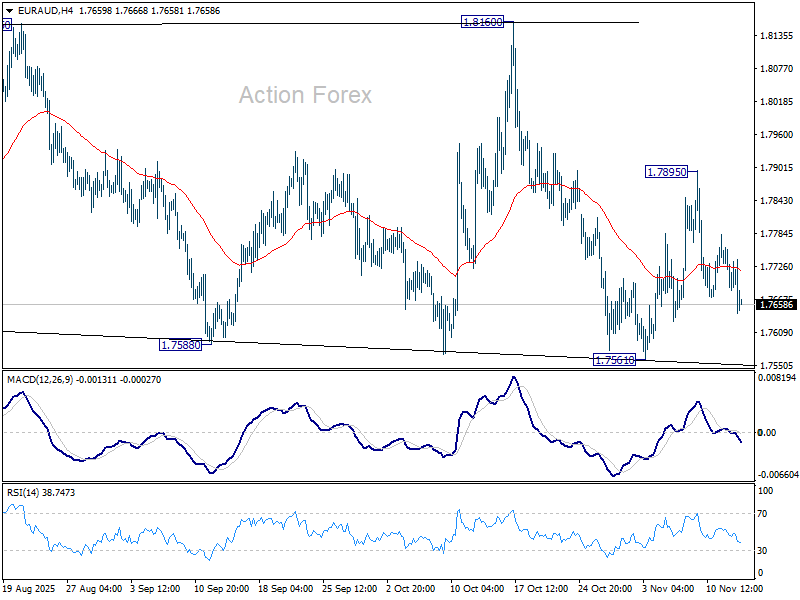
In the bigger picture, price actions from 1.8554 medium term top are seen as a corrective pattern. Sustained break of 55 W EMA (now at 1.7424) will suggest that it's correcting the whole rally from 1.4281 (2022 low). In this case, deeper decline would be seen to 38.2% retracement of 1.4281 to 1.8554 at 1.6922. Nevertheless, strong rebound form 55 W EMA will likely bring resumption of the up trend sooner.
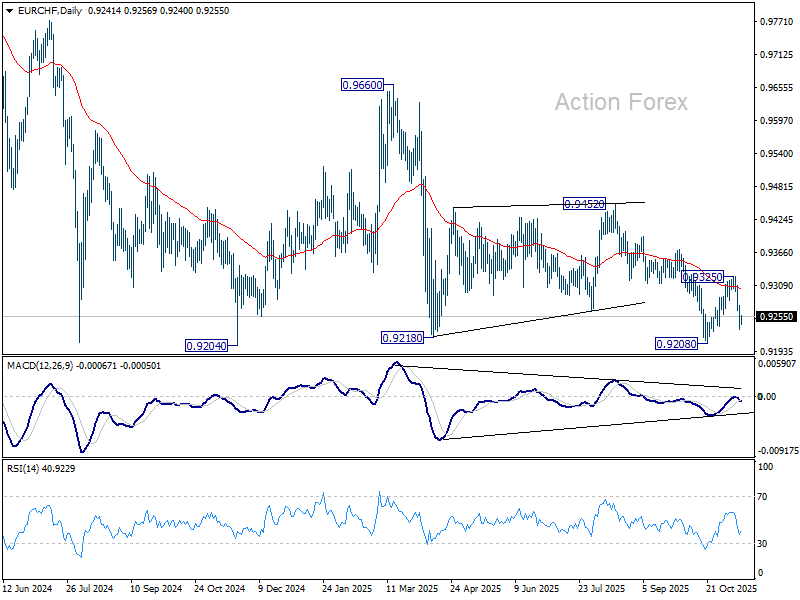
EUR/CHF Daily Outlook
Daily Pivots: (S1) 0.9229; (P) 0.9253; (R1) 0.9273; More....
EUR/CHF's break of 0.9257 support suggests the rebound from 0.9208 has completed as a correction at 0.9325, after rejection by 55 D EMA (now at 0.9302). Intraday bias back on the downside for retesting 0.9204/8 support zone. Decisive break there will confirm larger down trend resumption. For now, risk will stay on the downside as long as 0.9325 resistance holds, in case of recovery.
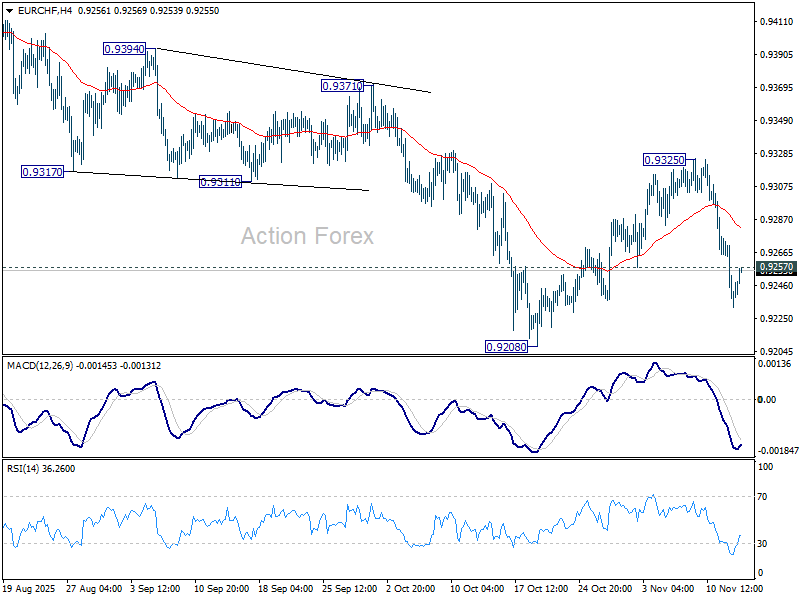
In the bigger picture, outlook remains bearish with EUR/CHF staying well inside long term falling channel after multiple rejection by 55 W EMA (now at 0.9383). Firm break of 0.9204 will resume the whole down trend from 1.2004 (2018 high). Next target is 61.8% projection of 1.1149 to 0.9407 from 0.9928 at 0.8851. However, break of 0.9452 resistance will now be the first sign of medium term bottoming.
EUR/USD Daily Outlook
Daily Pivots: (S1) 1.1571; (P) 1.1585; (R1) 1.1606; More…
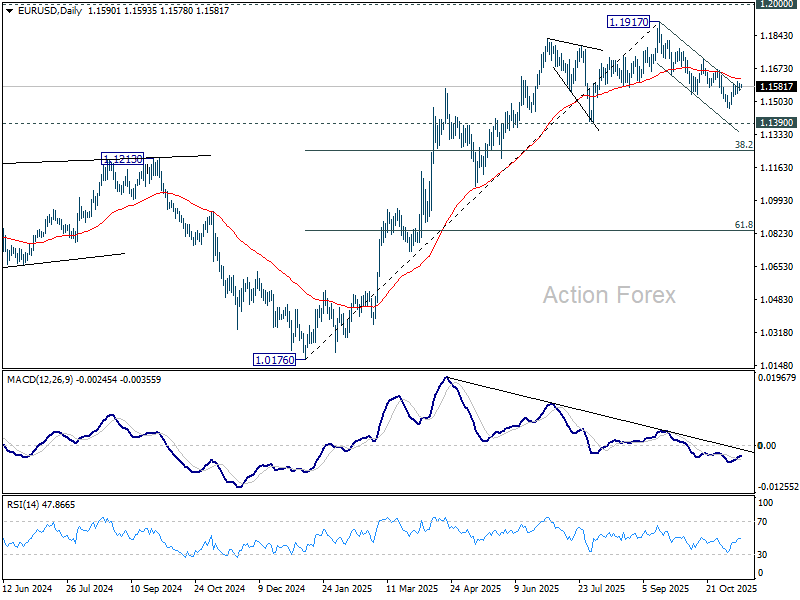
Intraday bias in EUR/USD stays neutral and outlook is unchanged. Further decline remains mildly in favor below 55 D EMA (now at 1.1619). Break of 1.1467 support will resume the decline from 1.1917 to 1.1390 support next. However, sustained trading above 55 D EMA will argue that fall from 1.1971 has completed as a correction only, and bring further rise to 1.1727 resistance next.
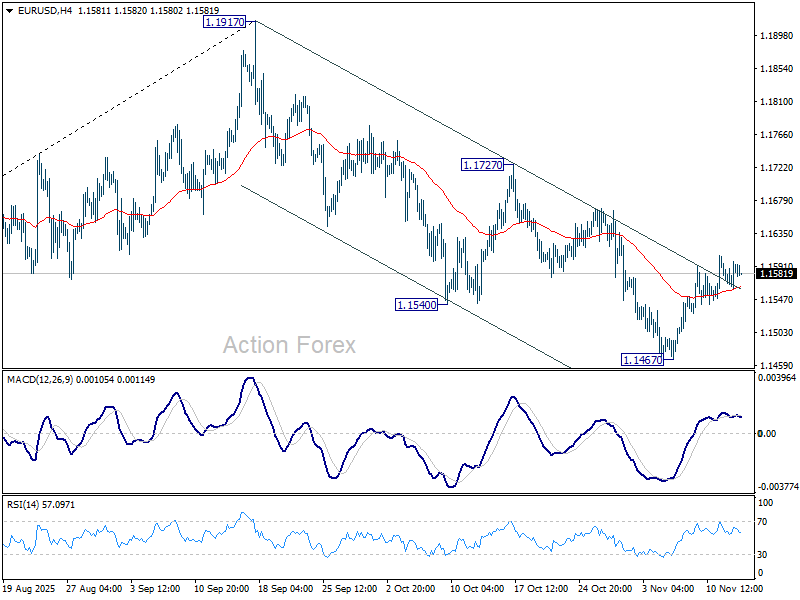
In the bigger picture, considering bearish divergence condition in D MACD, a medium term top is likely in place at 1.1917, just ahead of 1.2 key psychological level. As long as 55 W EMA (now at 1.1306) holds, the up trend from 0.9534 (2022 low) is still expected to continue. Decisive break of 1.2000 will carry larger bullish implications. However, sustained trading below 55 W EMA will argue that rise from 0.9534 has completed as a three wave corrective bounce, and keep long term outlook outlook bearish.
USD/JPY Daily Outlook
Daily Pivots: (S1) 154.22; (P) 154.64; (R1) 155.22; More...
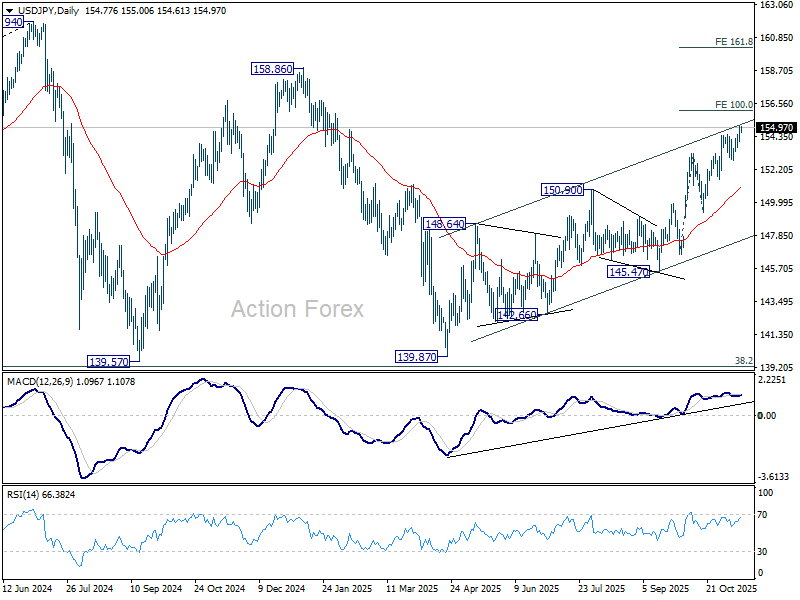
Intraday bias in USD/JPY remains on the upside at this point. Current rally from 139.87 should target 100% projection of 146.58 to 153.26 from 149.37 at 156.05. Firm break there will pave the way to 158.86 key structural resistance. For now, near term outlook will stay bullish as long as 152.81 support holds, in case of retreat.
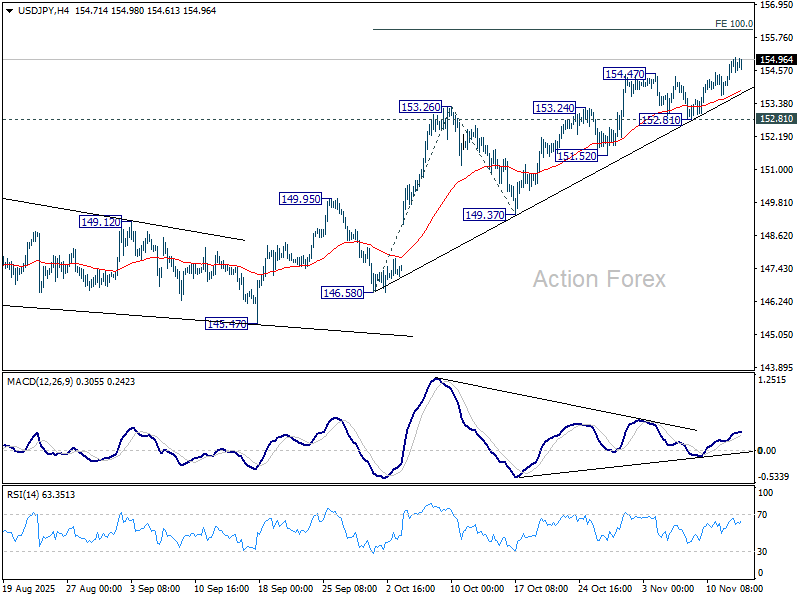
In the bigger picture, current development suggests that corrective pattern from 161.94 (2024 high) has completed with three waves at 139.87. Larger up trend from 102.58 (2021 low) could be ready to resume through 161.94 high. On the downside, break of 149.37 support will dampen this bullish view and extend the corrective pattern with another falling leg.
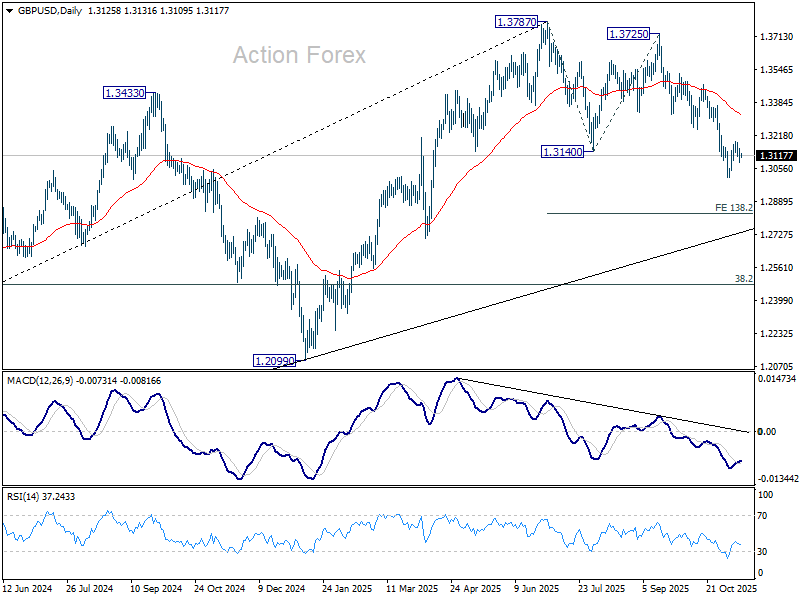
GBP/USD Daily Outlook
Daily Pivots: (S1) 1.3089; (P) 1.3128; (R1) 1.3171; More...
No change in GBP/USD's outlook as range trading continues and intraday bias stays neutral. Further decline is expected as long as 1.3247 support turned resistance holds. Break of 1.3008 will target 138.2% projection of 1.3787 to 1.3140 from 1.3725 at 1.2831. Nevertheless, firm break of 1.3247 will suggest that fall from 1.3787 has completed as a corrective move already.
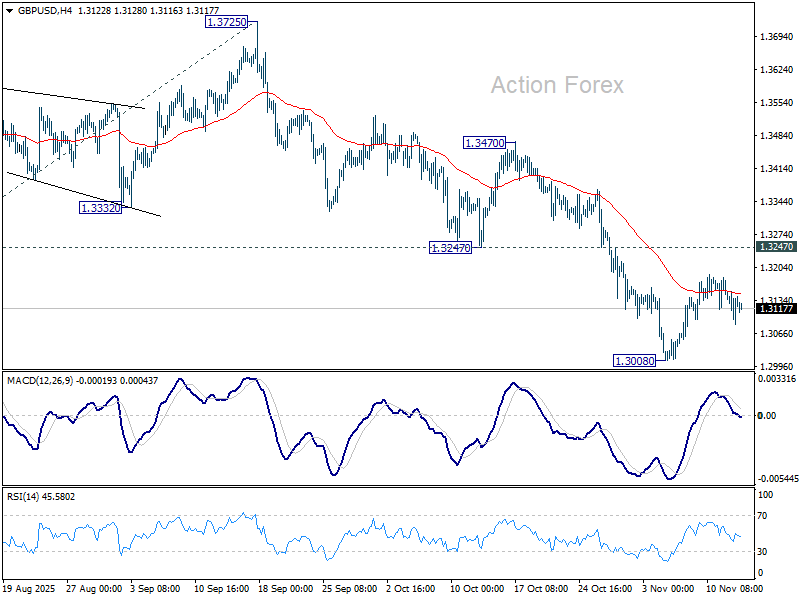
In the bigger picture, the break of 55 W EMA (now at 1.3185) is taken as the first sign that corrective rise from 1.0351 (2022 low) has completed. Decisive break of trend line support (now at 1.2780) will solidify this case and target 38.2% retracement of 1.0351 to 1.3787 at 1.2474 next. Meanwhile, in case of another rise, strong resistance should emerge below 1.4248 (2021 high) to cap upside to preserve the long term down trend.