Sample Category Title
Pound Succumbs to Pressure from Weak Labour Data
The GBP/USD pair snapped a four-day winning streak, declining for a second day to trade around 1.3135. The sell-off was triggered by UK labour market data revealing a rise in unemployment and a deceleration in annual wage growth. These figures have bolstered market expectations that the Bank of England (BoE) could initiate interest rate cuts as early as December.
The shifting sentiment was reflected in government bonds, with the two-year gilt yield falling 6 basis points to 3.74%, its lowest level since August 2024.
Appetite for risk was mixed across asset classes. European stock indices managed gains, while S&P 500 futures edged down approximately 0.2%.
In currency markets, traders are increasingly pricing in a more dovish path for BoE policy. Current pricing implies roughly 21 basis points of cuts by December, with a total of up to 65 basis points of easing projected by the end of 2026. Economists suggest that, given the softening labour market and anticipated fiscal tightening, the BoE's base rate could fall to 3.00% from the current 4.00%.
Technical Analysis: GBP/USD
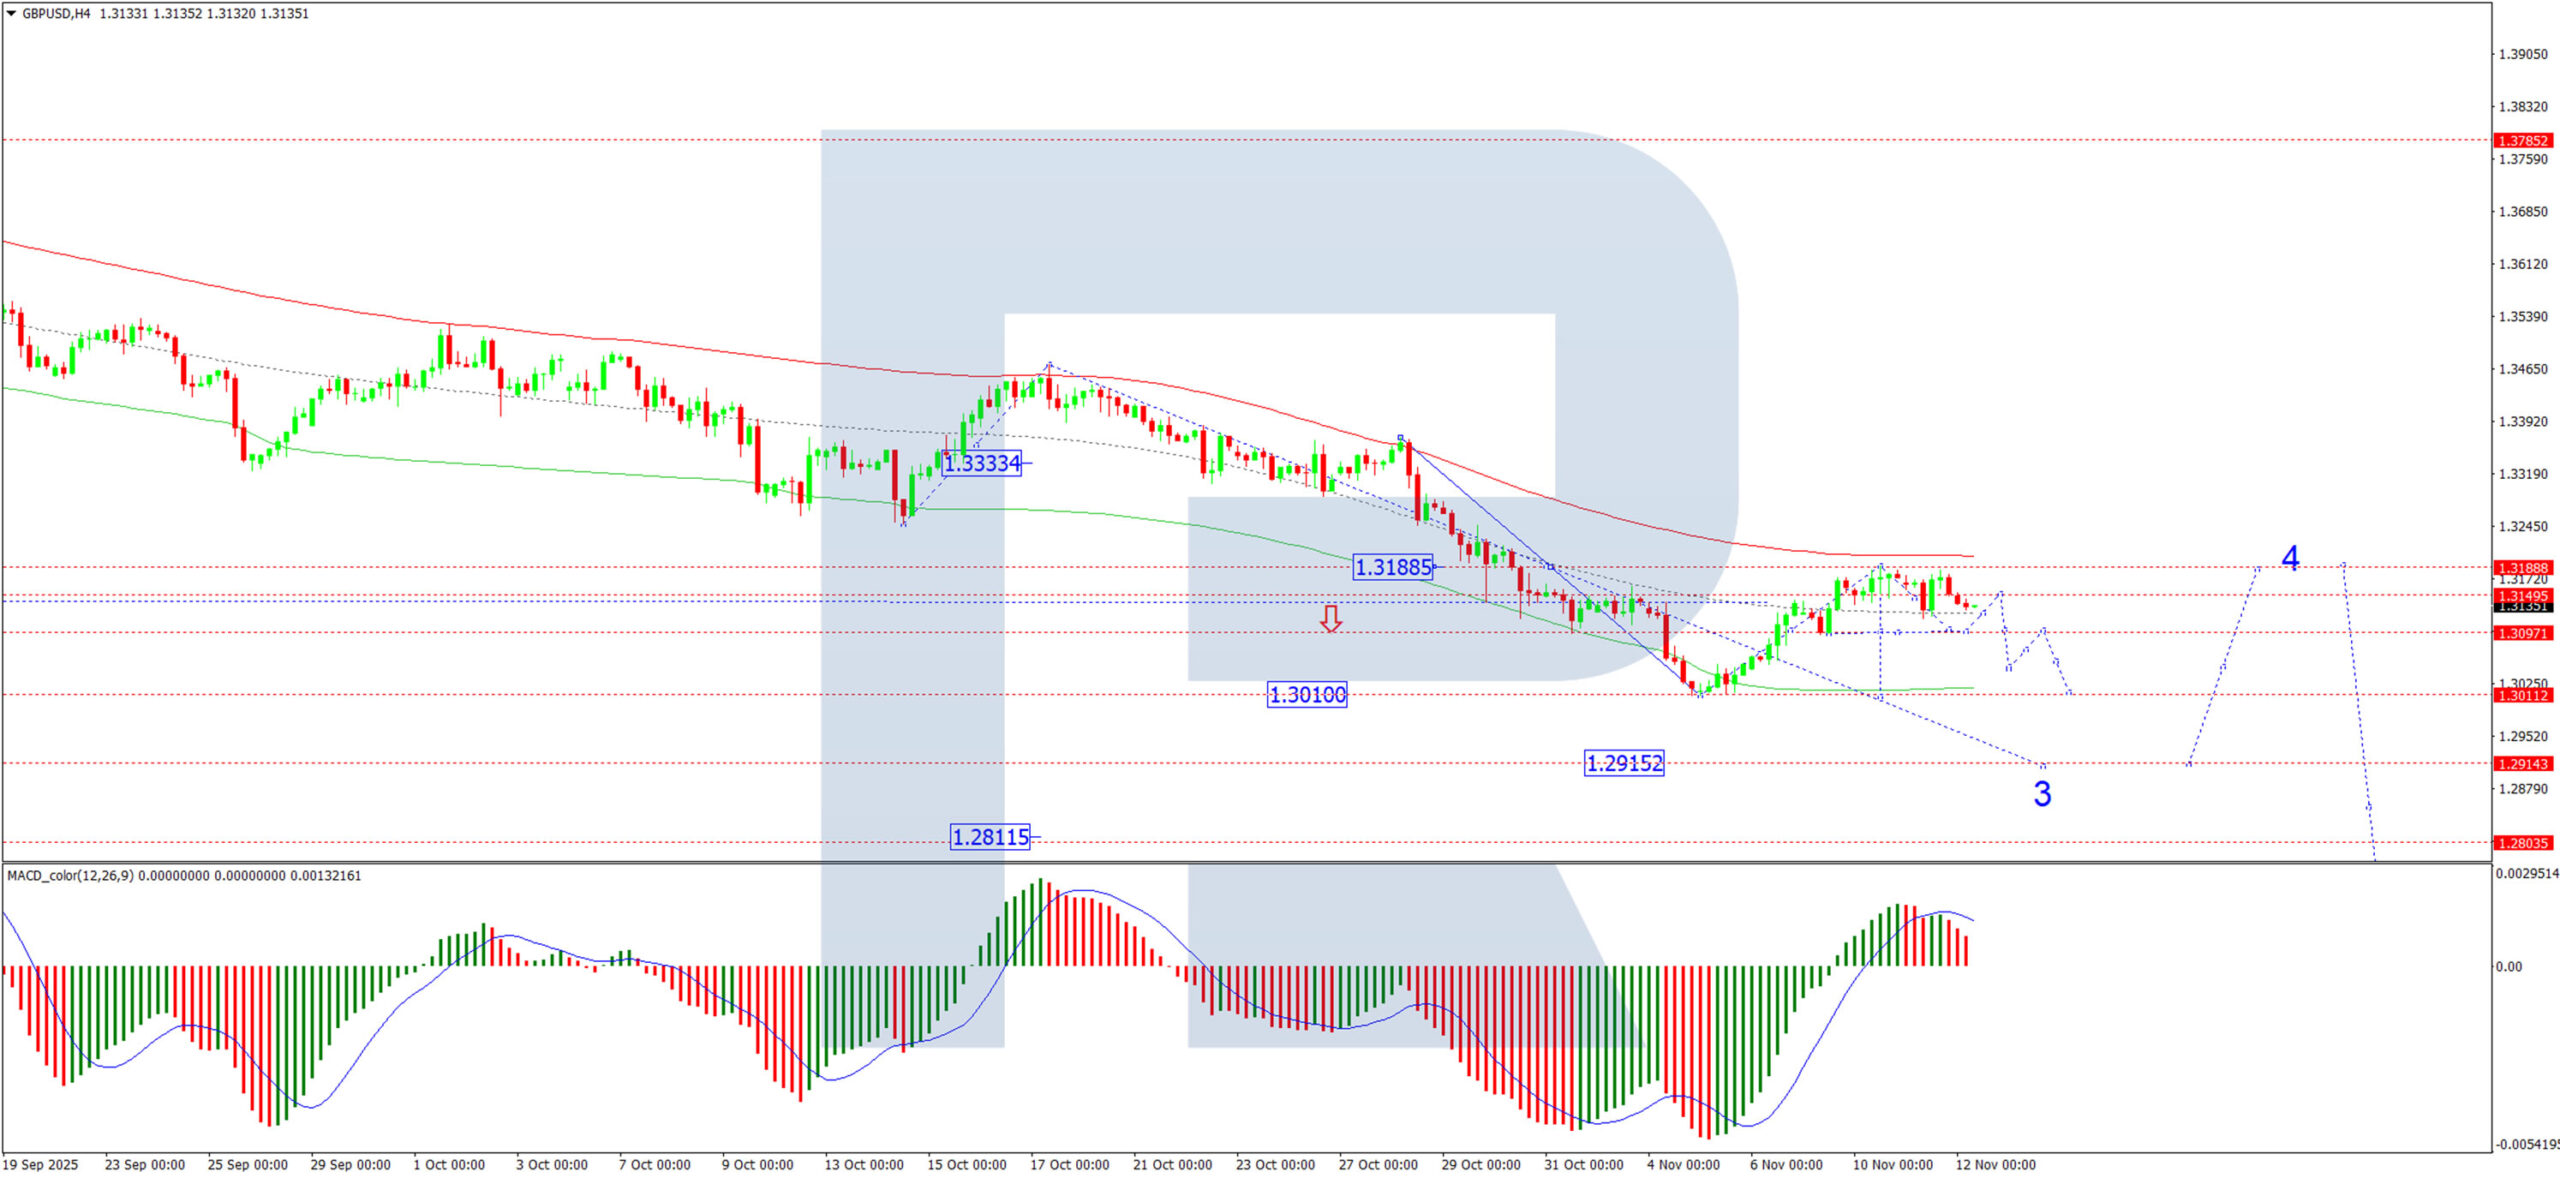
H4 Chart:
On the H4 chart, GBP/USD broke upwards from a consolidation range around 1.3100, completing a corrective wave to 1.3185. We now anticipate a decline back towards the 1.3100 support level. A brief rebound to 1.3150 may follow, establishing a new consolidation range. A subsequent downward breakout from this range would signal a resumption of the broader downtrend, opening the path towards 1.3000, with a further potential decline to at least 1.2915. This bearish scenario is supported by the MACD indicator. Its signal line is above zero but has diverged from its histogram, suggesting the initial upward correction is exhausted and a new decline is beginning.
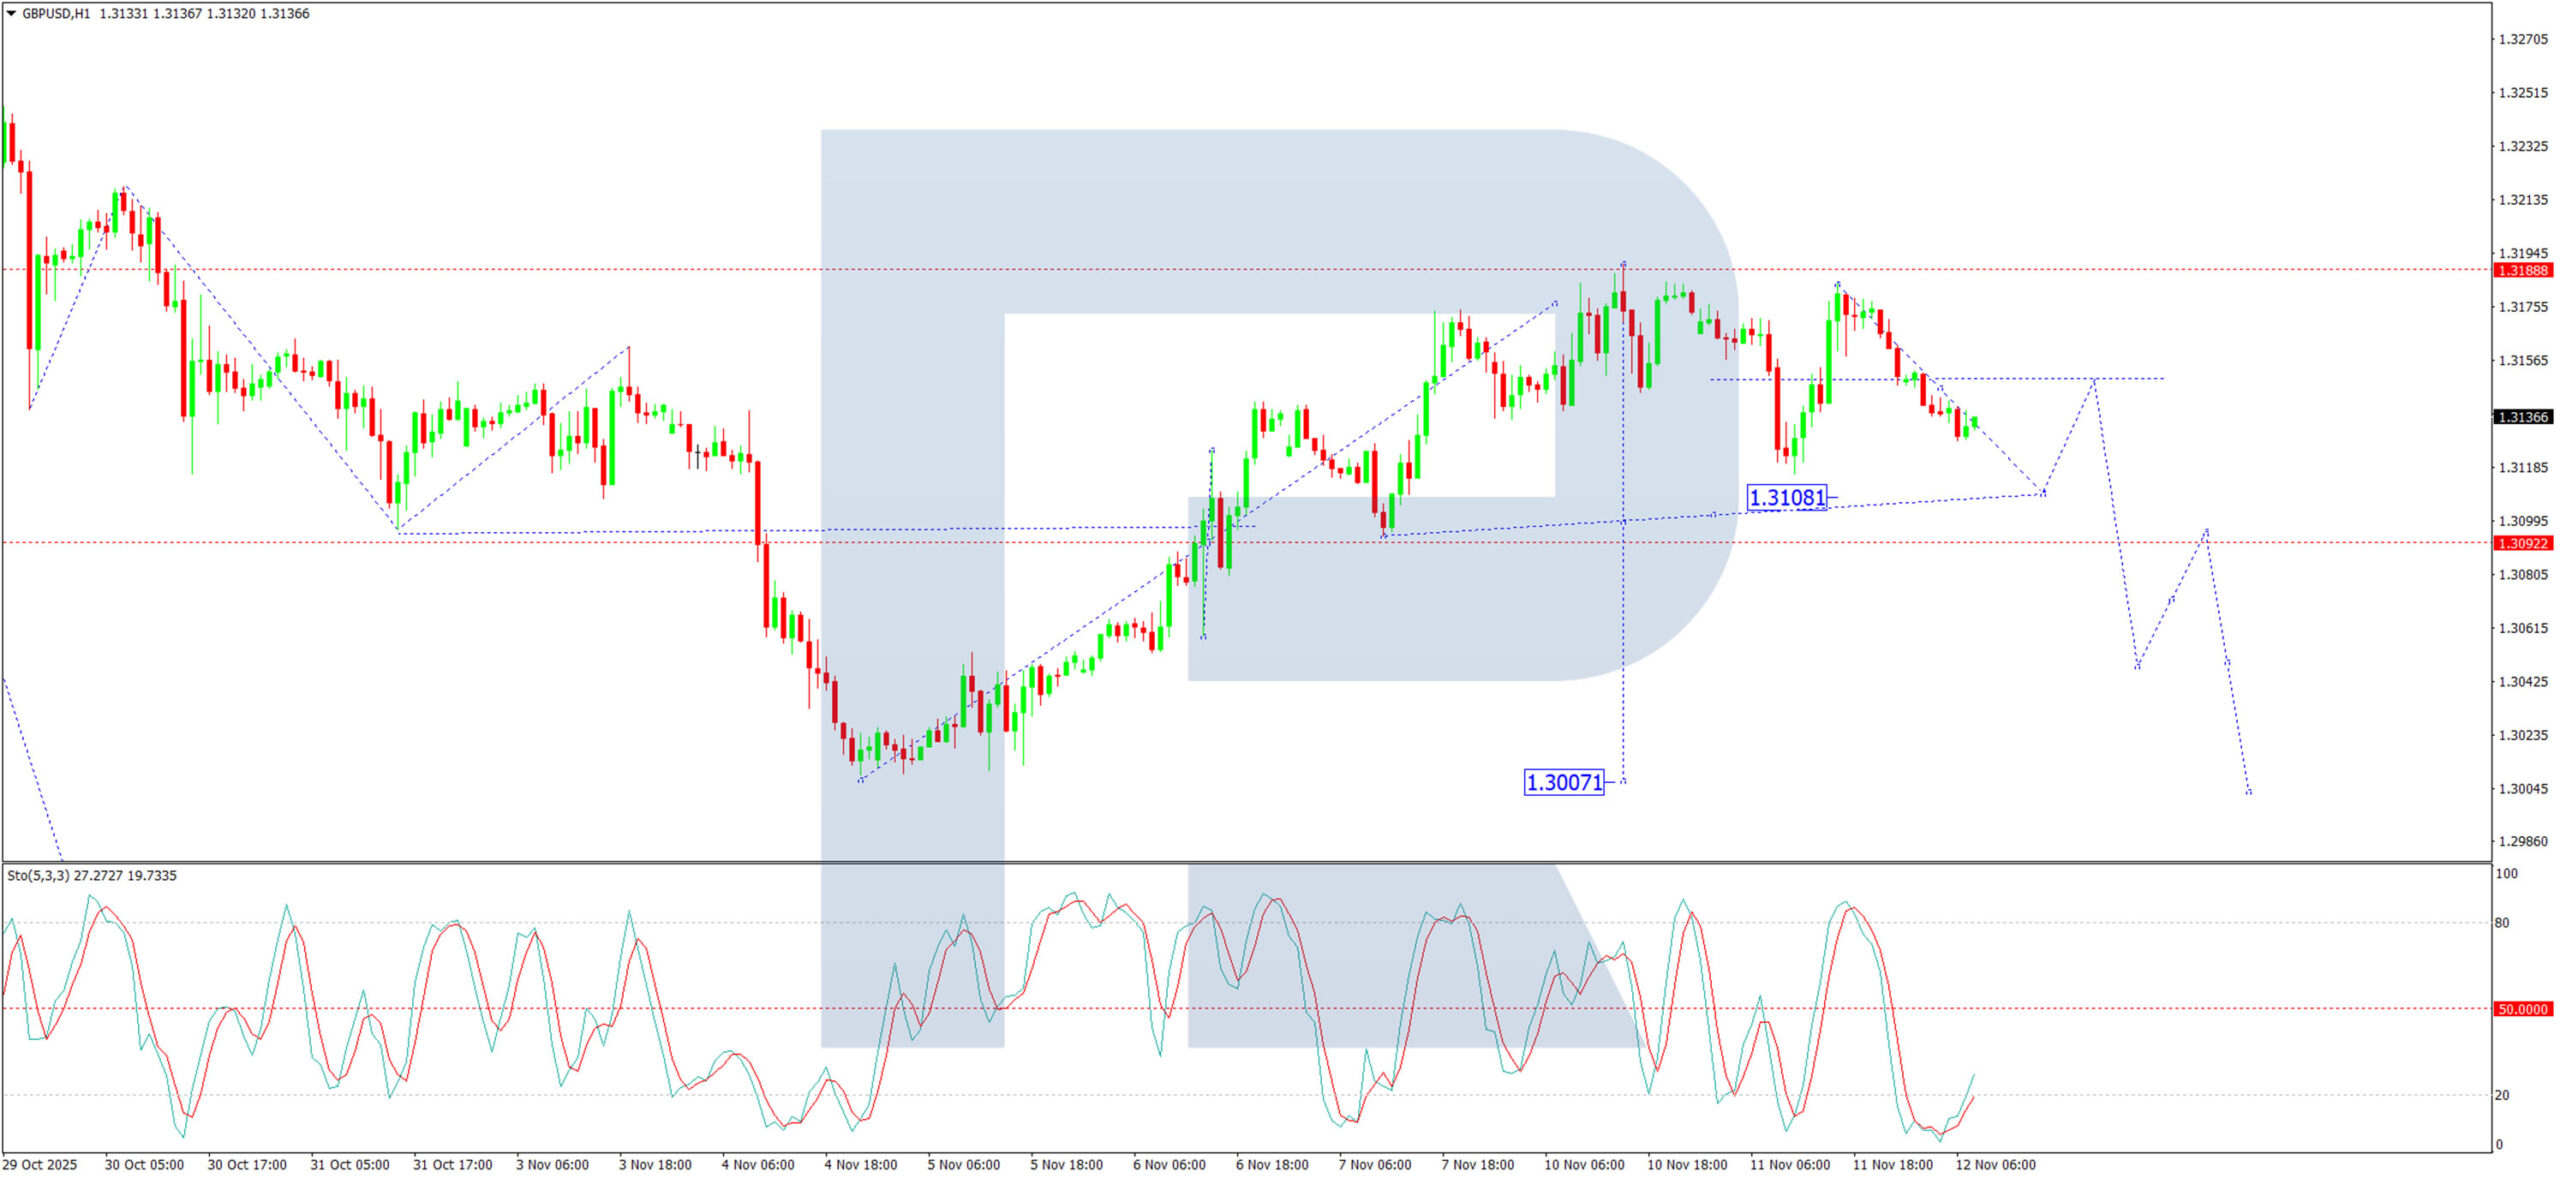
H1 Chart:
On the H1 chart, the pair completed an upward correction to 1.3188 after breaking from a range at 1.3100. A new downward wave is now developing, initially targeting 1.3108. Following this, a technical retracement to test 1.3150 from below is expected. Once this correction is complete, the downtrend is projected to extend towards 1.3050. The Stochastic oscillator confirms this outlook. Its signal line is at the 20 level, indicating oversold conditions but also supporting the view that downward momentum is currently dominant.
Conclusion
The pound is weakening as soft labour market data fuels expectations of imminent BoE monetary easing. Technically, the pair appears to have completed a corrective bounce and is now poised to resume its primary downtrend. The immediate focus is on the 1.3100 support; a sustained break below this level would confirm a move towards 1.3000 and potentially lower.
BTC/USD Chart Analysis: Price Moves Towards Key Support
Earlier we asked whether October would prove bullish for Bitcoin. The BTC/USD chart has given a clear negative answer. November, too, appears likely to close in the red — despite the fact that these two months have historically marked one of the strongest periods of growth for the leading cryptocurrency.
The previously identified range of $116K–$120K has acted as a strong resistance zone, and Bitcoin’s price fluctuations are now more clearly shaping a descending channel, the lower boundary of which connects the series of lower lows formed over the past three months.
Concerns have been heightened by a Bloomberg report noting that, unlike the “October crash”, which was largely driven by the liquidation of leveraged positions, the current wave of selling is coming from a key segment of the market — long-term holders. Since early October, they have reportedly sold around 400,000 BTC, which could serve as a warning signal for the market.
Technical Analysis of BTC/USD
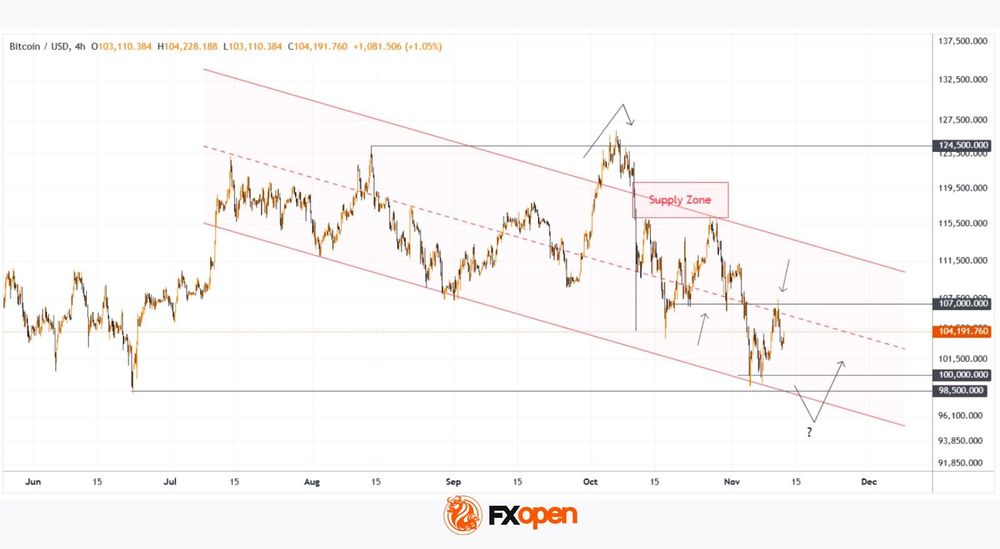
Early November was marked by a decline below the psychological $100K level — a false bearish breakout. Following a brief spike in panic-driven selling, the price rebounded towards the channel’s median, effectively mirroring the earlier false bullish breakout that had established the current all-time high. This price action resembles a liquidity grab pattern.
It is worth noting that the $107K level has now switched its role from support to resistance, reflecting the bears’ (so far successful) attempt to keep the price in the lower half of the red channel. Should they maintain control, the market may move towards a test of the June lows, where another false bearish breakout could potentially form — as indicated by the arrow with a question mark on the chart.
FXOpen offers the world's most popular cryptocurrency CFDs*, including Bitcoin and Ethereum. Floating spreads, 1:2 leverage — at your service. Open your trading account now or learn more about crypto CFD trading with FXOpen.
*Important: At FXOpen UK, Cryptocurrency trading via CFDs is only available to our Professional clients. They are not available for trading by Retail clients. To find out more information about how this may affect you, please get in touch with our team.
This article represents the opinion of the Companies operating under the FXOpen brand only. It is not to be construed as an offer, solicitation, or recommendation with respect to products and services provided by the Companies operating under the FXOpen brand, nor is it to be considered financial advice.
EUR/USD Rebounds Modestly While USD/JPY Targets More Gains
EUR/USD is climbing higher above 1.1520 and 1.1540. USD/JPY managed to reclaim 154.00 and might aim for more gains.
Important Takeaways for EUR/USD and USD/JPY Analysis Today
- The Euro started a decent increase above the 1.1520 pivot level.
- There is a key bullish trend line forming with support near 1.1570 on the hourly chart of EUR/USD at FXOpen.
- USD/JPY climbed higher above 153.50 and 154.00.
- There is a bullish trend line forming with support near 154.10 on the hourly chart at FXOpen.
EUR/USD Technical Analysis
On the hourly chart of EUR/USD at FXOpen, the pair started a fresh increase from 1.1500. The Euro cleared a few key hurdles near 1.1520 to move into a positive zone against the US Dollar.
The pair settled above 1.1550 and the 50-hour simple moving average. A high was formed at 1.1605 and the pair is now consolidating gains. There was a test of the 23.6% Fib retracement level of the upward move from the 1.1468 swing low to the 1.1605 high.
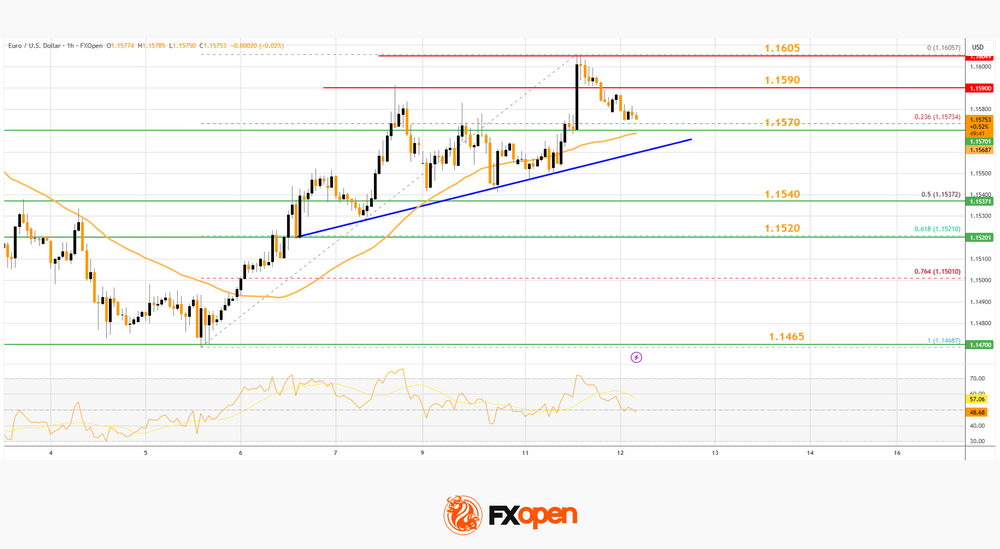
However, the bulls are active above 1.1550. Immediate support is near a key bullish trend line at 1.1570 and the 50-hour simple moving average. The first major key area of interest on the EUR/USD chart is near the 50% Fib retracement at 1.1540.
If there is a downside break below 1.1540, the pair could drop toward 1.1520. The next key breakdown area sits at 1.1465, below which the pair could start a major decline.
On the upside, the pair is now facing resistance near the 1.1590 zone. The next breakout region sits at 1.1605. An upside break above 1.1605 could set the pace for another increase. In the stated case, the pair might rise toward 1.1680.
USD/JPY Technical Analysis
On the hourly chart of USD/JPY at FXOpen, the pair started a decent increase from 152.80. The US Dollar gained bullish momentum above 153.20 against the Japanese Yen.
It settled above the 50-hour simple moving average and 154.00. The upward move was such that the pair even tested 154.50. A high was formed at 154.49 and the pair is now consolidating gains. There was a minor pullback below 154.00.
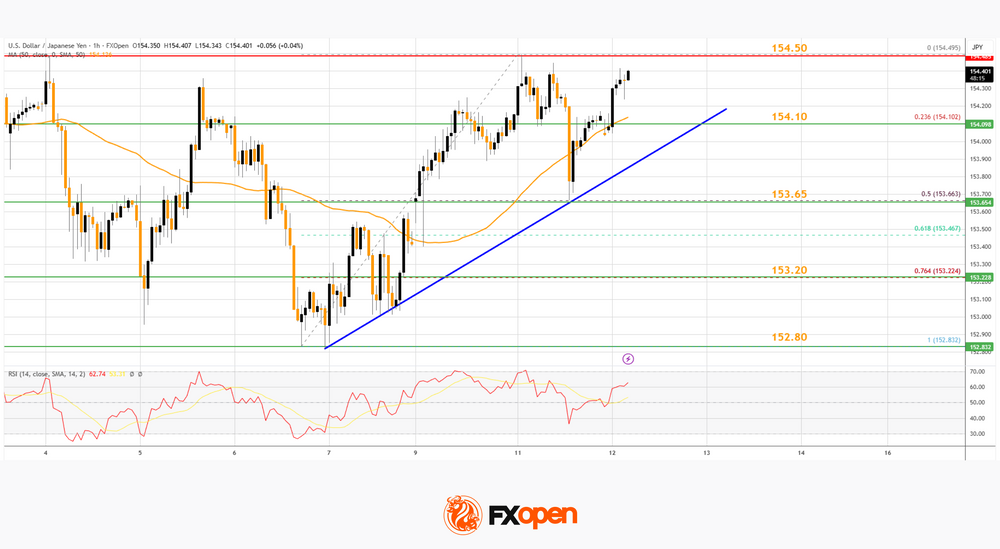
However, the bulls protected the 50% Fib retracement level of the upward move from the 152.83 swing low to the 154.49 high. The current price action is positive, and the pair seems to be aiming for more gains.
There is also a bullish trend line forming with support near 154.10. Immediate resistance on the USD/JPY chart is near 154.50. The first key hurdle sits at 155.00. If there is a close above 155.00 and the RSI moves above 70, the pair could rise toward 156.20.
The next stop for the bulls might be 156.80, above which the pair could test 158.00 in the coming days. On the downside, the first major support is near the trend line at 154.10.
The next area of interest could be near 153.65, below which the pair could test the 76.4% Fib retracement at 153.20. Any more losses could open the doors for a move toward 152.80.
Trade over 50 forex markets 24 hours a day with FXOpen. Take advantage of low commissions, deep liquidity, and spreads from 0.0 pips. Open your FXOpen account now or learn more about trading forex with FXOpen.
This article represents the opinion of the Companies operating under the FXOpen brand only. It is not to be construed as an offer, solicitation, or recommendation with respect to products and services provided by the Companies operating under the FXOpen brand, nor is it to be considered financial advice.
Markets Look Forward to Restart of US Data Publication Over the Coming Week(s)
Markets
On Monday, the US Senate approved a bill to end the shutdown of the US government and this is expected to be rubberstamped by the House of Representatives today. The new bill will fund the US government through January 30. Senate Republicans agreed on a vote to healthcare subsidies that Democrats wanted to be prolonged, but there is no guarantee that this will be approved. After some volatility last week, (US) equity markets saw the end of the shutdown as a good enough reason to resume a buy-the-dip strategy. In a session with US bond markets closed for Veteran’s Day, the Dow Jones yesterday closed at a record (+1.18%). The Nasdaq jumped higher on Monday, but couldn’t build on that momentum yesterday (-0.25%), suggesting high valuations on some AI-related sectors are a source of market caution. US yields this morning open 2-3 bps lower across the board. US fixed income futures yesterday jumped as ADP reported that the US private sector lost 11 250 jobs/week in the four weeks ended Oct 25, suggesting a cooling in the labour market. The reaction yesterday suggests markets see the restart of publishing US data as raising chances for a follow-up Fed rate cut at the Decr 10 meeting. Still, recent Fed comments suggest highly divided views within the FOMC, with a several members staying cautious to ‘commit’ to further easing with inflation still above target and the Fed policy come closer to a neutral level. The risk-on and ADP data, tempered last week’s USD bid. DXY closed at 99.43, to be compared with a 100.36 top last week. EUR/USD extends its rebound and tested the 1.16 big figure yesterday (close 1.1582). The yen underperforms with USD/JPY (154.65 area) testing the highest levels since February. Sterling is also still fighting an uphill battle. Labour market data published yesterday showed the unemployment rate in September rising to 5% (from 4.8%). October job growth (-32k) and earnings data were also softer than expected, reinforcing the case for a December BoE rate cut. The UK yield curve bull steepened with yields declining between 8.3 bps (2-y) and 6.7 bps (30-y). EUR/GBP returned north of 0.88. Last week’s top (0.8829, weakest level of sterling against the euro since April 2023) is again within reach.
Risk sentiment in Asia remains positive this morning. There are only second tier eco data scheduled for release today. As the US House today is expected to approve the spending bill to reopen the government, markets will look forward to the restart of the US data publication over the coming week(s). For now, it’s far from sure this process will provide a clear view to (re)assess Fed policy in the run-up to the December Fed meeting. Interesting to see how far current risk rebound goes. For, now dollar losses at least stay very modest.
News & Views
The Hungarian Economy Ministry yesterday raised deficit targets for both this year and next. Minister of National Economy Nagy said that they’ll keep the deficit stable at 2024 levels instead of reducing it. This means a 5% of GDP shortage for both 2025 and 2026. Originally, the government planned to reduce it to 3.7% of GDP both this year (later revised to 4.1%) and in 2026 (adopted this summer, but later on watered down to 4%). To finance the shortfall, the government will freeze all of the HUF192bn in reserves included in next year’s budget and will collect HUF370bn instead of HUF185bn via an extra profit tax on banks. PM Orban also suggested that he could activate the “financial shield” agreed with US president Trump to protect the economy from speculative attacks. Plans to issue foreign currency (USD?) bonds early next year could be seen in that direction. The Hungarian forint lost ground yesterday, with EUR/HUF coming off a YtD low at 383.50 to close around 385. The Hungarian bond yield curve bear steepened with yield rising by 3.5 bps (2-yr) to 10 bps (30-yr). Hungarian risk premia rise with markets keeping a close eye on credit rating verdicts by Moody’s (Nov 28; Baa2 with negative outlook), Fitch (Dec 5; BBB with stable outlook) and especially S&P (date unknown; BBB- with negative outlook).
The International Energy Agency published its World Energy Outlook today. It added/re-introduced a new scenario (“Current Policies scenario) in which global oil and gas demand will rise for the next 25 years as governments’ commitment to climate goals are fading. Since 2020, the IEA’s modelling all assumed that fossil fuel consumption would peak this decade. A huge growth in electricity demand is central in all of the IEA’s scenario’s, rising by 40%-50% by 2035 with demand coming from the increasing penetration of white goods and air conditioners, shift to electric cars as well as advanced manufacturing and data centers.
Elliott Wave Analysis of Nasdaq (NQ) Forecasts New All Time High, Targeting at Least 26793
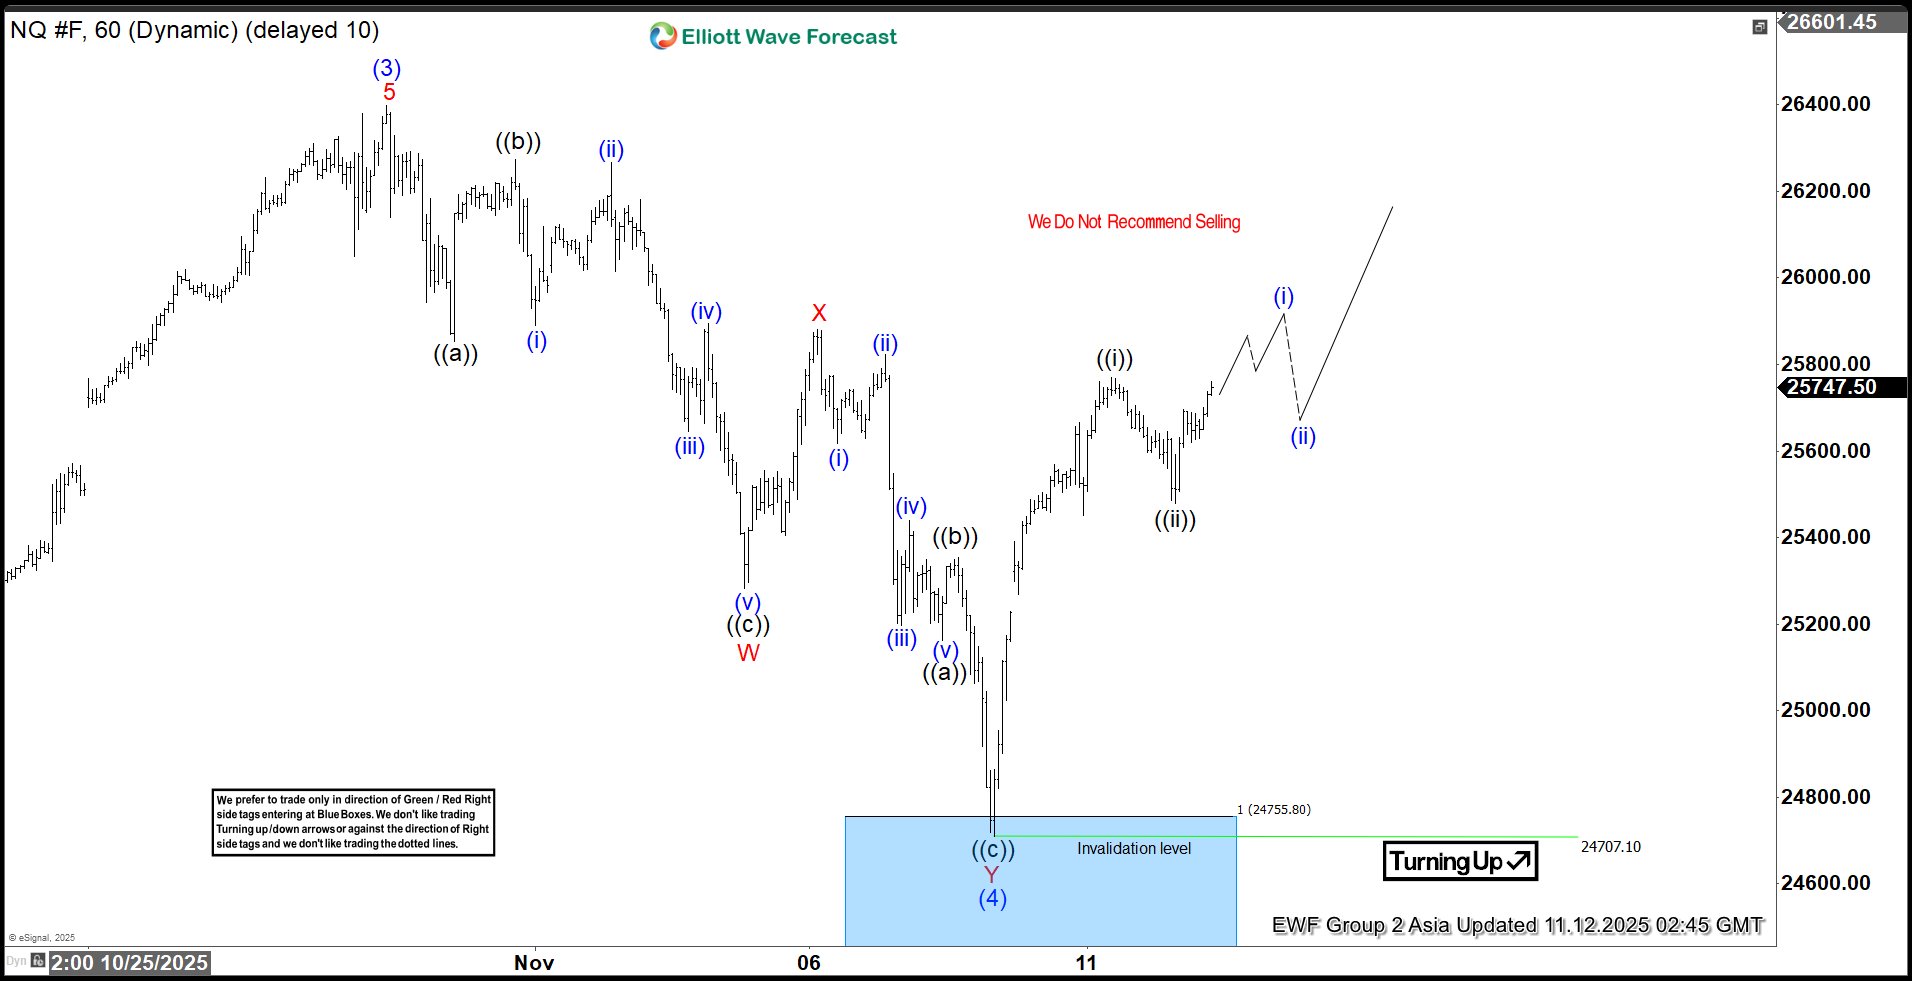
The bullish cycle in the Nasdaq (NQ) that commenced from the April 2025 low remains underway, unfolding as an impulsive Elliott Wave structure. Within this broader advance, wave (3) of the eight-month rally concluded at 26,399. The subsequent corrective phase, wave (4), developed as a double three structure. This is an Elliott Wave pattern characterized by a combination of corrective sequences.
From the peak of wave (3), wave ((a)) declined to 25,853, followed by a rebound in wave ((b)) that reached 26,274. The final leg of the correction, wave ((c)), extended lower to 25,282, thereby completing wave W of a higher degree. A subsequent rally in wave X peaked at 25,880 before the index turned lower once more in wave Y, which has taken the form of a zigzag.
Within wave Y, wave ((a)) declined to 25,162, followed by a corrective bounce in wave ((b)) to 25,354.75. The final leg, wave ((c)), dropped to 24,707.1, marking the completion of wave Y of (4). From this low, the index has resumed its upward trajectory in wave (5). Advancing from wave (4), wave ((i)) topped at 25,768.75, and the pullback in wave ((ii)) found support at 25,478.50. Provided the pivot at 24,707.1 remains intact, the near-term outlook favors further upside continuation in wave (5)
Nasdaq (NQ) 1-Hour Elliott Wave Chart From 11.11.2025
Nasdaq Elliott Wave Video
https://www.youtube.com/watch?v=8aZm-GpqKNE
Can AI Thrive If Humans Don’t?
Nothing – not even the news that SoftBank sold its entire Nvidia stake could spoil market sentiment yesterday, as investors bought into the optimism that the US government shutdown will finally end! Yes, after 41 days, the US government will reopen, and the data drought will come to an end.
Now, the US reopening optimism will hardly last, as the issues have not evaporated. Besides the political unease around medical care and other highly charged topics that I don’t cover, the US debt continues to rise. The legality of US tariffs is being questioned — and if the tariffs are rolled back, it could cost the US government up to $2 trillion according to Trump, pushing the national debt above the $40 trillion mark sooner than expected. Add to that the persistent Trump risks - and the highly unpredictable nature of the Trump administration - all that is expected to show up in the data as weaker jobs and maybe – but I say maybe – higher inflation.
Yesterday, ADP released a fresh set of figures, contradicting its previous print that the US economy added 42K new private jobs in October. It turns out that hiring slowed in the second half and that US companies shed more than 11K jobs on average per week in the four weeks leading up to October 25th. That complements Challenger’s data suggesting the biggest job losses since the early 2000s due to AI and technology sihfts.
Is it a problem? It depends for whom. It’s certainly a problem for politicians, but not for investors. Investors want – and need – this data to be soft enough to justify another 25bp rate cut from the Federal Reserve (Fed) in December, which would echo positively across valuations through softer borrowing costs. And softer borrowing costs are needed to make these huge AI investments more affordable. So, yesterday’s ADP print was welcome news, along with the chaotic end of the US government shutdown.
345 companies in the S&P 500 gained and pushed the index 0.21% higher. Technology stocks lagged, allowing the equal-weight S&P500 to close the gap with the tech-heavy, market-cap-weighted one. European stock markets – which have limited exposure to tech – gained as well. The Stoxx 600 and the FTSE 100 rallied to fresh all-time highs, as luxury companies led gains on news that Chinese sales are rebounding, while the Swiss SMI jumped nearly 2% on the possibility of a lower tariff rate than the 39% currently applied to Swiss exports to the US. There’s a chance this rate could be reduced to 15%, the same as for European peers. It’s not ideal, but it would at least discourage Swiss companies from relocating to neighbouring Europe and limit the negative impact of tariffs on the Swiss economy. But I’d wait for the details before clapping.
Nasdaq 100 retreated 0.31% on news that SoftBank sold its entire Nvidia stake to fund other AI projects. It appears SoftBank is looking to boost its bets further down the AI chain — toward companies that actually use AI, like OpenAI and ABB Robotics.
For those unhappy with the circularity of current AI deals, this is good news. These are the companies that should bring real money into the ecosystem and allow it to grow beyond the seven giants that are “sending fake dollars back and forth to each other” to keep the stock rally going. So the fact that Nvidia fell 3% shouldn’t be alarming – the company and US Big Tech are now growing beyond borders. Meta, for instance, signed a deal with Dutch cloud provider Nebius, which predicted rapid growth next year – and when I say rapid, it’s rapid: their sales soared by more than 300% last quarter. Their share price? It tanked 7% yesterday, along with CoreWeave, which fell 16%.
But data centers can only do well in this environment. AMD’s data-center revenue, for example, soared from $2 billion to $16 billion between 2020 and 2025, and will likely keep growing as companies invest in AI infrastructure.
Shopping for promising names on dips demands nerves – but could pay off. But when? Alibaba’s Double 11 (Singles’ Day) sales are just over. This year, Alibaba used AI tools to personalize recommendations, automate product descriptions and optimize pricing in real time — all of which likely supported sales. For some, it worked wonders: Xiaomi, for example, sold more than $4 billion worth of products!
But what’s interesting is how AI-driven search improved performance compared to last year. According to the South China Morning Post, AI boosted “relevance for complex queries” by about 20%, increased advertising cost-effectiveness (ROAS) by ~12%, and raised click-through-rates (CTR) in certain recommendation scenarios by ~10%. These gains suggest stronger user engagement and conversion potential compared with last year’s event – when such large-scale generative-AI tools weren’t yet deployed.
But – there’s always a but – overall consumer sentiment is described as “muted” this year, and the event didn’t show a massive growth spike relative to 2024. That gives us something to think about: can AI companies truly win long-term if consumers aren’t doing well? And can consumers thrive if AI keeps stealing jobs?
I’ll leave you with that thought today.
Time for House to Vote
In focus today
- Focus today turns to the vote in the US House of Representatives to pass the funding bill ending the shutdown.
- Later in the day we will follow speeches from several Fed speakers in the US. This includes FOMC members Williams and Waller, as well as Atlanta Fed President Bostic.
- In Sweden, we get the monthly public employment numbers (PES) for October. The weekly data have been encouraging.
Economic and market news
What happened overnight
In the US, the Supreme Court extended its pause on a judge's order requiring the Trump administration to fully fund the Supplemental Nutrition Assistance Program (SNAP), which has been impacted by the ongoing government shutdown. The decision allows the administration to continue withholding USD 4bn in food aid for 42 million low-income Americans until Thursday.
What happened yesterday
In the US, NFIB's October small business optimism survey was to the dovish side. The headline index rose marginally (98.2, from 98.8) and firms reported easing uncertainty. But at the same time, firms' realized and expected sales and earnings weakened, as did their expected price increases. Labour market indicators were less changed, as indices reflecting hiring plans and labour shortages remained mostly steady.
ADP published its new weekly rolling 4-week employment growth estimate, showing a decline of -11K. This contrasts with the stronger-than-expected monthly reading of +42K released last week. While the estimate lacks detailed explanations, it suggests that job growth momentum may have weakened towards the end of October.
In the UK, the labour market report was more dovish than expected. Payrolls declined by 32K in October, marking the steepest drop seen so far, alongside September. The unemployment rate rose to 5.0%, exceeding expectations, while private sector wage growth (3M rolling average) slowed to 4.2% in September, slightly below the November BoE projection. Notably, payrolls for September were revised sharply lower from -10K to -32K. EUR/GBP gained, returning to levels seen late last week, and the data supports our call for a December rate cut from the BoE.
In Switzerland, a deal to lower US tariffs on Swiss exports from 39% to 15% could be finalised as early as this week, though it still requires President Trump's approval. Swiss business leaders have engaged with US officials to push for the reduction, which would ease pressure on Swiss exporters, including watchmakers. Shares in Richemont and Swatch Group rose on the news, as the US accounts for 19% of Swiss watch exports.
In Germany, the ZEW index fell short of expectations in November. The assessment of the current economic situation rose less than expected to -78.7 (cons: -78.2) from -80.0 while expectations declined to 38.5 from 39.3 in contrast to the consensus forecast of 41.0. The report thus indicates that the economy is still at a weak footing and the expectation for an improvement is weakening. Note that the ZEW has been somewhat in contrast to the more positive signals from the PMIs in recent months.
In Portugal, Microsoft announced a USD 10bn investment in an AI data hub in Sines, partnering with Start Campus, Nscale, and NVIDIA on one of the largest AI projects in Europe. The project will deploy 12,600 GPUs and aims to position Portugal as a leading AI hub in Europe, leveraging its green energy initiatives and subsea cable connectivity.
Equities: Global equities extended gains yesterday, led by Europe. Interestingly, the healthcare sector topped the performance tables, rallying more than 2% and clearly outperforming tech, which declined on the day. This kind of rotation, healthcare outperforming tech, on a risk-on day, underscores that the session was not macro-driven, but rather driven by idiosyncratic factors and sector-specific narratives. In Europe, healthcare was the best-performing sector while utilities, the other traditionally defensive sector was the worst performer yesterday. Again, a rather unusual rotation pattern, suggesting that investors are repositioning within defensives rather than chasing cyclicals.
Macro data came in on the soft side, meaning that the equity rally was not fundamentally supported by yesterday's data flow. In the US yesterday, Dow +1.2%, S&P 500 +0.2%, Nasdaq -0.3% and Russell 2000 +0.1%. The S&P 500 and Nasdaq declined as concerns over elevated technology valuations weighed on sentiment. Nvidia fell 3.0% after SoftBank offloaded USD 5.83bn worth of shares, while CoreWeave dropped 16.3% following a cut to its revenue forecast. AI-related stocks remained volatile, dragging the tech-heavy Nasdaq down 0.3%, while gains in health and energy stocks helped the Dow rise 1.2%.
Asian markets are trading higher this morning, with US and European futures also in positive territory. Notably, US tech futures are showing some early signs of recovery after yesterday's underperformance.
FI and FX: The primary development over the last 24 hours has been the drop in US and UK yields following weaker-than-expected labour market data and (UK) wage figures. The 10Y US Treasury yield is now back below the 410bp level while swaps curves have flattened driven by the long end. In FX markets intraday moves were limited albeit with a slight unusual outperformance-combination of Scandies and CHF while the JPY and GBP underperformed. EUR/USD rose during yesterday's session towards 1.1600 but has fallen towards 1.1575 overnight.
EUR/USD Daily Outlook
Daily Pivots: (S1) 1.1551; (P) 1.1578; (R1) 1.1610; More…
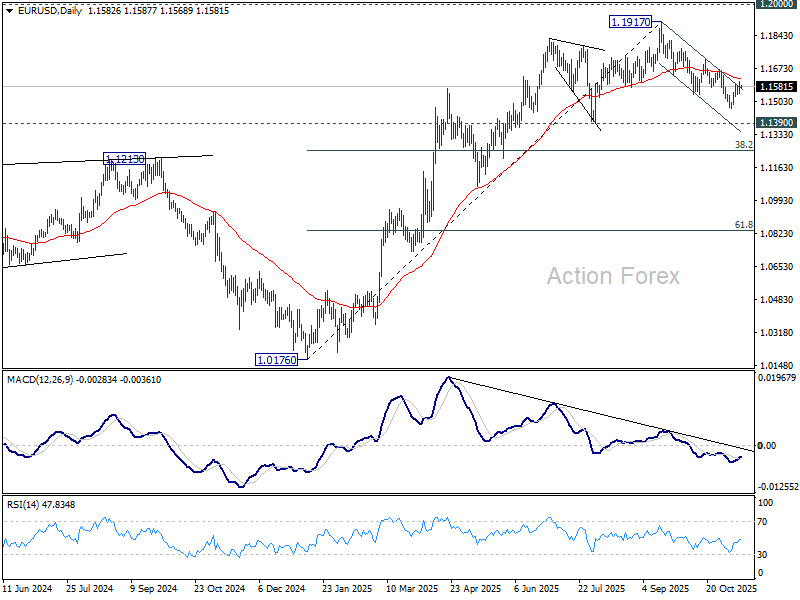
Intraday bias in EUR/USD stays neutral at this point. Further decline remains mildly in favor below 55 D EMA (now at 1.1620). Break of 1.1467 support will resume the decline from 1.1917 to 1.1390 support next. However, sustained trading above 55 D EMA will argue that fall from 1.1971 has completed as a correction only, and bring further rise to 1.1727 resistance next.
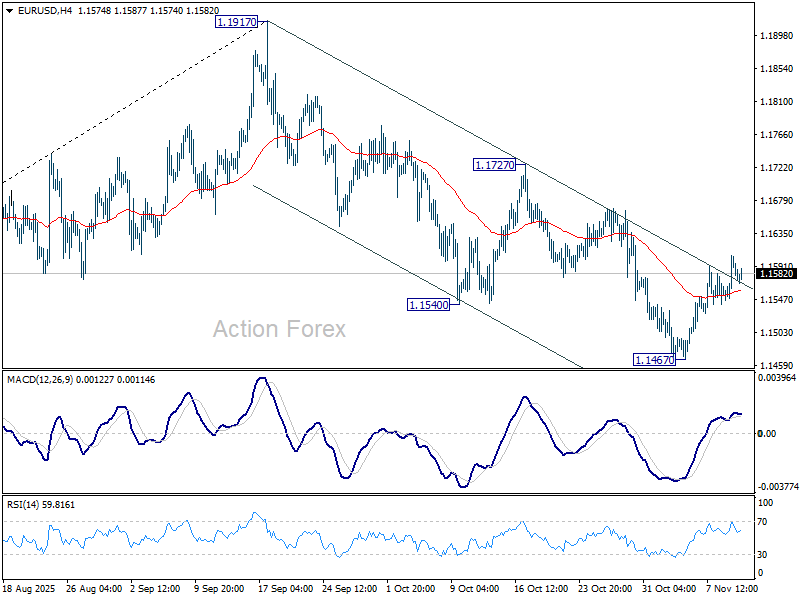
In the bigger picture, considering bearish divergence condition in D MACD, a medium term top is likely in place at 1.1917, just ahead of 1.2 key psychological level. As long as 55 W EMA (now at 1.1306) holds, the up trend from 0.9534 (2022 low) is still expected to continue. Decisive break of 1.2000 will carry larger bullish implications. However, sustained trading below 55 W EMA will argue that rise from 0.9534 has completed as a three wave corrective bounce, and keep long term outlook outlook bearish.
USD/JPY Daily Outlook
Daily Pivots: (S1) 153.72; (P) 154.11; (R1) 154.54; More...
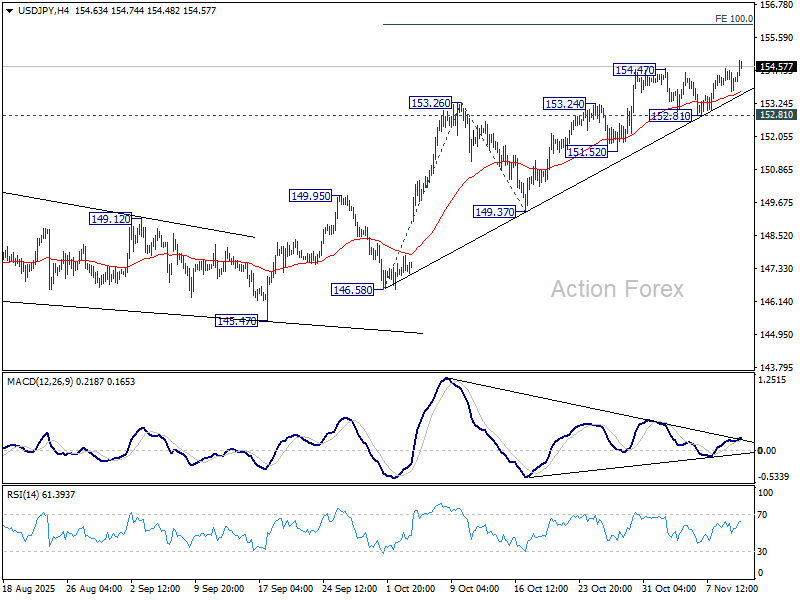
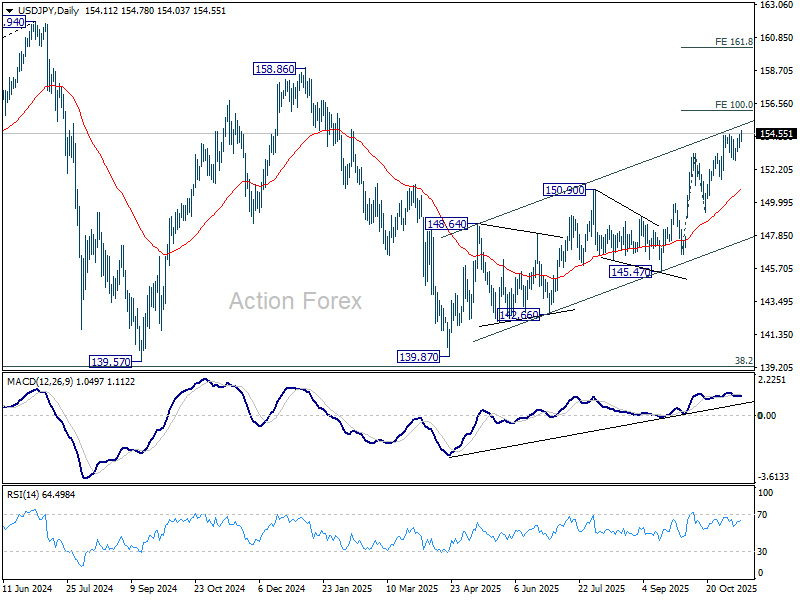
Intraday bias in USD/JPY is back on the upside with break of 154.47. Rise from 139.87 is resuming and should target 100% projection of 146.58 to 153.26 from 149.37 at 156.05. For now, near term outlook will stay bullish as long as 152.81 support holds, in case of retreat.
In the bigger picture, current development suggests that corrective pattern from 161.94 (2024 high) has completed with three waves at 139.87. Larger up trend from 102.58 (2021 low) could be ready to resume through 161.94 high. On the downside, break of 149.37 support will dampen this bullish view and extend the corrective pattern with another falling leg.
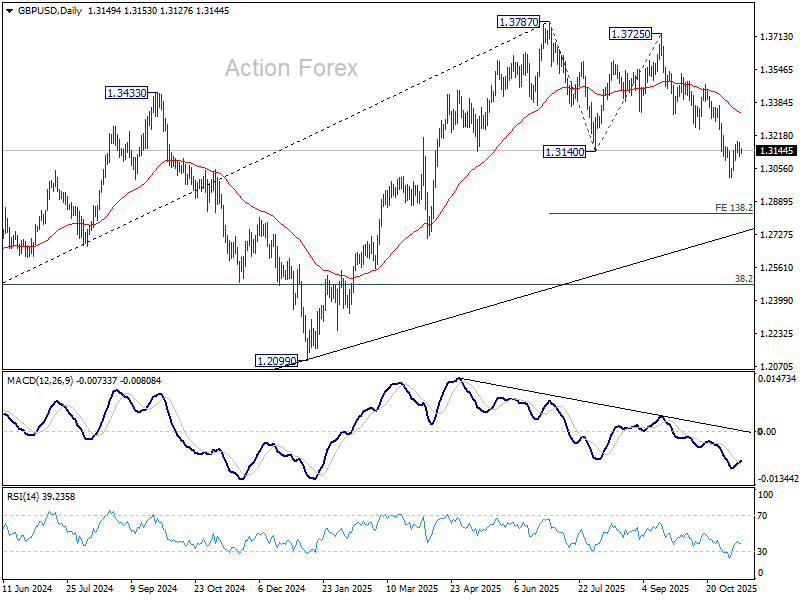
GBP/USD Daily Outlook
Daily Pivots: (S1) 1.3116; (P) 1.3150; (R1) 1.3184; More...
Range trading continues in GBP/USD and intraday bias stays neutral. More consolidations could be seen but further decline is expected as long as 1.3247 support turned resistance holds. Break of 1.3008 will target 138.2% projection of 1.3787 to 1.3140 from 1.3725 at 1.2831. Nevertheless, firm break of 1.3247 will suggest that fall from 1.3787 has completed as a corrective move already.
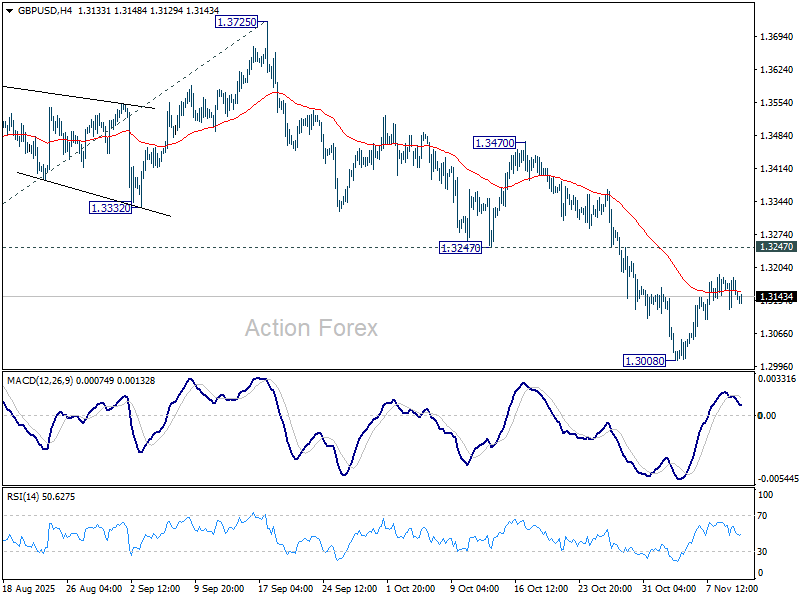
In the bigger picture, the break of 55 W EMA (now at 1.3185) is taken as the first sign that corrective rise from 1.0351 (2022 low) has completed. Decisive break of trend line support (now at 1.2780) will solidify this case and target 38.2% retracement of 1.0351 to 1.3787 at 1.2474 next. Meanwhile, in case of another rise, strong resistance should emerge below 1.4248 (2021 high) to cap upside to preserve the long term down trend.