Sample Category Title
S&P 500 (SPX) Eyes Fresh All-Time High in Wave (5)
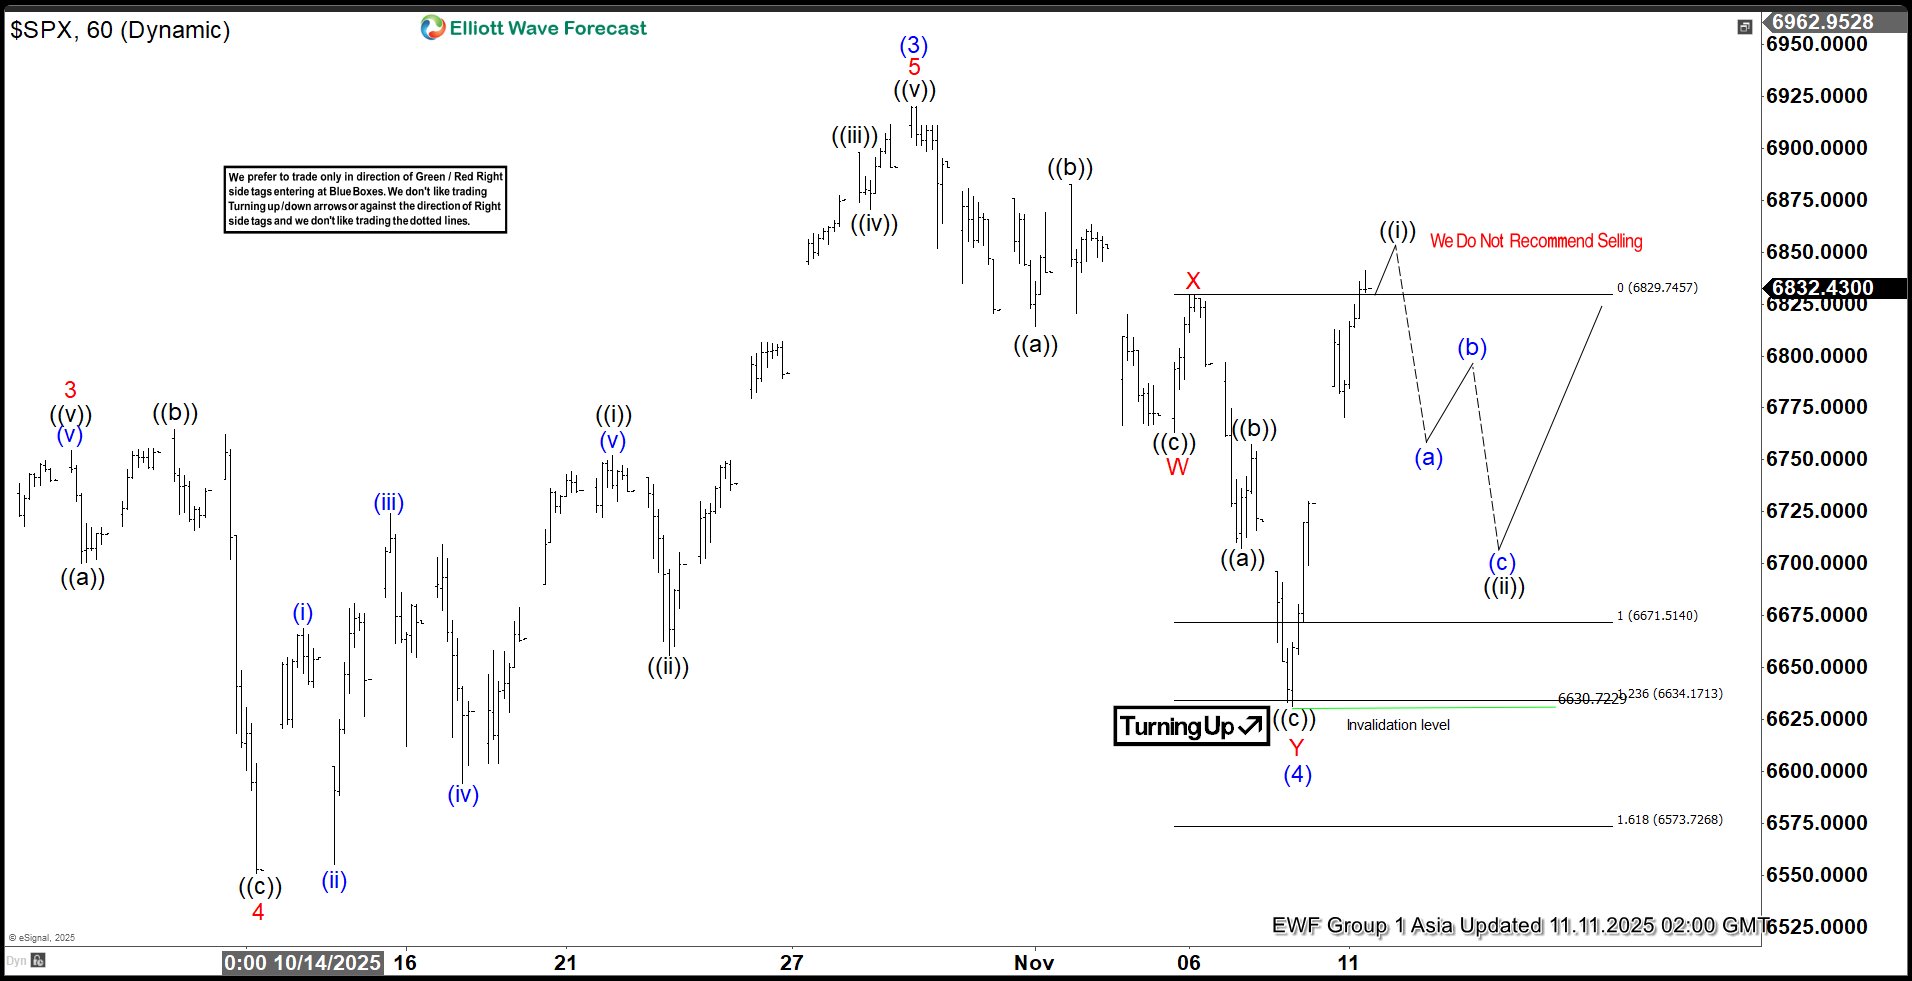
The ongoing cycle in the S&P 500 Index (SPX), originating from the April 2025 low, continues to unfold as an impulsive structure. The advance to 6920.21 marked the completion of wave (3) within this impulse, as illustrated in the accompanying one-hour chart. Subsequently, the market entered a corrective phase in wave (4), which developed as a double three Elliott Wave pattern.
From the termination of wave (3), wave ((a)) declined to 6814.26, followed by a recovery in wave ((b)) to 6882.32. The Index then resumed its descent in wave ((c)), reaching 6763.11 and thereby completing wave W of a higher degree. A corrective rally in wave X ensued, peaking at 6829.78. Thereafter, the Index turned lower again, initiating wave Y as a lower-degree zigzag.
Within wave Y, wave ((a)) bottomed at 6707.51 and wave ((b)) rebounded to 6757.63. Wave ((c)) extended downward to 6630.72, finalizing wave Y of (4). The Index has since begun to rise in wave (5). However, a decisive break above the wave (3) high at 6920.21 remains necessary to invalidate the possibility of a double correction. From the wave (4) low, wave ((i)) is nearing completion. A pullback in wave ((ii)) is anticipated to correct the cycle from the November 8, 2025 low, likely unfolding in a 3, 7, or 11 swing sequence. In the near term, provided the pivot at 6630.72 remains intact, any pullback should find support within the expected swing structure, paving the way for further upside continuation.
SPX 1-Hour Elliott Wave Chart From 11.11.2025
SPX Elliott Wave Video
https://www.youtube.com/watch?v=jHbeXtd9xbg
Sentiment is Everything
Sentiment is everything. That’s exactly what we’re seeing at the start of this week. Just last week, strong earnings from S&P 500 companies beat expectations — yet their stock prices fell in reaction, dragging the market lower. Even lower yields failed to lift appetite.
Monday, TSMC announced 16.9% sales growth last month – the lowest since February 2024 – yet its stock rose 1% yesterday and is only slightly down by 0.34% at the time of writing. Nvidia, on the other hand, jumped nearly 6% on Monday, erasing more than half of last week’s heavy losses, while the S&P 500 closed 1.5% higher.
For TSMC and Nvidia, I suspect that the weekend picture of Jensen Huang and TSMC Chief CC Wei — smiling with their thumbs up — may have softened the blow of the slowing sales figure, along with the fact that analysts expected around 16% growth anyway. And for the rest, it’s the US government shutdown story — finally showing some light at the end of the tunnel.
And that’s exactly what sentiment is about. It’s how investors perceive the news: if they’re in a good mood, they interpret it positively; if they’re in a bad mood, they see it negatively. One picture, one word, one data point is enough to twist and turn market mood. And right now, that mood is being shaped more by US political shenanigans — which have led to an economic data drought and uncertainty about the Federal Reserve’s (Fed) strategy — than by earnings. If that helps...
The S&P 500 and Nasdaq both gained yesterday, with the Nasdaq jumping more than 2%, followed by strong gains in Asian technology stocks. Futures are slightly negative this morning, as Asia’s tech-heavy indices – like the Kospi and Topix – give back early gains.
Maybe Nvidia-backed CoreWeave’s results are partly to blame: despite a narrower-than-expected loss, their net interest expense tripled from a year ago to more than $300 million, and they’ll have to delay a data center due to a third-party issue, which will reduce annual revenue. That might reignite concerns about the massive debt and distant returns tied to AI investments. Who knows.
For those who still like the idea of diversified exposure, Japan’s government is about to loosen the purse strings and invest in 17 ‘key’ areas including AI, defense and critical minerals. The cheap yen, meanwhile, makes Japanese champions — though less exciting than their US peers — more affordable. But it’s wise to hedge against further yen depreciation, as verbal interventions – like last week’s – tend to have only a short-lived effect in pushing the bears away. The proof: they’re back in force, testing the levels that triggered those comments last week. And sorry to say this, but if left alone, the USDJPY would go to 160. Voilà.
Looking at the other leg of the USDJPY, the US dollar failed to attract buyers on news of the potential end of the government shutdown. But since the dollar strengthened during the shutdown — which was unexpected in itself — it would be only half-surprising to see it give back some gains now that the government is set to reopen.
Another odd move came from gold. The metal rallied nearly 3% yesterday – outperforming even the Mag7 stocks – whereas you’d normally expect gold to retreat amid better risk-taking and higher US yields, which raise the opportunity cost of holding it. But all that is out the window. Gold is acting like a meme stock, hinting that the last mile of the year could be more unpredictable than predicted.
And speaking of the government reopening — that’s great news! Not only because many federal employees will return to work, get paid and spend, but also because investors will finally receive a flood of economic data. Data that will help them gauge the health of the US economy, assess the jobs market and see whether inflation is picking up momentum — all of which will help them readjust bets ahead of the Fed’s December meeting, ultimately influencing the stock prices of the world’s favourite companies.
Right now, Fed futures assign only a 63.5% chance of a December rate cut. But that could change a hundred times in the coming days as the end of the shutdown brings a deluge of data all at once. In the best-case scenario, investors will get jobs and inflation figures in time to position for the next Fed decision. In the worst case, some data – including CPI – could be missing. If that’s the case, the Fed would be better off delaying its move by a month rather than cutting and regretting it later. They did that in September 2024, and it didn’t go well. But I’m not the Fed, and I’m not under political pressure — I’m just saying that would be the ideal response in an ideal world. And we’re far from that.
But who cares? The market is doing well. US indices are near all-time highs. Private data points to a cooling US labour market and slowing October inflation. I’m referring here to a Bloomberg article citing OpenBrand and PriceStats data — from companies few have heard of — but they serve as an imperfect indication of what may be happening with price pressures. The theory is that businesses are refraining from raising prices, faced with price-wary consumers. If the official data confirms that – slowing jobs, contained inflation – you can pop the champagne and enjoy the holiday season! If not, you can always buy the dip.
Markets Rally as Reopen Nears
In focus today
In the UK, the monthly labour market report is released today. Payrolls have declined throughout the year, but the pace has been modest and not too worrying. Wage growth has been edging lower but remains elevated. After last week's decision from the BoE to wait for more info before cutting rates further, we will look for signs on particularly easing wage pressures.
In Germany, the ZEW indicator will give the first hint of sentiment in November of the German economy. The assessment of the current situation has been declining in the past three months but is expected to show a small improvement. Expectations have remained at a decent level this year despite some volatility and consensus is looking for a marginal rise.
Economic and market news
What happened overnight
In the US, the Senate passed a bill on Monday to end the longest government shutdown in US history, with nearly all Republicans and eight Democrats supporting the deal. The bill restores funding for federal agencies, prevents additional layoffs until 30 January 2026, and funds the SNAP food aid programme through September 2026. However, the agreement does not guarantee an extension of ACA subsidies, with a vote on the issue scheduled for December. The bill now moves to the House for approval before heading to President Trump for his signature.
In markets, optimism over a potential end to the record-breaking US government shutdown supported risk sentiment on Monday, with stocks rebounding and Treasury yields rising. The S&P 500 rose 1.54%, while the Nasdaq jumped 2.27%, driven by strong performance in tech and airline stocks. However, health insurers declined after the Senate deal excluded an extension of ACA subsidies. Investors now anticipate the release of delayed economic data, which is expected to clarify growth prospects and guide the Fed's December rate decision. Liquidity pressures in money markets are also likely to ease as the shutdown ends.
What happened yesterday
In the US, Federal Reserve Bank of St. Louis President Alberto Musalem (voter, hawkish) was on the wire and highlighted the resilience of the economy and inflation nearing 3%, slightly above the 2% target. He stressed the need for a cautious approach to monetary policy to ensure inflation is reduced.
In the euro area, the Sentix Investor Confidence indicator unexpectedly declined to -7.4 in November (cons: -4.0) from -5.4 last month. Sentix is the first indicator for confidence in November and suggests that sentiment has declined a bit in November although the level itself is quite similar to the past three months.
In Norway, core inflation surprised strongly to the upside at 3.4% y/y, expected 3.0%. Details revealed that the surprise stemmed mainly from higher imported inflation, contributing +0.3 pp. compared to expectations. As the NOK has remained fairly stable over the summer and global goods inflation remains muted, this looks a lot like price adjustments ahead of the upcoming Black week discounts. Unfortunately, we need to see at least the November figure to test our suspicion. The figure was higher than Norges Bank expected in the latest MPR and led to higher rates and a stronger NOK.
In Denmark, CPI inflation declined to 2.1% y/y in October from 2.3% in September, against our 2.2% expectation. Electricity prices increased by 15.9% on the back of reintroduction of winter tariffs but also higher spot prices. The pressure on food prices looks to decline somewhat with a 0.4% m/m decline. Seasonality would also suggest a small decline.
In Sweden, activity data for September showed continued strength in production and consumption. According to the monthly measures, Q3 concluded with robust growth rates, slightly exceeding our expectations. The September data confirmed the strong GDP flash for Q3 (1.1% q/q, 2.4% y/y) and suggests that the Swedish economy made significant progress in early autumn.
In Switzerland, reports suggest that the country is nearing an agreement with the US to secure a reduction in tariffs on its exports to 15%, down from the 39% levy imposed in August. According to sources, a deal could be finalised within two weeks, though talks remain ongoing. President Trump has confirmed efforts to lower tariffs to support Switzerland.
Equities: Global equities kicked off the week in a remarkably strong tone, led by significant cyclical outperformance and broad-based gains across indices. While headlines were quick to attribute the move to expectations of an imminent end to the US government shutdown, the real drivers run deeper. As we highlighted yesterday, this rally is not about the shutdown itself; it is about a supportive macro backdrop driven by three key factors: improving macro momentum, a strong earnings season, and a Federal Reserve on a path towards loosening monetary policy. That combination explains the magnitude of yesterday's move after nearly a month of sideways drift in equities. The sector pattern was textbook: cyclicals, growth, and momentum stocks led the rally, while the only red spot on the screen was consumer staples.
This sends a clear message to investors: you need to decide whether you believe in the persistence of a solid macroeconomic and earnings environment. If you do, cyclicals and growth stocks are likely to continue to outperform, while defensives and low-beta sectors will lag. We are not at an inflection point that suggests a broad rotation; rather, it is a question of your macroeconomic outlook. And let's be honest, much of the outlook depends on the US labour market. If you get the US labour market call right for the rest of the year, you are likely to have your overall asset allocation strategy right as well. In the US yesterday: Dow +0.8%, S&P 500 +1.5%, Nasdaq +2.3%, and Russell 2000 +0.9%. Asian equities are trading slightly in the red this morning, while European futures point higher, and US futures are hovering around unchanged.
FI and FX: Global yields continue to move marginally higher on rising optimism as to the near-term prospects for an end to the US government shutdown. Yesterday's session marked an end to the last weeks' steepening pressure on USD and EUR swap curves as the short end underperformed the long end, driving an inter-day flattening. The flattening pressure was the most pronounced in NOK rates, where higher-than-expected core inflation data sent 2Y swap rates 7bp higher returning the 2s10s curve slope to new lows around -14bp. In FX space moves have been more modest, although cyclically sensitive currencies such as ZAR, AUD, NOK and NZD have all outperformed.
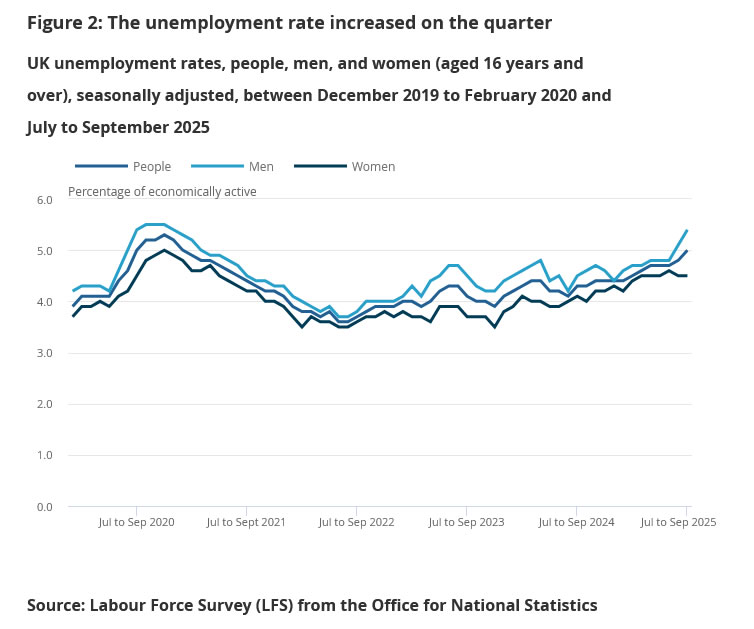
UK unemployment rate jumps to four year high, wages growth slow
UK labor market data released today showed further cooling, reinforcing expectations that the BoC would deliver another rate cut in December.
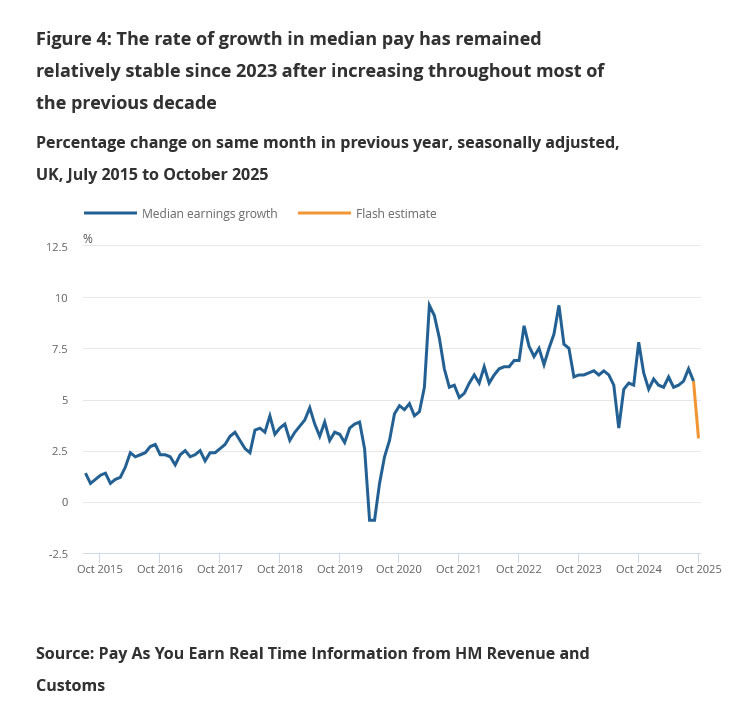
In October, Payrolled employment fell -0.1% mom, or -32k, while claimant count rose 29k, exceeding expectations of a 20.3k rise. Wage pressures also eased significantly. Median monthly pay grew just 3.1% yoy, sharply down from 5.9% previously and marking the weakest pace since mid-2020.
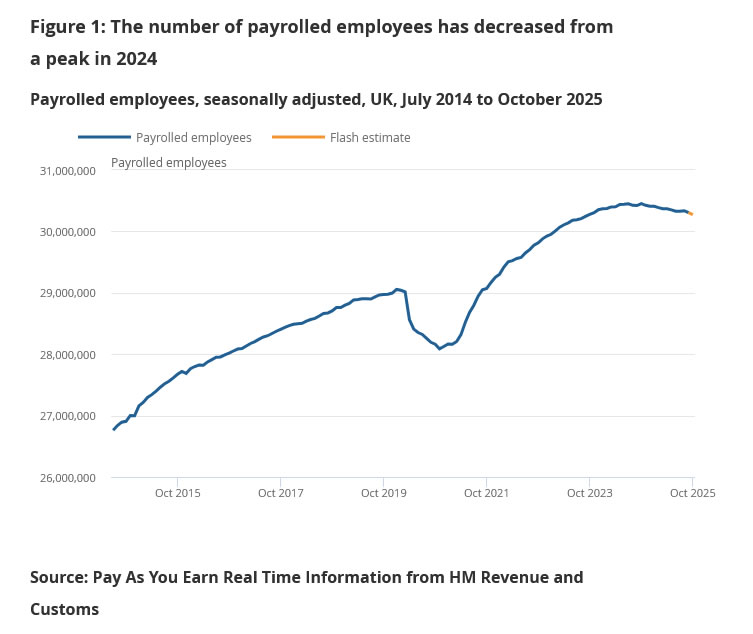
In the three months to September, unemployment rate climbed from 4.8% to 5.0%, the highest in four years. Average earnings growth slowed from 5.0% yoy to 4.8% including bonuses, and from 4.7% yoy to 4.6% excluding them. Both readings highlight that the pay cycle is losing momentum as inflation falls and labor slack builds.
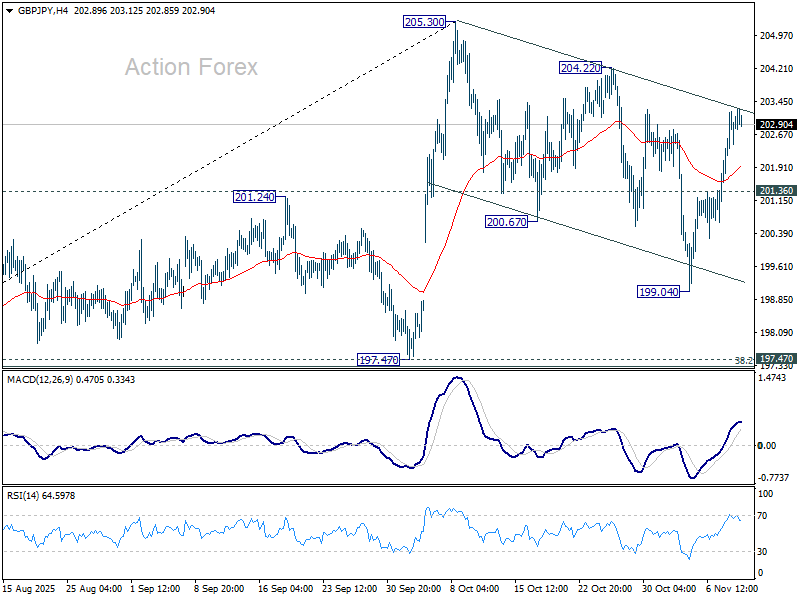
GBP/JPY Daily Outlook
Daily Pivots: (S1) 202.21; (P) 202.72; (R1) 203.63; More...
Intraday bias in GBP/JPY remains neutral first. On the upside, break of 204.22 resistance should confirm that correction from 205.30 has completed with three waves at 199.04. Further rise should be seen through 205.30 to resume the larger rally from 184.53. On the downside, below 201.36 minor support will turn bias to the downside to 199.04 and below to extend the correction.
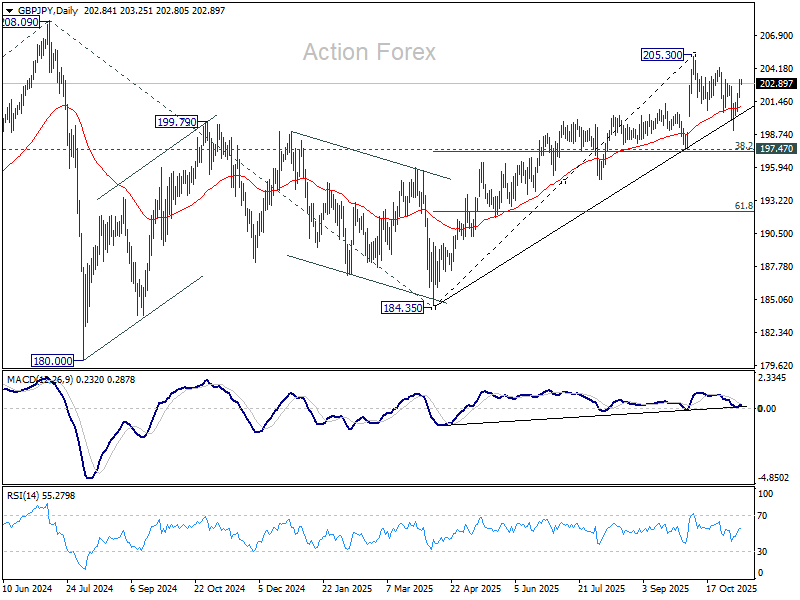
In the bigger picture, price actions from 208.09 (2024 high) are seen as a corrective pattern which might have completed at 184.35. Firm break of 208.09 high will resume the up trend from 123.94 (2020 low). Next target is 61.8% projection of 148.93 to 208.09 from 184.35 at 220.90. However, decisive break of 197.47 support will dampen this view and extend the corrective pattern with another fall.
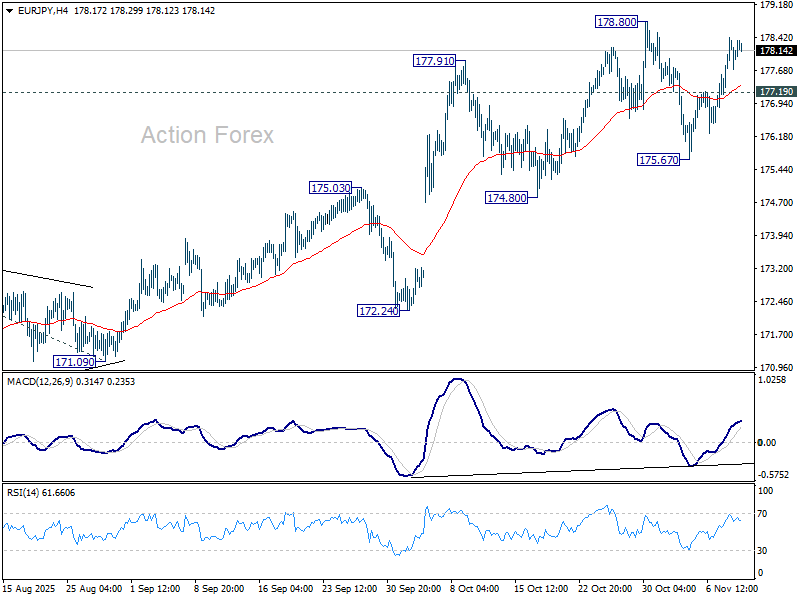
EUR/JPY Daily Outlook
Daily Pivots: (S1) 177.52; (P) 177.98; (R1) 178.63; More...
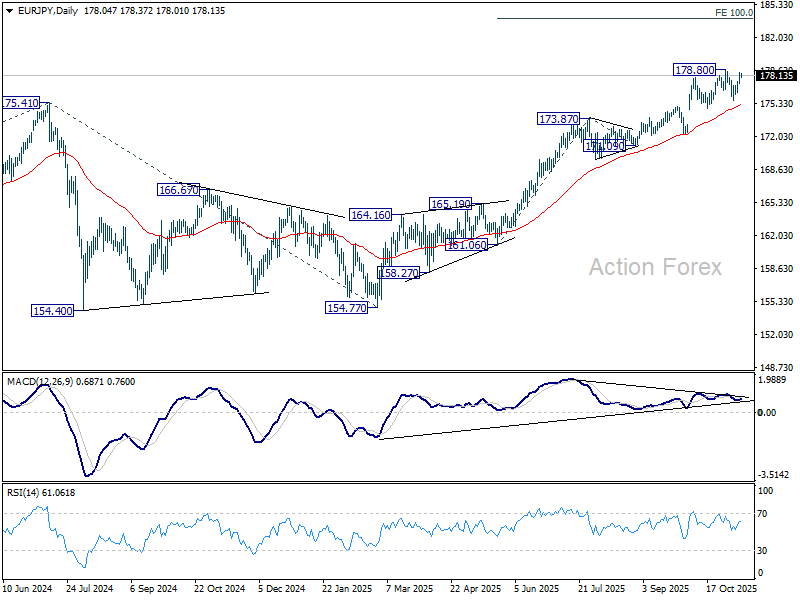
Intraday bias in EUR/JPY remains neutral as it's still staying in range below 178.80 resistance. On the upside, decisive break of 178..80 will resume larger up trend, next target is 100% projection of 161.06 to 173.87 from 171.09 at 183.90. On the downside, below 177.19 will bring deeper fall back to 175.67 support instead.
In the bigger picture, up trend from 114.42 (2020 low) is in progress and should target 61.8% projection of 124.37 to 175.41 from 154.77 at 186.31. However, firm break of 174.80 support will suggests that it has turned into consolidations first. But still, outlook will continue to stay bullish as long as 55 W EMA (now at 168.56) holds, even in case of deep pullback.
EUR/GBP Daily Outlook
Daily Pivots: (S1) 0.8762; (P) 0.8779; (R1) 0.8788; More…
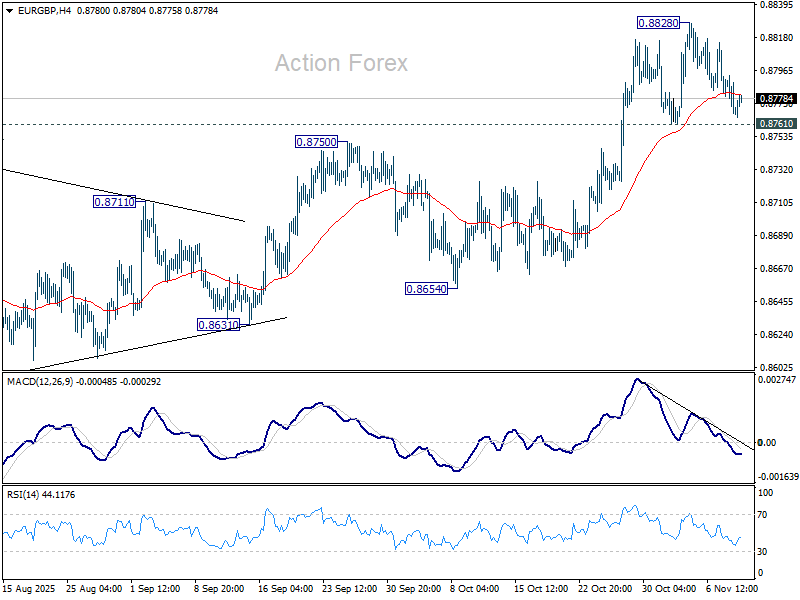
EUR/GBP is still bounded in consolidations below 0.8828 and intraday bias stays neutral. Further rally is expected as long as 0.8761 support holds. On the upside, break of 0.8828 will resume the whole rise from 0.8221 and target 0.8867 fibonacci level. Firm break there will carry larger bullish implications. However, considering bearish divergence condition in 4H MACD, decisive break of 0.8761 will confirm short term topping, and bring deeper fall to 55 D EMA (now at 0.8710).
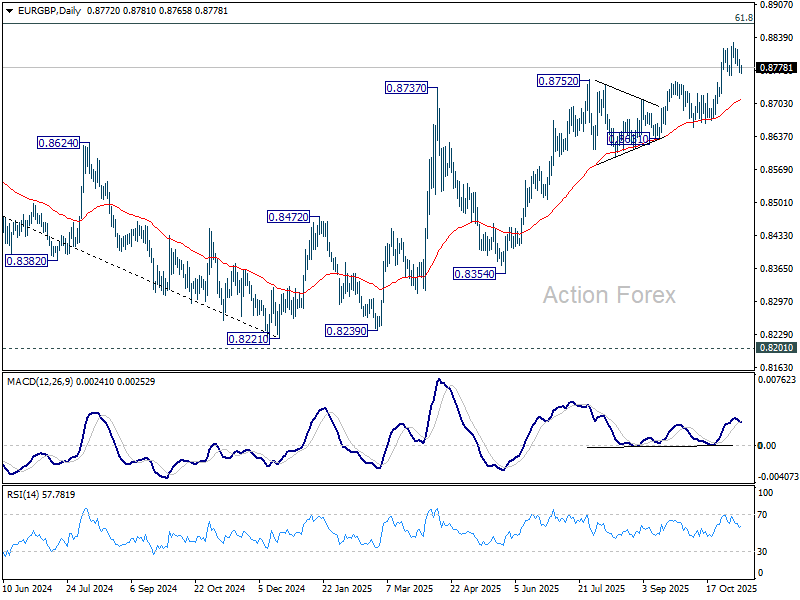
In the bigger picture, rise from 0.8221 medium term bottom is still seen as a corrective move. Upside should be limited by 61.8% retracement of 0.9267 to 0.8221 at 0.8867. Firm break of 0.8654 support will be the first sign that this corrective bounce has completed. However, decisive break of 0.8867 will suggest that EUR/GBP is already reversing whole decline from 0.9267 (2022 high).
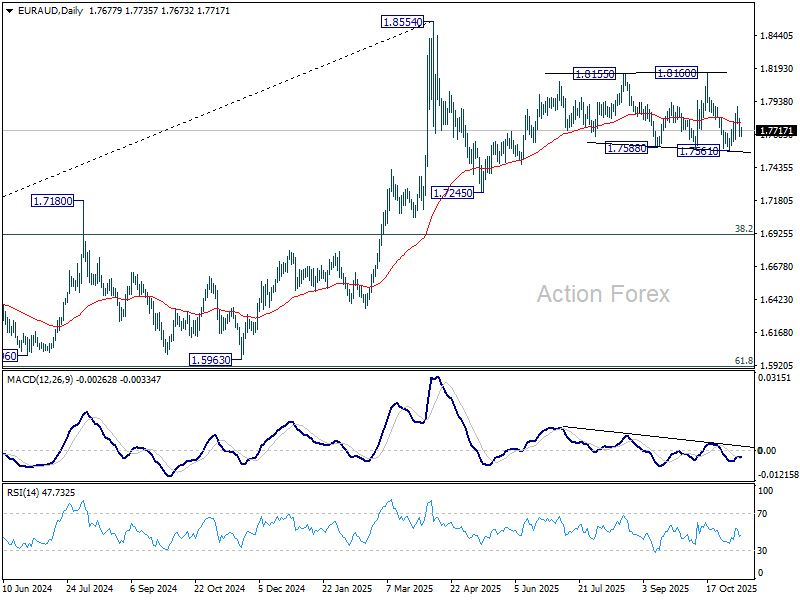
EUR/AUD Daily Outlook
Daily Pivots: (S1) 1.7634; (P) 1.7724; (R1) 1.7772; More...
Intraday bias in EUR/AUD remains neutral at this point. On the downside, break of 1.7561 support will revive the bearish case that corrective pattern from 1.8554 is in the third leg, and target 1.7245 support. On the upside, though, above 1.7895 will resume the rebound from 1.7561 to 1.8160 resistance next.
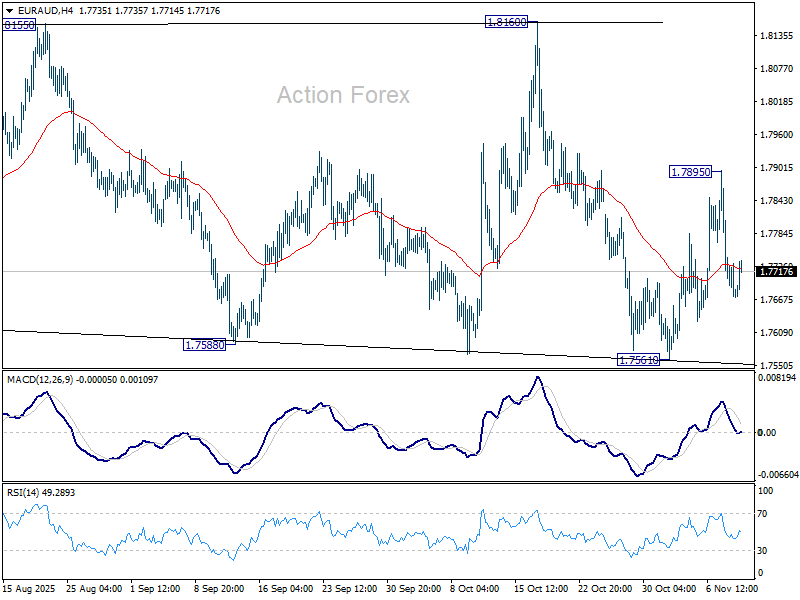
In the bigger picture, price actions from 1.8554 medium term top are seen as a corrective pattern. Sustained break of 55 W EMA (now at 1.7424) will suggest that it's correcting the whole rally from 1.4281 (2022 low). In this case, deeper decline would be seen to 38.2% retracement of 1.4281 to 1.8554 at 1.6922. Nevertheless, strong rebound form 55 W EMA will likely bring resumption of the up trend sooner.
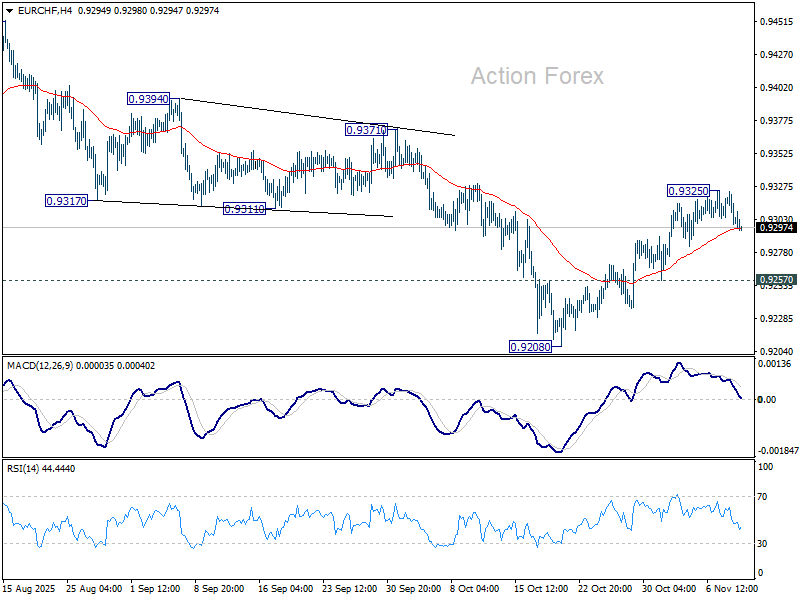
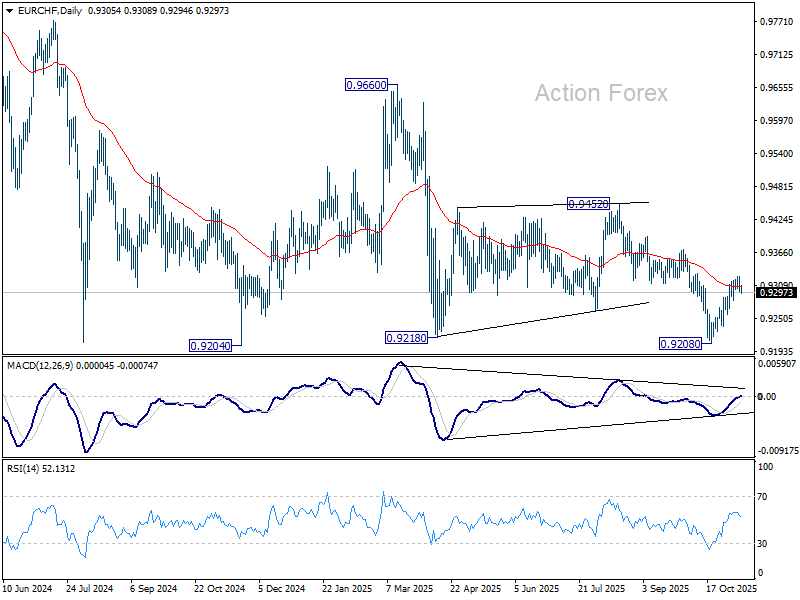
EUR/CHF Daily Outlook
Daily Pivots: (S1) 0.9295; (P) 0.9311; (R1) 0.9321; More....
Intraday bias EUR/CHF remains neutral at this point. More consolidations could be seen below 0.9325 first. On the upside, break of 0.9325 will target 0.9371 resistance. Break there will pave the way back to 0.9452 resistance next. On the downside, however, break of 0.9257 will revive near term bearishness, and bring retest of 0.9204/8 support zone.
In the bigger picture, outlook remains bearish with EUR/CHF staying well inside long term falling channel after multiple rejection by 55 W EMA (now at 0.9383). Firm break of 0.9204 will resume the whole down trend from 1.2004 (2018 high). Next target is 61.8% projection of 1.1149 to 0.9407 from 0.9928 at 0.8851. However, break of 0.9452 resistance will now be the first sign of medium term bottoming.
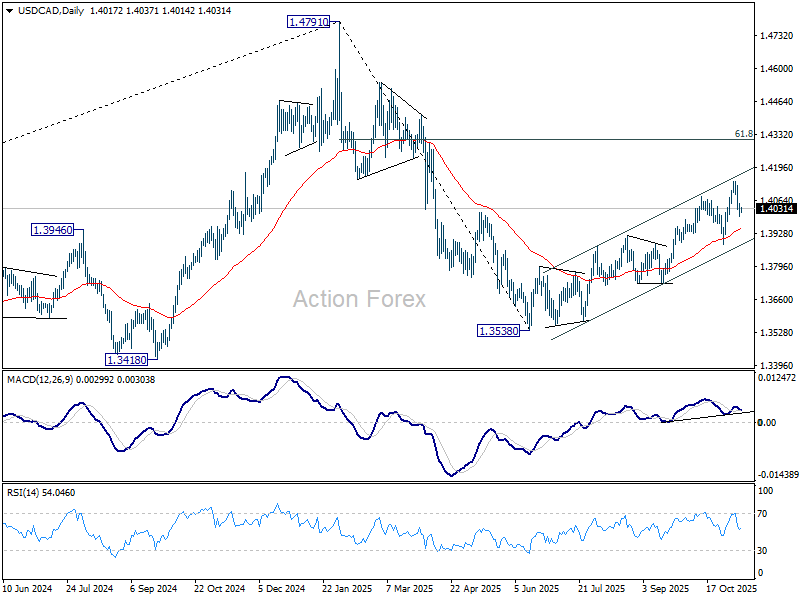
USD/CAD Daily Outlook
Daily Pivots: (S1) 1.3996; (P) 1.4027; (R1) 1.4053; More...
No change in USD/CAD's outlook and intraday bias stays mildly on the downside. . Fall from 1.4139 short term top would extend towards 1.3886 support. On the upside, break of 1.4139 will resume the rally from 1.3538 to 61.8% retracement of 1.4791 to 1.3538 at 1.4312.
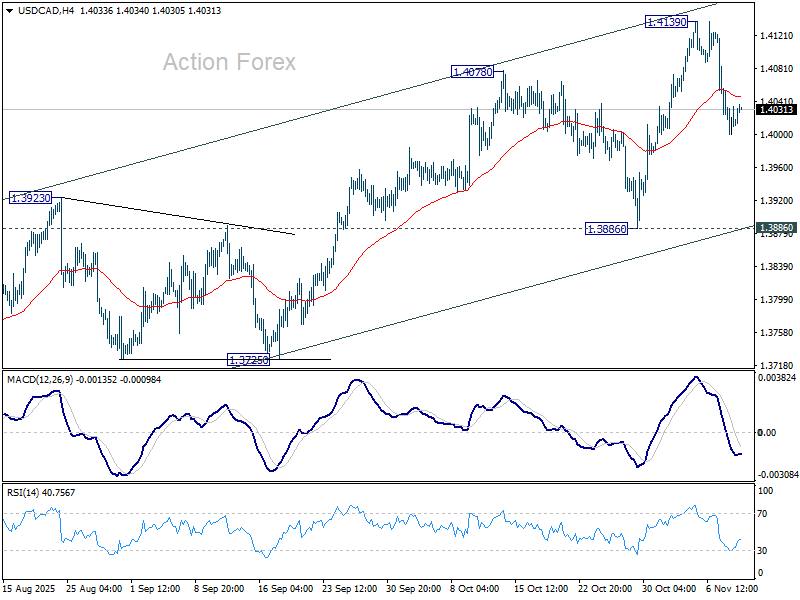
In the bigger picture, price actions from 1.4791 medium term top is likely just unfolding as a correction to up trend from 1.2005 (2021 low), with rise from 1.3538 as the second leg. A third leg should follow before up trend resumption. That is, range trading is set to extend for the medium term. For now, this will remain the favored case as long as 1.3886 support holds. However, firm break of 1.3886 will revive the case that fall from 1.4791 is indeed a larger scale correction.