Sample Category Title
Metal Rally Ignites: Silver Surges Back Above $50 Level
Metals attempt to retake their unforeseen 2025 run higher in today's wild session.
Higher than expected inflation, released on Oct 24 during to the BLS shutdown, brought back some calm in a squeezing metals market.
While Gold went from $4,380 to just below $3,900, marking a 10.80% correction, Silver moved even more sharply with a drawdown of 16%.
A comeback in the US Dollar and hawkish Fed repricings had severely hurt demand for metals.
However, this demand is now rapidly coming back as the yet-again pushed back government reopening is being priced for a Republican sweep, where more aggressive fiscal spending is widely expected to remain reckless.
This was one of the main proponent of the run in Gold and Silver throughout the beginning of the year.
Up about 4.50% as we speak, Silver is pressing its bullish momentum to close the opening session.
Let's dive into a multi-timeframe analysis from the Weekly to an intraday chart to spot where prices could be heading.
Silver (XAG/USD) multi-timeframe analysis
Weekly chart
Silver (XAG) Weekly chart, November 10, 2025 – Source: TradingView
As explained in our previous edition from a few weeks prior, the squeeze in Silver was so steep that many participants could not operate.
A run on the precious metal took its prices up close to 50% from Powell's Jackson Hole speech to its all-time highs ($54.48) in less than 50 days.
The consequent correction was deep but buyers nonetheless re-entered with force October 28th, right before the FOMC – The wick on the weekly candle created a bullish weekly hammer which promptly saw some follow through.
Failing to fill bids at the 50-week moving average, participants rushed in the market to not miss the ongoing rally which reinforced its strength; The metal is now up 10% from its $45.55 lows.
The current weekly candle is one of a bullish impulse which prompts further continuation – A test of the 2025 highs would be required to maintain the bullish scenario.
Daily Chart and levels
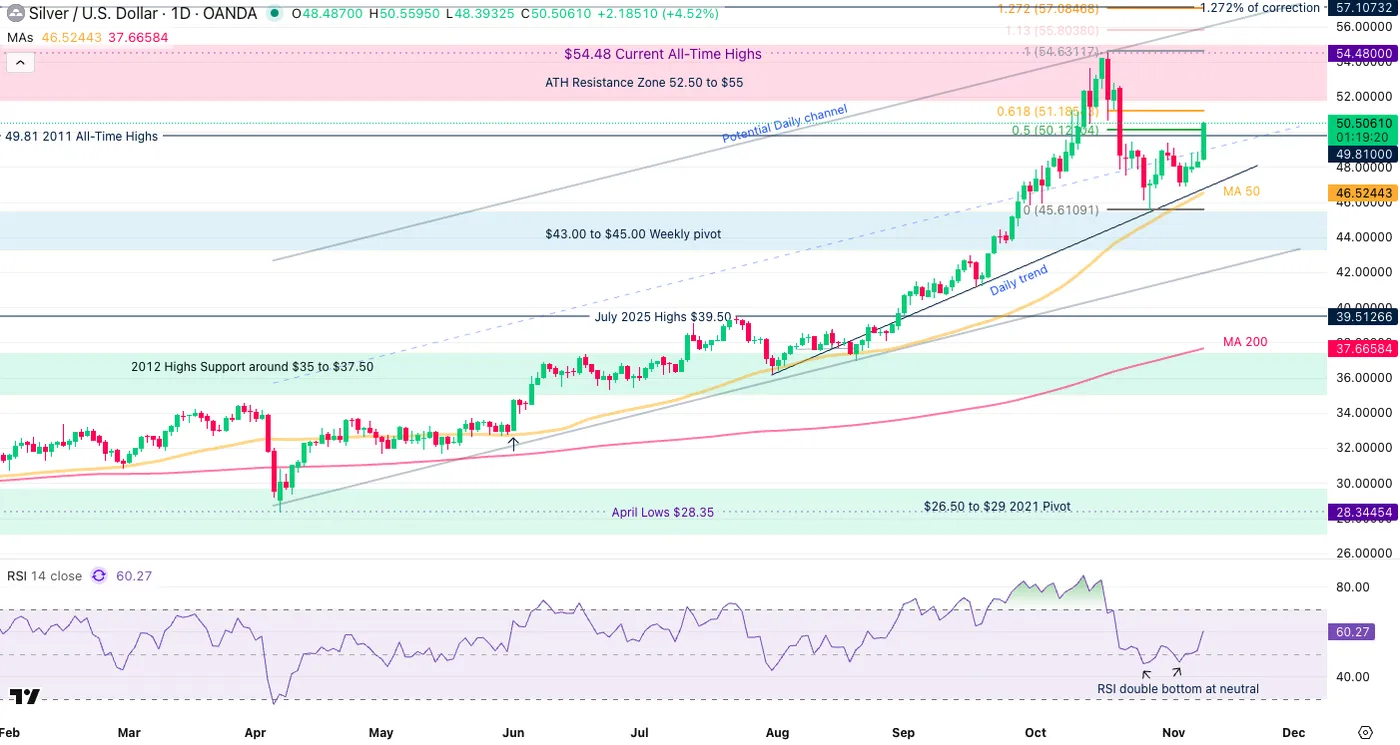
Silver (XAG) Daily chart, November 10, 2025 – Source: TradingView
Levels to watch for Silver (XAG) trading:
Resistance Levels:
- 2025 record $55.48
- $52 to $53 mini-resistance
- $50.50 to $51 mini-resistance at 61.8% fib of corrective move
- Potential resistance 1 $57.50 to $60 (1.382% from 2022 lows)
- Potential resistance 2 $62 to $65 (1.618 from Impulsive Move)
Support Levels:
- $48 to $49 2011 High Pivot
- $47 low of potential daily channel
- $45.55 October 28 lows
- $43.00 to $45.00 Weekly pivot
- $39.50 to $40 higher timeframe support
- 2012 Highs Support around $37.50
4H Chart
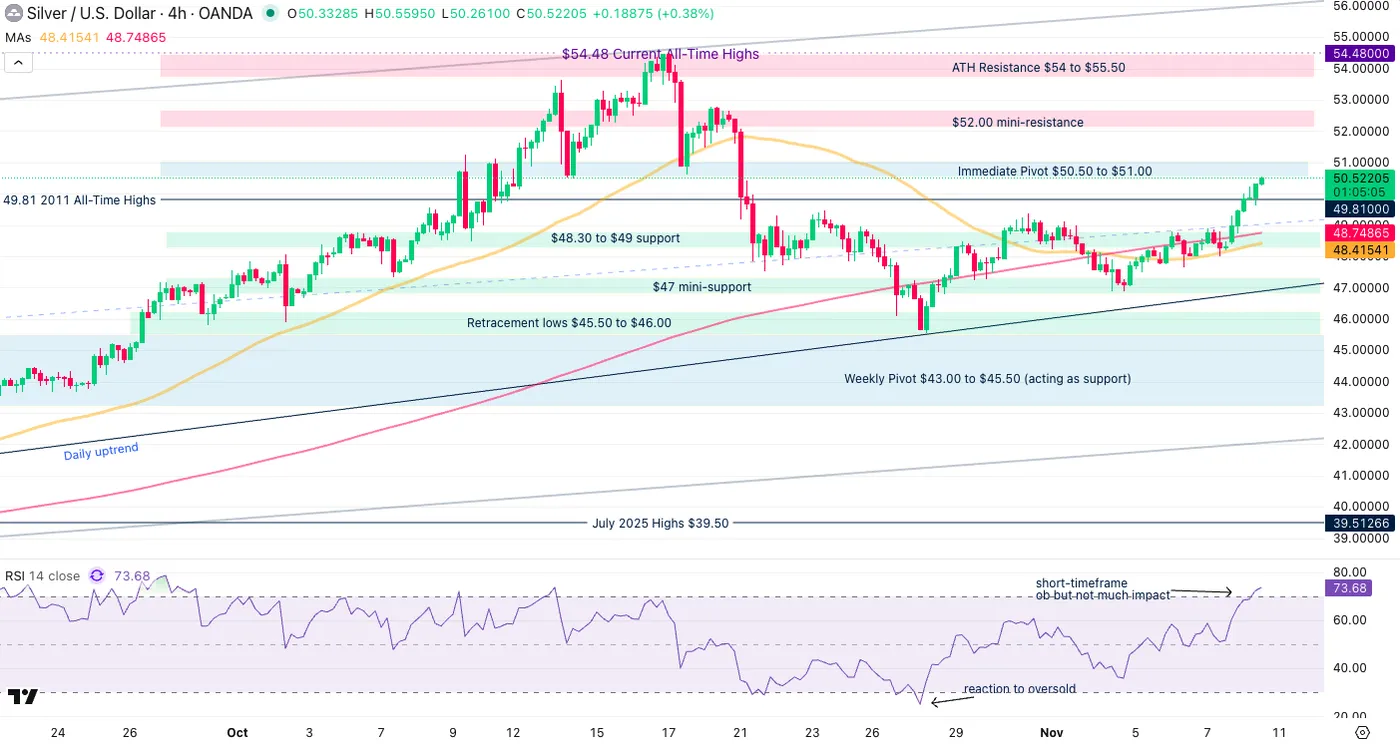
Silver (XAG) 4H chart, November 10, 2025 – Source: TradingView
Silver has put an impressive start to this week but is facing a critical lower timeframe test:
The 61.8% Fibonacci level from the end-October correction is creating an essential pivot zone between $50.50 and $51.
The candles are strong and not indicative of a pullback for now, however consolidation may ensue due to overbought levels.
A rejection here could still face support between $48.30 to $49, a support zone that includes the 50 and 200 4H-period MA.
A daily close at current levels would nonetheless assume that bears are absent of the battle – Keep a close eye on potential breakouts (or in a lack thereof, a small reversal).
Safe Trades!
Gold (XAU/USD) Price Forecast: Bullish Breakout Gathers Pace as Fed Pivot Expectations Firm, $4250/oz Incoming?
Gold prices saw a sharp rise at the start of the trading week. The precious metal is trading up around 2% on the day and holding near the 4100/oz handle.
Last week, new data (data from 3rd party sources) came out showing that the US economy lost jobs in October, particularly in government offices and retail stores. Adding to this bad news, a report on Friday showed that Americans felt much less confident about the economy in early November because families were worried about things getting worse financially.
Because of this weak data, financial markets now believe there is a 60% chance that the Fed will cut interest rates in December. By January, the chances of a rate cut increase even higher, to about 80%.
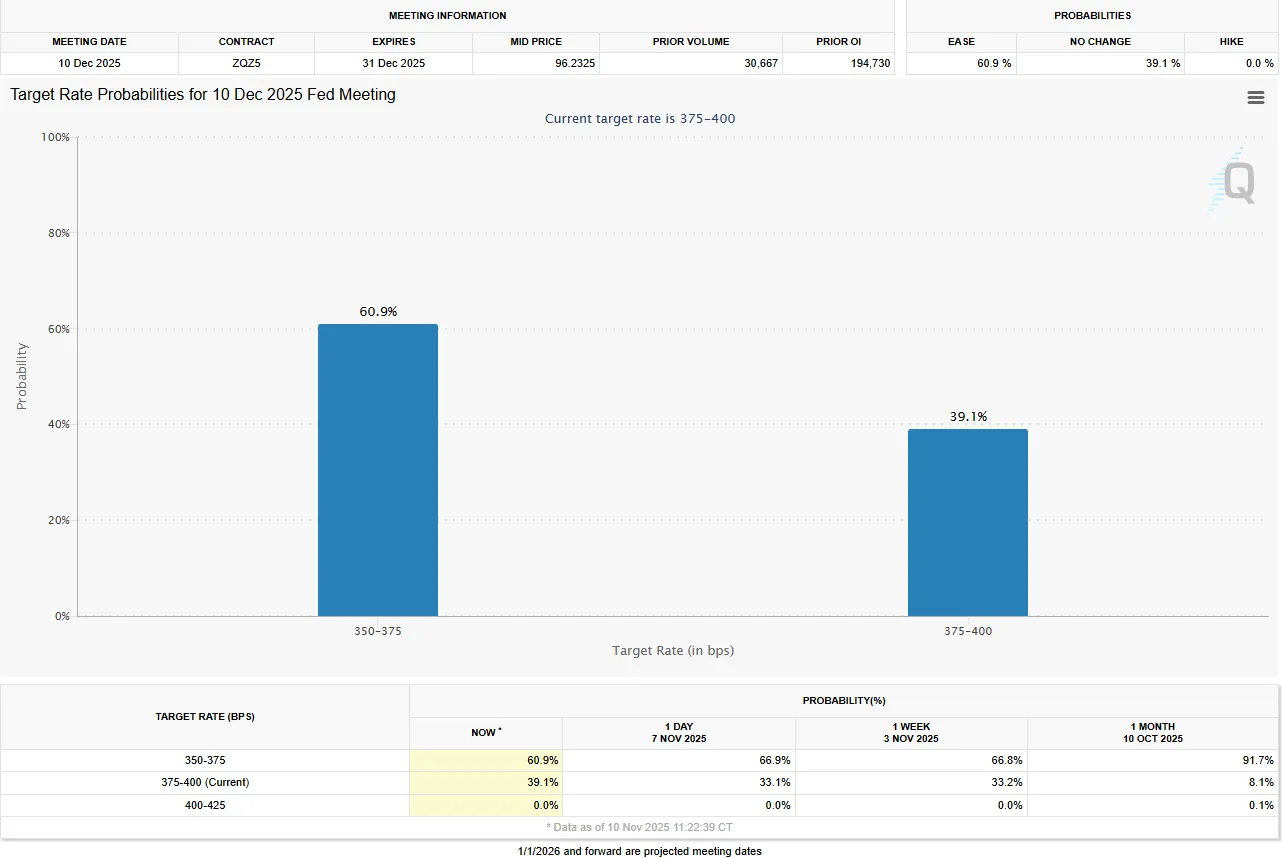
Source: CME FedWatch Tool
Market Dynamics and Correlation Analysis
The price of Gold (XAU/USD) jumped up even though the US Dollar was on the offensive at the start of the week.
Usually, when the US Dollar gets a little stronger, Gold's price goes down, but this time, Gold kept rising. This suggests that Gold's movement is currently being driven by specific issues inside the US, mainly changes in the Federal Reserve's interest rate policy and growing worries about the economy and not just the normal ups and downs of the dollar.
US Equities were also on the offensive at the same time as Gold, a trend that runs contrary to their traditional inverse correlation (where stocks fall and gold rises as a safe haven).
Everyone expects the Fed to cut rates, which is like injecting a lot of money into the system. This expected money boost helps two things at once: it makes the future earnings of companies (stocks) look more valuable, and it makes it cheaper to hold onto Gold.
Because of this new trend, Gold traders may be more inclined to now watch what major stock markets do, with influential stocks like Nvidia being very important for predicting where Gold will go next.
Technical Analysis - Gold (XAU/USD)
From a technical standpoint, Gold XAU/USD is decisively bullish in the immediate term, supported by a critical technical break and strong fundamental drivers tied to the perceived Fed pivot.
The current risk/reward profile favors long positions, provided the pivotal $4,000–$4,027 support band holds.
There is also a triangle pattern which was broken last week Thursday. The breakout has gathered pace today and could see Gold reach a target of around the 4250/oz handle if the pattern plays out as it should.
In the near-term, acceptance above the 4100/oz handle remains crucial for bulls who are looking for higher prices.
Immediate support rests at 4062 (100-day MA) before the 4050 and 4000 handles come squarely into focus.
Gold (XAU/USD) Four-Hour Chart, November 10, 2025
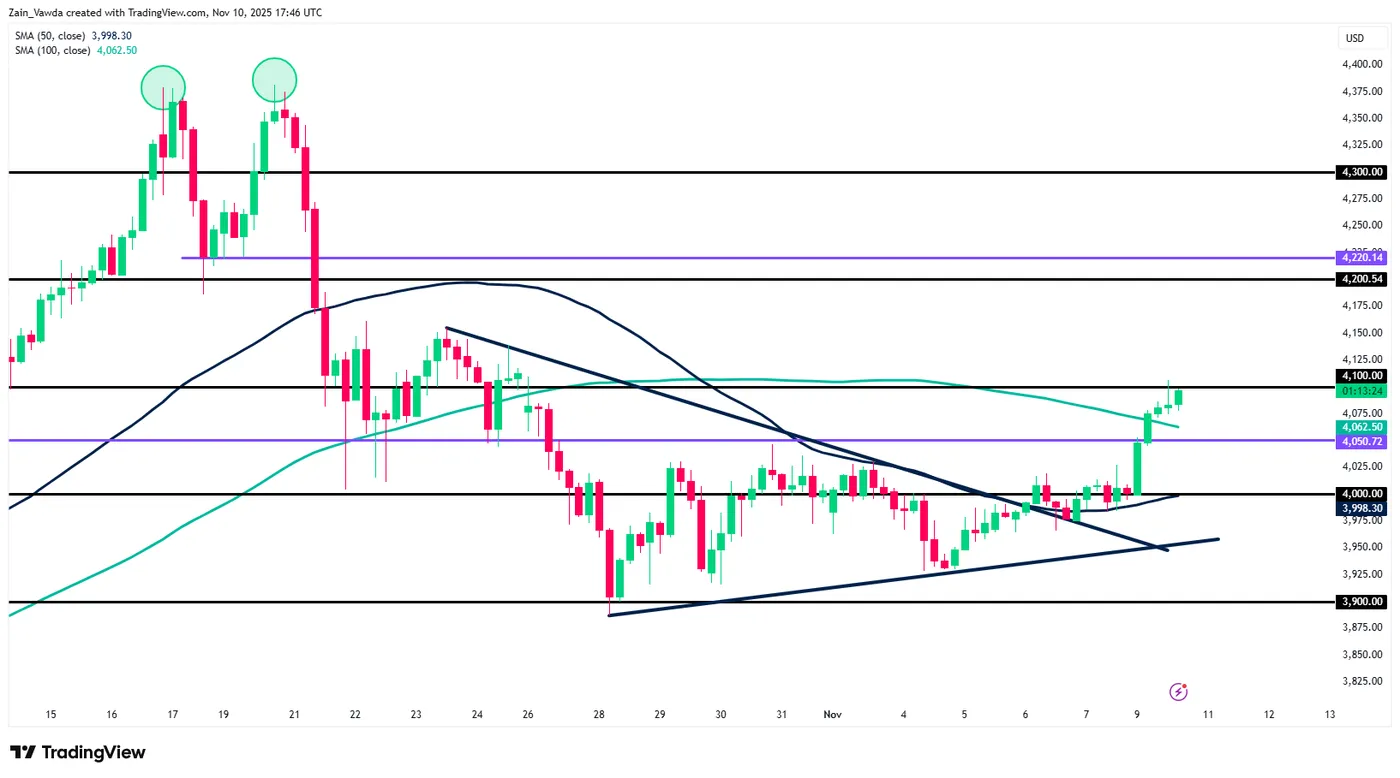
Source: TradingView (click to enlarge)
Client Sentiment Data - XAU/USD
Looking at OANDA client sentiment data and market participants are Long on Gold with 74% of traders net-long. I prefer to take a contrarian view toward crowd sentiment and thus the fact that the majority of traders are net-long suggests that Gold prices could continue to slide in the near-term.
Why End of US Shutdown Sparks a Huge Rally in Stocks
The political gridlock has finally broken. The US Congress has officially voted to reopen the federal government, providing an immediate positive catalyst for equities that is erasing the market blues of the past week.
The longest-ever government shutdown initially had a muted impact, but as its consequences—such as delays in key economic data, reduced flights, and halted essential functions—began to accumulate, markets took a noticeable negative turn last week.
However, the Senate's decisive vote on a compromise bill, which saw moderate Democrats break with their party leadership to make key concessions (such as securing a future vote on extending healthcare subsidies), has fueled today's optimism.
Participants are interpreting that a Republican sweep is expected to be an even greater booster for stocks.
Today’s sector dynamics are turning more bullish for tech-heavy firms: the market is green across all indices, heavily propelled by the "Magnificent Seven" stocks – notably Nvidia and Tesla, which are up by more than 3%.
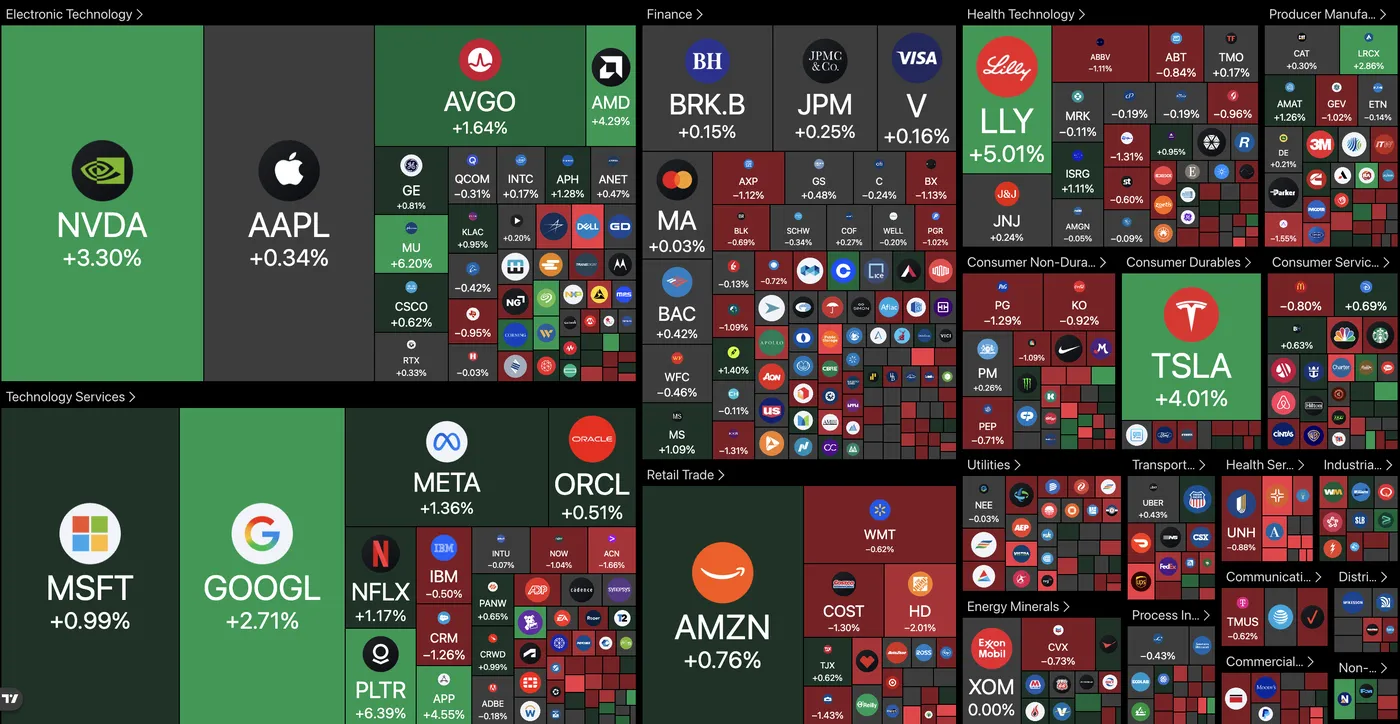
US Equity heatmap – November 10, 2025 – Source: TradingView
Conversely, more defensive sectors (like consumer staples, medical, and home appliances) are lagging.
An anticipation of a "Buffett retirement effect" could be hitting defensive names, which Berkshire Hathaway has traditionally sought throughout Buffett's tenure.
After a long and storied career, the 94-year-old value investing legend is expected to publish his official farewell letter today.
Elsewhere, Gold has rallied massively, while bonds have corrected.
This flow suggests that while the shutdown uncertainty is gone, the spotlight immediately pivots back to the deteriorating US fiscal outlook and the costs of the political concessions made to reopen the government, with Republicans dominating the outlook going forward.
This discomfort with fiscal sustainability continues to underpin the resilience of precious metals.
In any case, for now, the immediate action is bullish in US indices, but more so in the tech-heavy Nasdaq.
Let's observe intraday charts and key technical levels for the Dow Jones, Nasdaq, and S&P 500.
Dow Jones 8H Chart and technical levels
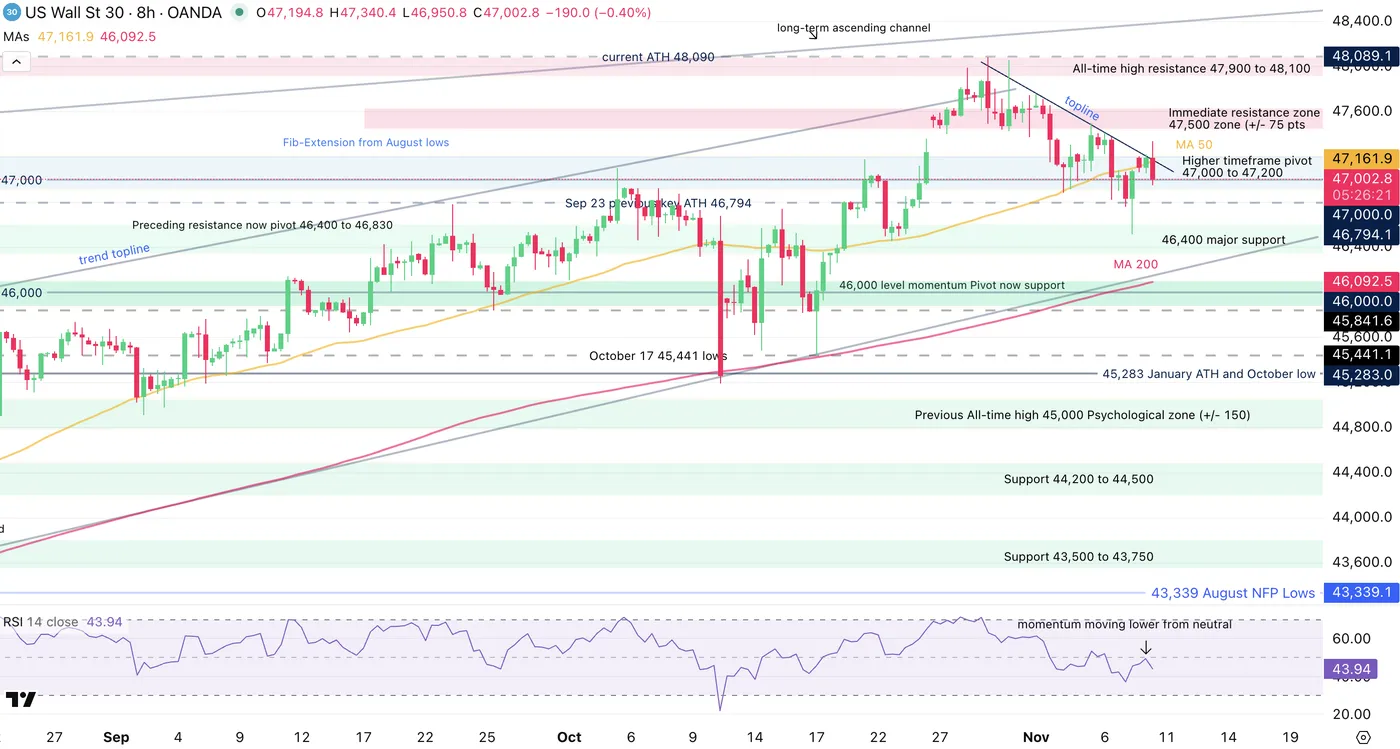
Dow Jones 8H Chart, November 10, 2025 – Source: TradingView
Despite the bullish overnight session and open for the Dow, the rotation from defensive sectors is hurting the industry-heavy index.
Sellers are bouncing off of the 50-period MA and short-term descending topline which may provide resistance for upside progress as long as prices remain below.
With momentum also rejecting the neutral RSI mid-line, selling seems to be taking the hand as I speak.
Look for the daily close: Above 47,000, buyers remain in control of the long-run trends.
Below however, the past week of downside may have a longer drag.
As indicated in our end-week Index outlook, for long-term investors, keep an eye on the 45,000 level to spot if the uptrend is prioritized.
Dow Jones technical levels of interest:
Resistance Levels
- Current All-time high 48,090
- 8H MA 50 and resistance at 47,500
- Session high 47,340
- ATH Resistance Zone 47,900 to 48,100
Support Levels
- Higher timeframe pivot 46,900 to 47,200
- 46,400 major support
- 46,000 higher timeframe Pivot now support
- 45,000 psychological level
- 44,400 to 44,500
- 46,950 session lows
Nasdaq 8H Chart and levels
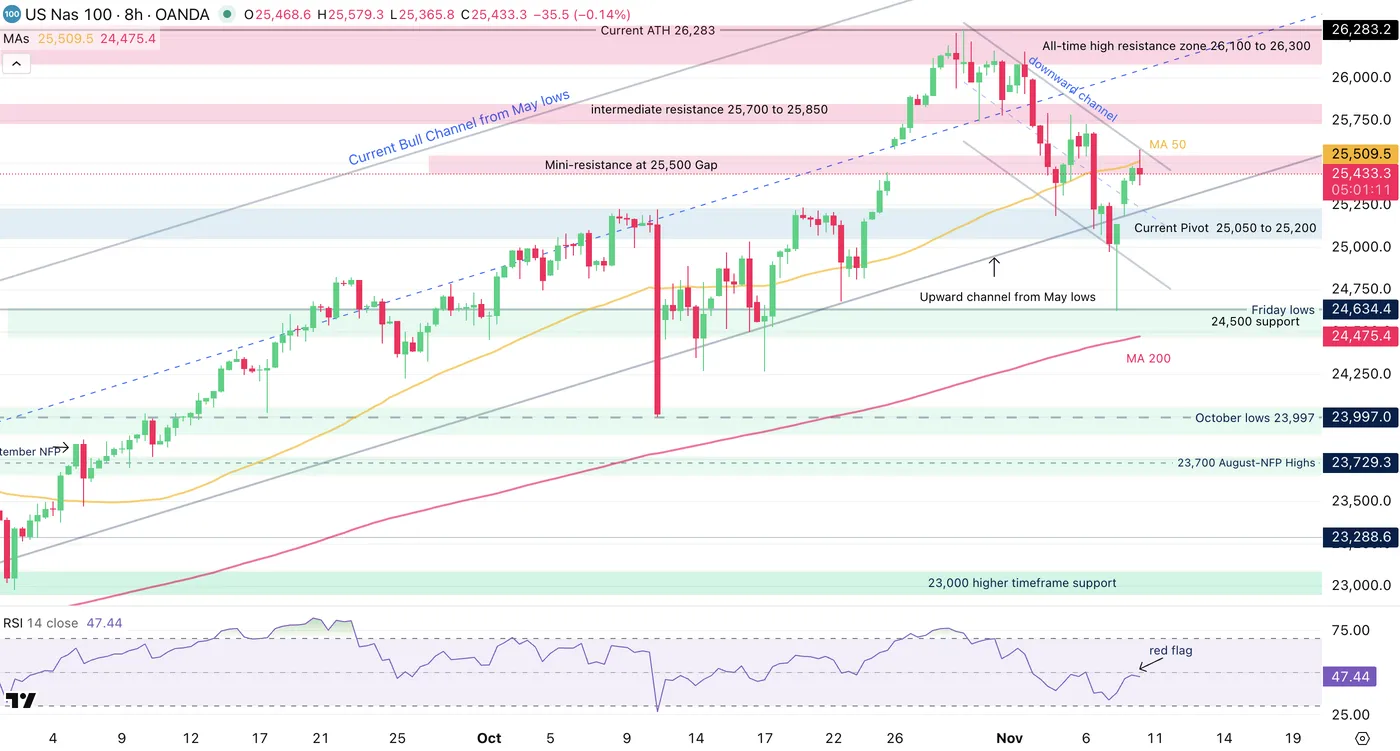
Nasdaq 8H Chart, November 10, 2025 – Source: TradingView
Despite the ecstatic overnight and opening trading, reactions to downside technical patterns (channel and 25,500 resistance) are leading to some downside.
Still, the actual index shows a strong gap higher and tech-leaders are pulling further in their lead.
A 2H 50-period MA is acting as immediate support and leading to some short-term buying.
Bulls will have to break and close above the 25,580 session highs to prompt further upside – Bears on the other hand will want a break below 25,365.
Nasdaq technical levels of interest:
Resistance Levels
- Current ATH 26,283 (CFD)
- All-time high resistance zone 26,100 to 26,300
- Intermediate resistance and 4H MA 50 25,700 to 25,850
- Mini-resistance at 25,500 Gap (immediate resistance)
- Session highs 25,580 and Channel top
Support Levels
- Current Pivot 25,050 to 25,200 (Tuesday lows 25,186)
- 24,500 intermediate support
- October lows 23,997
- Early 2025 ATH at 22,000 to 22,229 Support
- Session Lows 25,450
S&P 500 8H Chart and level
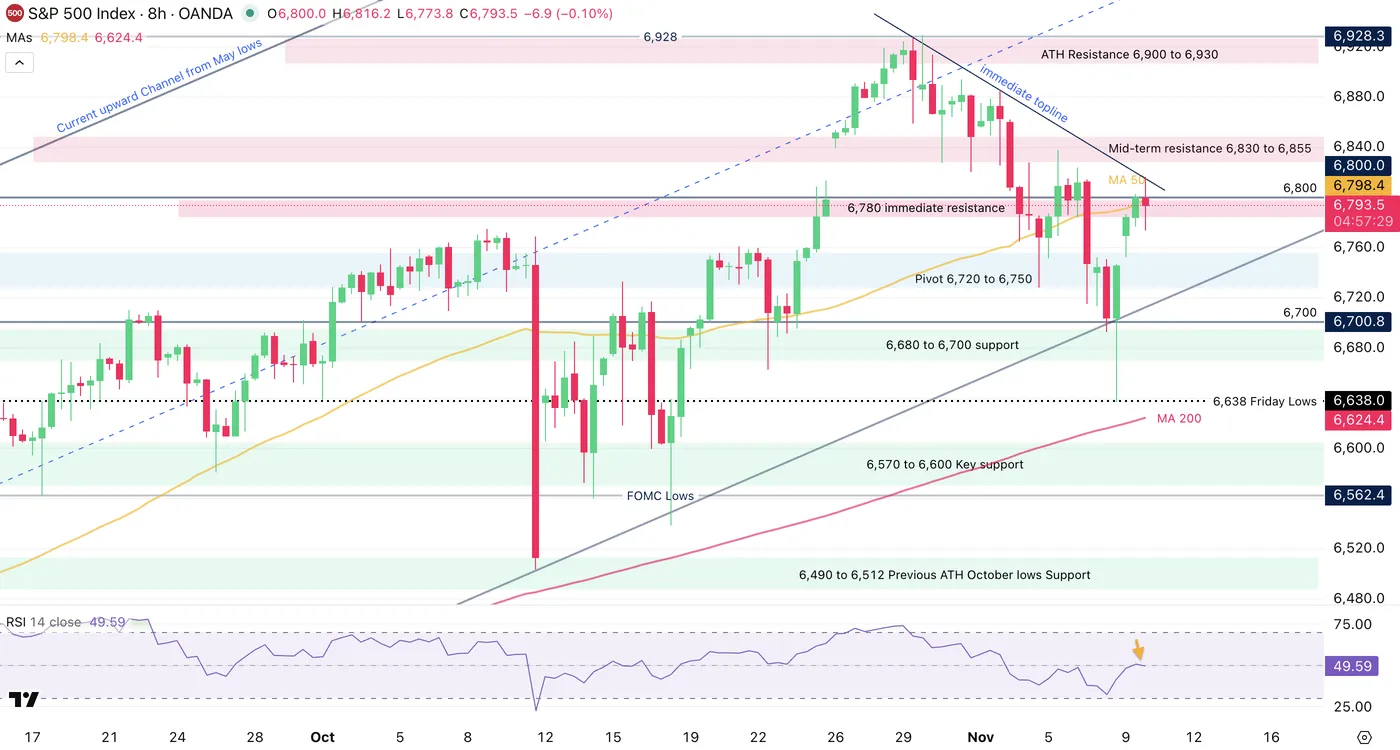
S&P 500 8H Chart, November 10, 2025 – Source: TradingView
There has been some short-term rejection at the topline but some dip-buying has helped an initially-bearish candle to turn more neutral.
Similarly as the other indices, the S&P 500 is reacting to some immediate resistance but with the current breadth of the rally, the S&P 500 looks relatively more solid than its peers.
Nevertheless, market mood spreads throughout all indices, therefore today's close will be important to check.
After the gaps higher, it will be key to spot if continuation holds or if this was only a retracement toward a longer-run correction.
S&P 500 technical levels of interest:
Resistance Levels
- 6,930 (current All Time-Highs)
- ATH Resistance 6,900 to 6,930
- Intermediate resistance 6,830 to 6,855
- Daily highs 6,796
Support Levels
- 6,707 session lows
- Pivot and MA 200 6,720 to 6,750 (testing)
- 6,680 to 6,700 support
- 6,570 to 6,600 Key support
- 6,490 to 6,512 Previous ATH now Support (4H MA 200 Confluence)
Safe Trades!
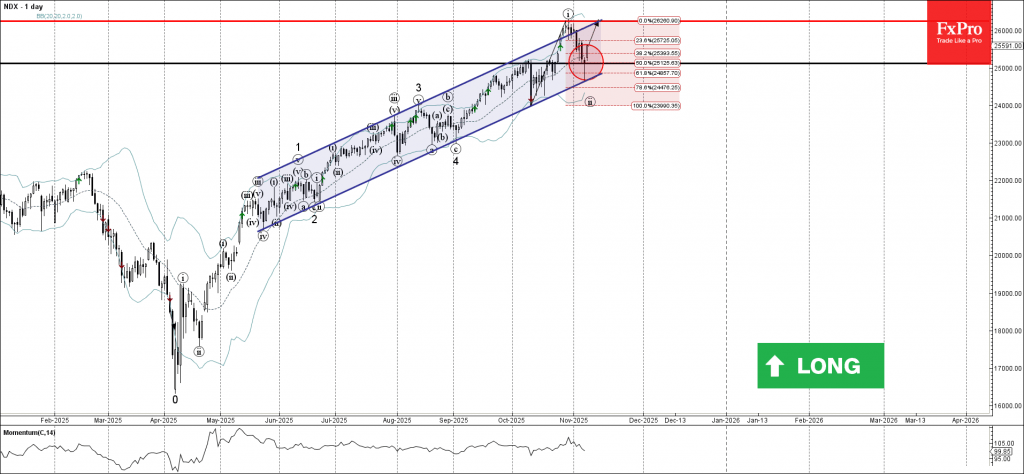
Nasdaq-100 Wave Analysis
Nasdaq-100: ⬆️ Buy
- Nasdaq-100 reversed from support level 25000.00
- Likely to rise to resistance level 26250.00
Nasdaq-100 index recently reversed up with the daily Hammer from the support zone between the round support level 25000.00 and the support trendline of the daily up channel from May.
This support zone was strengthened by the 61.8% Fibonacci correction of the sharp upward impulse from October.
Given the clear daily trend, Nasdaq-100 index can be expected to rise to the next resistance level 26250.00 (top of the previous impulse wave i).
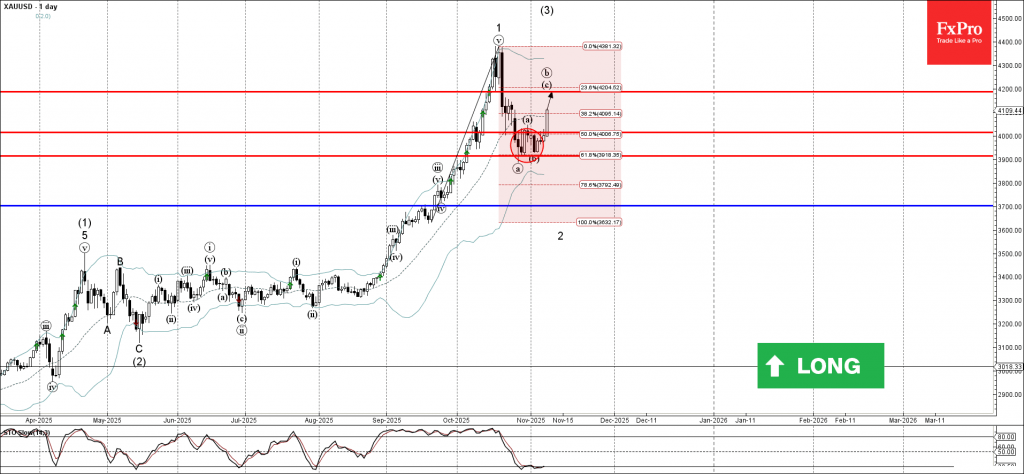
Gold Wave Analysis
Gold: ⬆️ Buy
- Gold reversed from support zone
- Likely to rise to resistance level 4200.00
Gold recently reversed up from the support zone between the round support level 4000.00 and the support level 3900.00.
This support zone was strengthened by the lower daily Bollinger Band and by the 61.8% Fibonacci correction of the sharp upward impulse from September.
Given the strong daily trend and the still oversold daily Stochastic, Gold can be expected to rise further to the next resistance level 4200.00 (target price for the completion of the active wave c).
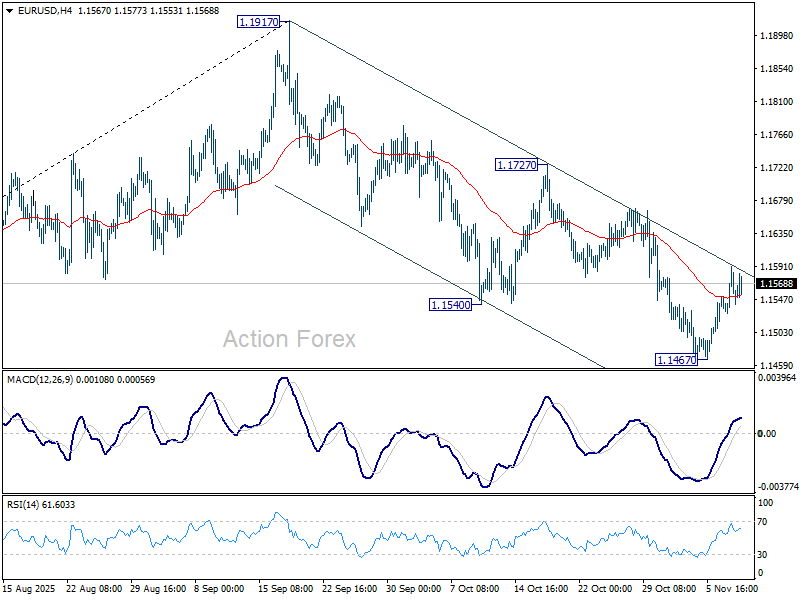
EUR/USD Mid-Day Outlook
Daily Pivots: (S1) 1.1532; (P) 1.1562; (R1) 1.1593; More…
Outlook in EUR/USD is unchanged and intraday bias stays neutral. Further fall would remain in favor as long as 55 D EMA (now at 1.1623) holds. Below 1.1467 will resumed the decline from 1.1917 to 1.1390 support next. However, sustained trading above 55 D EMA will argue that fall from 1.1971 has completed as a correction only, and bring further rise to 1.1727 resistance next.
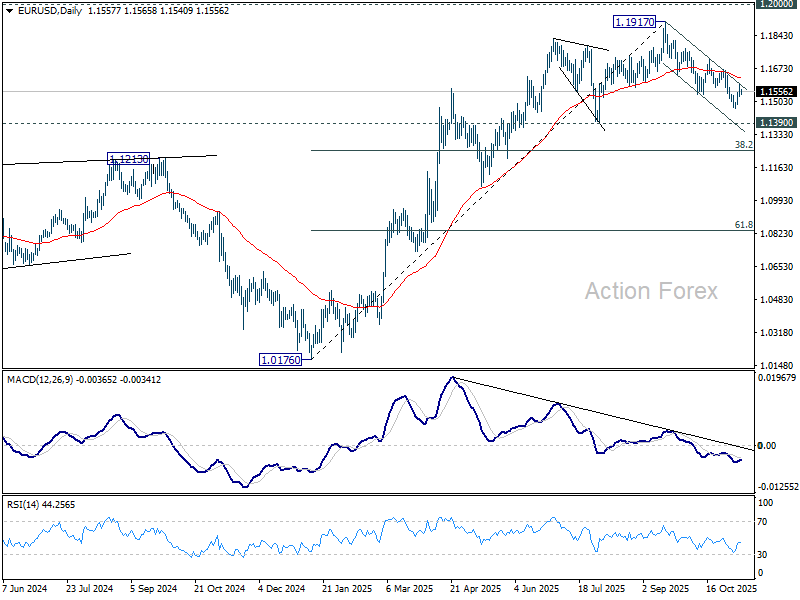
In the bigger picture, considering bearish divergence condition in D MACD, a medium term top is likely in place at 1.1917, just ahead of 1.2 key psychological level. As long as 55 W EMA (now at 1.1306) holds, the up trend from 0.9534 (2022 low) is still expected to continue. Decisive break of 1.2000 will carry larger bullish implications. However, sustained trading below 55 W EMA will argue that rise from 0.9534 has completed as a three wave corrective bounce, and keep long term outlook outlook bearish.
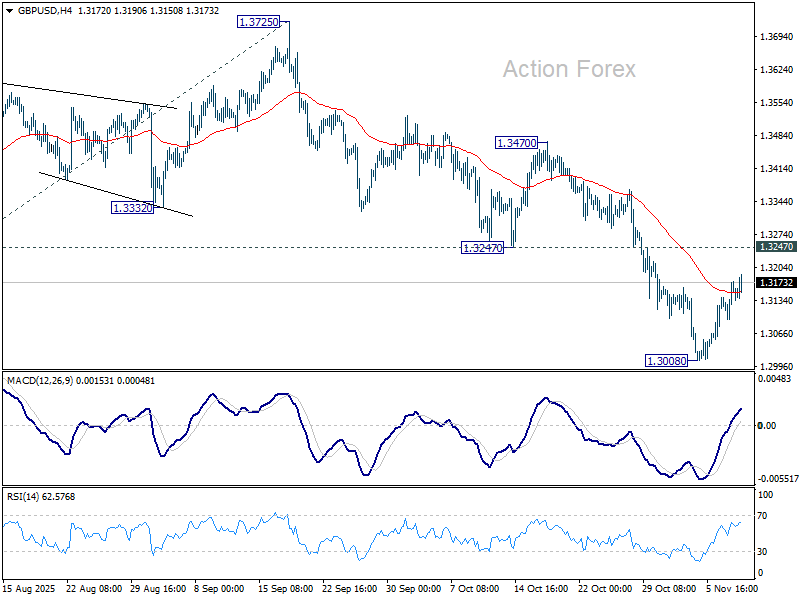
GBP/USD Mid-Day Outlook
Daily Pivots: (S1) 1.3112; (P) 1.3144; (R1) 1.3192; More...
GBP/USD is still extending consolidations above 1.3008 and intraday bias remains neutral. Further decline is expected as long as 1.3247 support turned resistance holds. Break of 1.3008 will target 138.2% projection of 1.3787 to 1.3140 from 1.3725 at 1.2831). Nevertheless, firm break of 1.3247 will suggest that fall from 1.3787 has completed as a corrective move already.
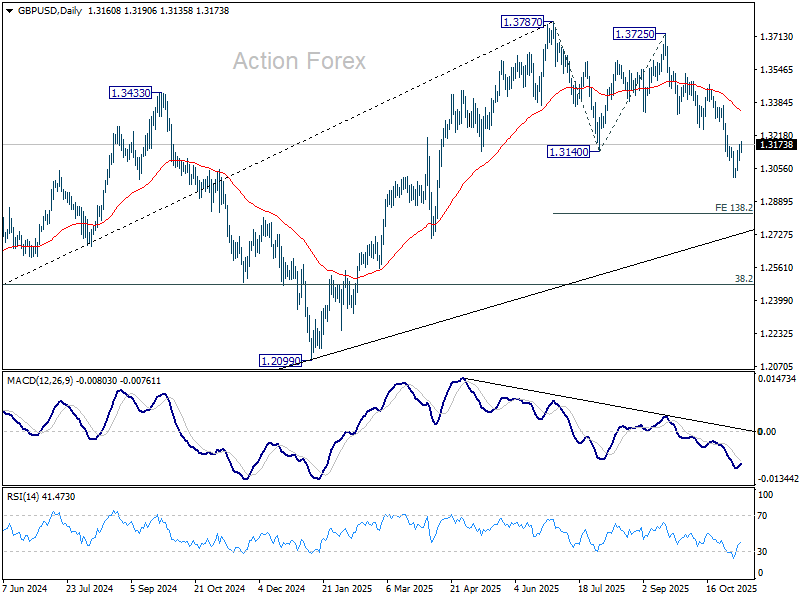
In the bigger picture, the break of 55 W EMA (now at 1.3185) is taken as the first sign that corrective rise from 1.0351 (2022 low) has completed. Decisive break of trend line support (now at 1.2780) will solidify this case and target 38.2% retracement of 1.0351 to 1.3787 at 1.2474 next. Meanwhile, in case of another rise, strong resistance should emerge below 1.4248 (2021 high) to cap upside to preserve the long term down trend.
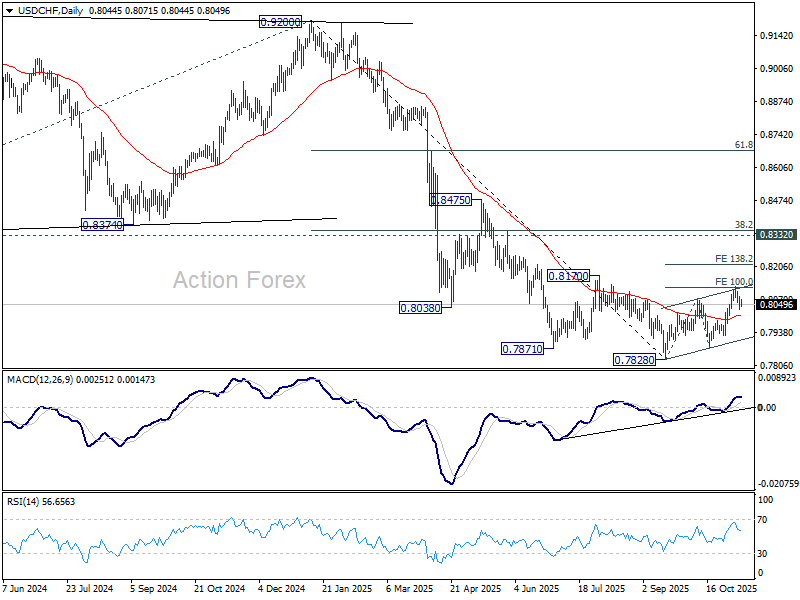
USD/CHF Mid-Day Outlook
Daily Pivots: (S1) 0.8027; (P) 0.8056; (R1) 0.8080; More…
Outlook is unchanged in USD/CHF and intraday bias remains neutral. On the downside, decisive break of 55 D EMA (now at 0.8007) will argue that the corrective bounce from 0.7828 has completed and bring retest of this low. On the upside, above 0.8123 will resume the rebound to 138.2% projection of 0.7828 to 0.8075 from 0.7872 at 0.8213.
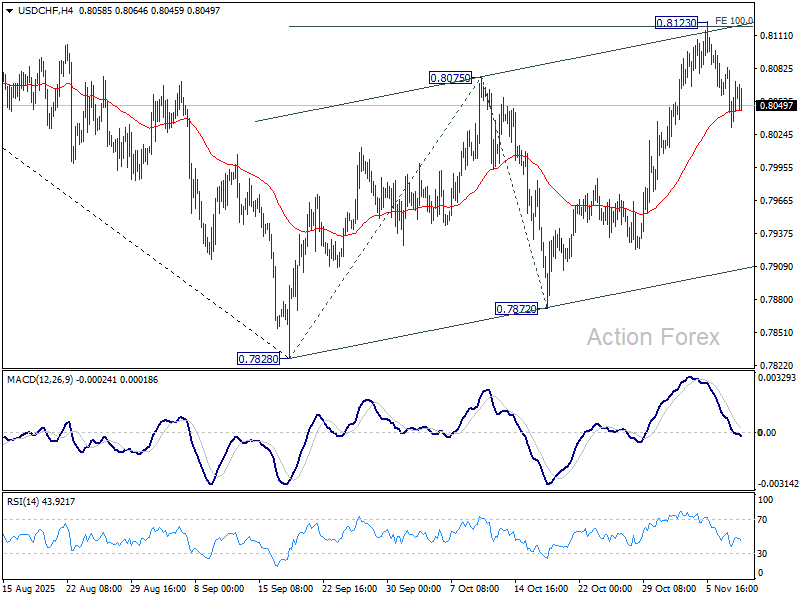
In the bigger picture, long term down trend from 1.0342 (2017 high) is still in progress. Next target is 100% projection of 1.0146 (2022 high) to 0.8332 from 0.9200 at 0.7382. In any case, outlook will stay bearish as long as 0.8332 support turned resistance holds (2023 low).
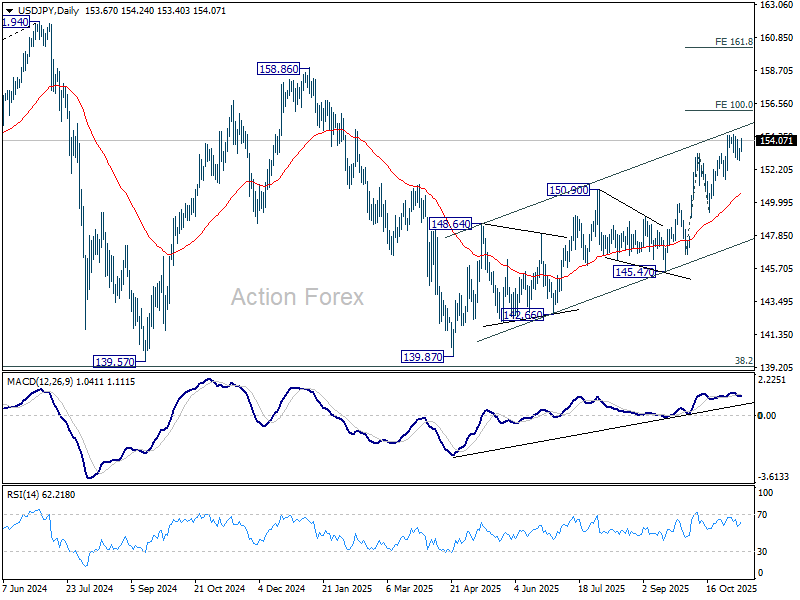
USD/JPY Mid-Day Outlook
Daily Pivots: (S1) 152.97; (P) 153.28; (R1) 153.75; More...
USD/JPY rebounded notably today but stays below 154.47 resistance. Intraday bias remains neutral and more consolidations could still be seen. Further rally is expected as long as 151.52 support holds. Above 154.47 will resume larger rise from 139.87 and target 100% projection of 146.58 to 153.26 from 149.37 at 156.05. Break there will pave the way to 158.85 key structural resistance.
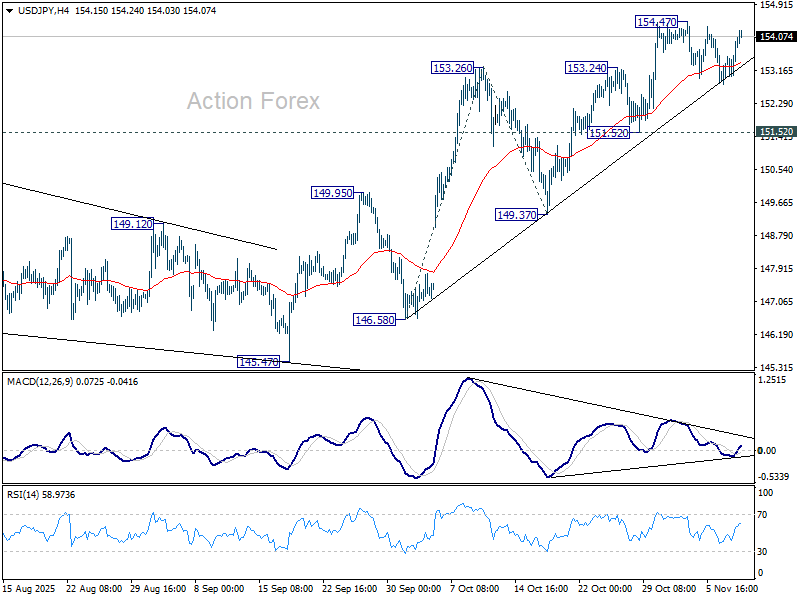
In the bigger picture, current development suggests that corrective pattern from 161.94 (2024 high) has completed with three waves at 139.87. Larger up trend from 102.58 (2021 low) could be ready to resume through 161.94 high. On the downside, break of 149.37 support will dampen this bullish view and extend the corrective pattern with another falling leg.