Sample Category Title
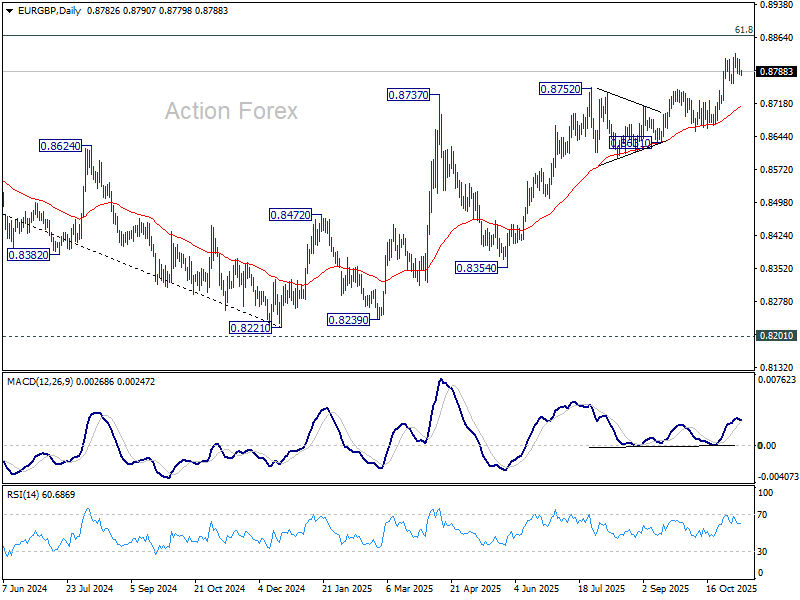
EUR/GBP Daily Outlook
Daily Pivots: (S1) 0.8775; (P) 0.8795; (R1) 0.8808; More…
Intraday bias in EUR/GBP remains neutral and more consolidations could be seen below 0.8828. Further rally is expected as long as 0.8761 support holds. On the upside, break of 0.8828 will resume the whole rise from 0.8221 and target 0.8867 fibonacci level. Firm break there will carry larger bullish implications. However, considering bearish divergence condition in 4H MACD, decisive break of 0.8761 will confirm short term topping, and bring deeper fall to 55 D EMA (now at 0.8708).
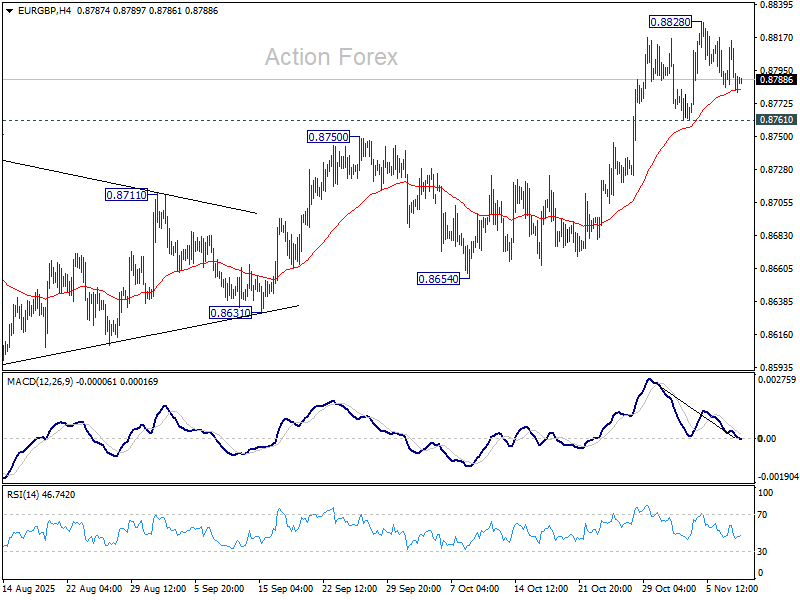
In the bigger picture, rise from 0.8221 medium term bottom is still seen as a corrective move. Upside should be limited by 61.8% retracement of 0.9267 to 0.8221 at 0.8867. Firm break of 0.8654 support will be the first sign that this corrective bounce has completed. However, decisive break of 0.8867 will suggest that EUR/GBP is already reversing whole decline from 0.9267 (2022 high).
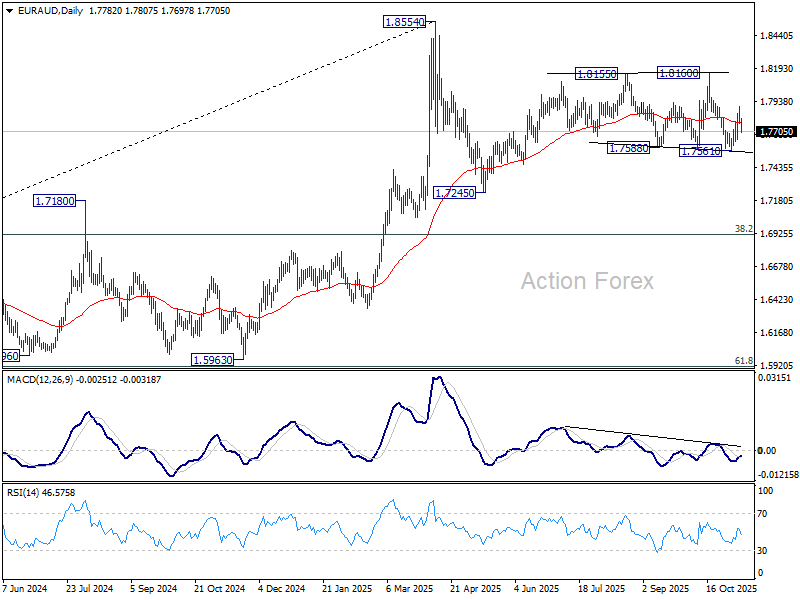
EUR/AUD Daily Outlook
Daily Pivots: (S1) 1.7752; (P) 1.7826; (R1) 1.7878; More...
Intraday bias in EUR/AUD is turned neutral again with today's sharp decline. On the downside, break of 1.7561 support will revive the bearish case that corrective pattern from 1.8554 is in the third leg, and target 1.7245 support. On the upside, through, above 1.7895 will resume the rebound from 1.7561 to 1.8160 resistance next.
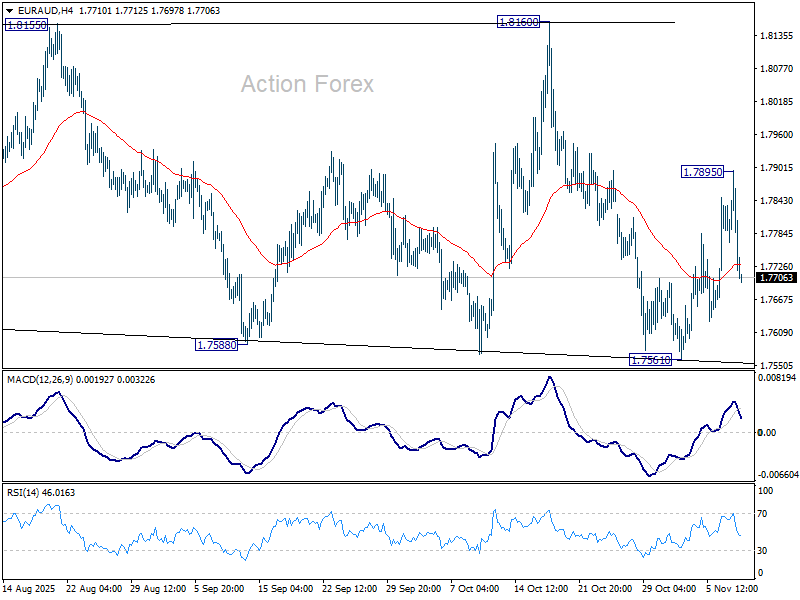
In the bigger picture, price actions from 1.8554 medium term top are seen as a corrective pattern. Sustained break of 55 W EMA (now at 1.7406) will suggest that it's correcting the whole rally from 1.4281 (2022 low). In this case, deeper decline would be seen to 38.2% retracement of 1.4281 to 1.8554 at 1.6922. Nevertheless, strong rebound form 55 W EMA will likely bring resumption of the up trend sooner.
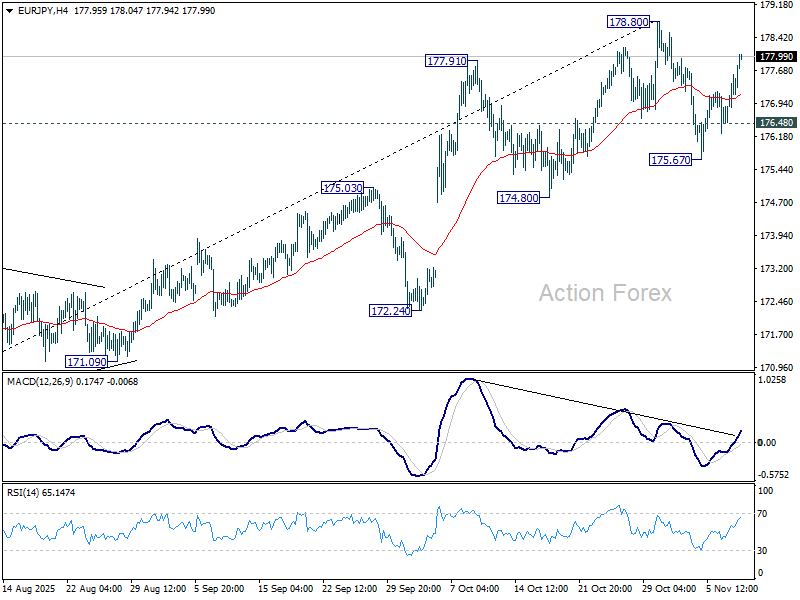
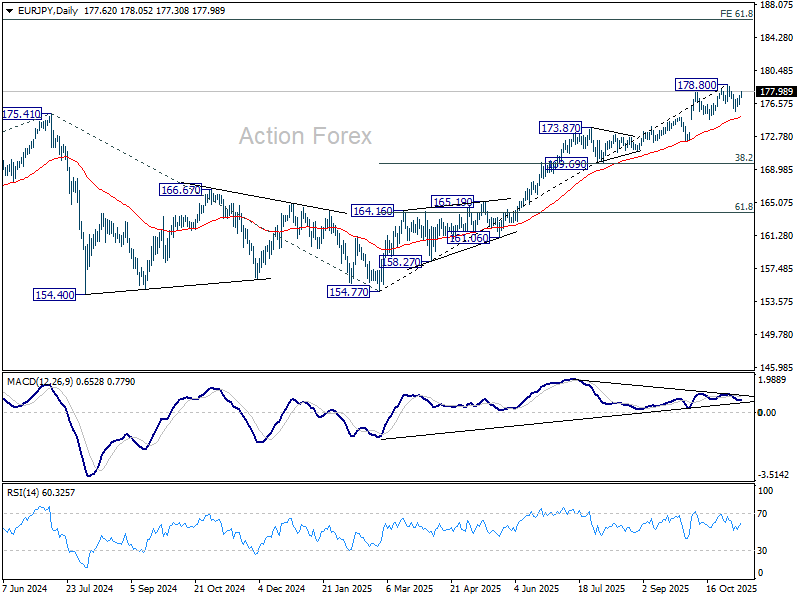
EUR/JPY Daily Outlook
Daily Pivots: (S1) 176.76; (P) 177.18; (R1) 177.87; More...
EUR/JPY's rebound from 175.67 extended higher but upside is capped below 178.80 resistance. Intraday bias remains neutral first. On the downside, below 176.48 minor support will turn bias to the downside to resume the fall form 178.80. Considering bearish divergence condition in D MACD (now at 175.11), sustained break of 55 D EMA will argue that EUR/JPY is correcting whole rise from 154.87. Nevertheless, decisive break of 178.80 will resume the larger up trend instead.
In the bigger picture, up trend from 114.42 (2020 low) is in progress and should target 61.8% projection of 124.37 to 175.41 from 154.77 at 186.31. However, firm break of 174.80 support will suggests that it has turned into consolidations first. But still, outlook will continue to stay bullish as long as 55 W EMA (now at 168.20) holds, even in case of deep pullback.
GBP/JPY Daily Outlook
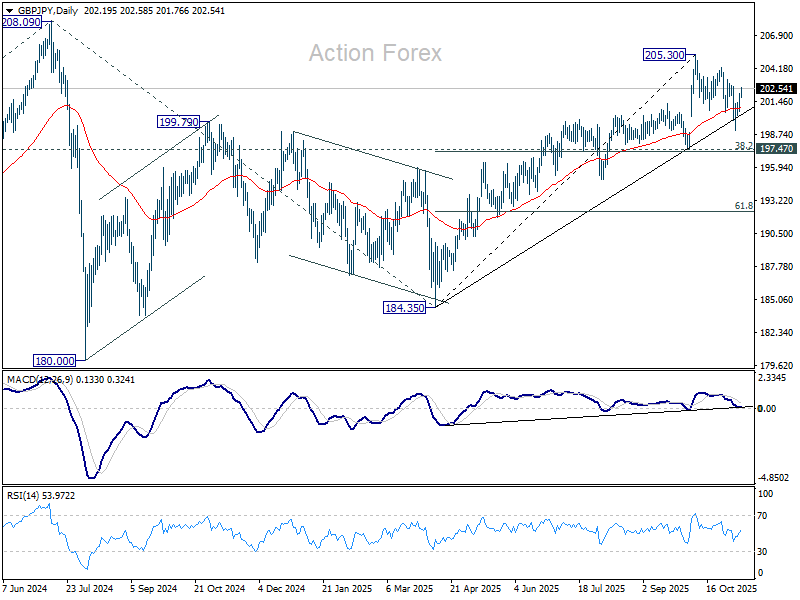
Daily Pivots: (S1) 201.03; (P) 201.56; (R1) 202.47; More...
GBP/JPY's rebound form 199.04 extended higher today but it stays within near term falling channel and below 204.22 resistance. Intraday bas remains neutral first. On the upside, break of 204.22 should confirm that fall from 205.30 has completed as correction, and larger rise from 184.53 is ready to resume through 205.30. On the downside, though, break of 200.63 minor support will extend the correction through 199.04 to 197.47 cluster (38.2% retracement of 184.35 to 205.30 at 197.29).
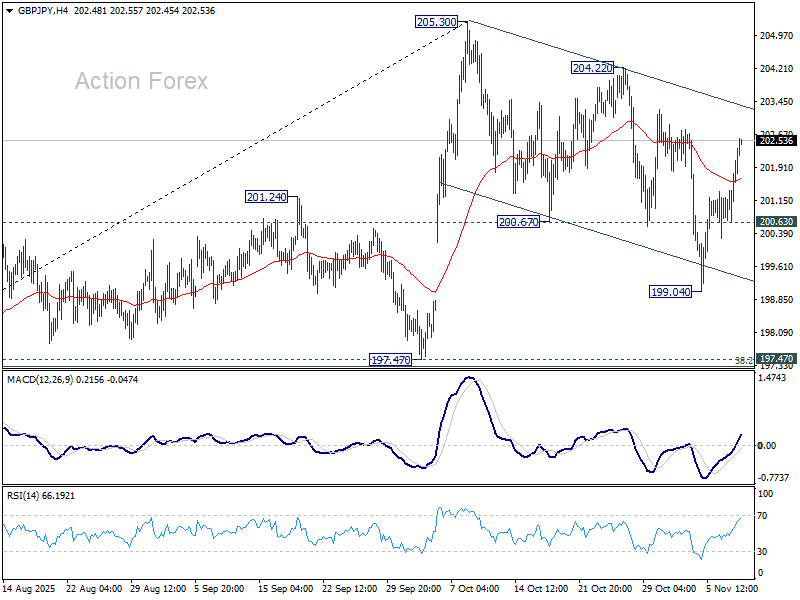
In the bigger picture, price actions from 208.09 (2024 high) are seen as a corrective pattern which might have completed at 184.35. Firm break of 208.09 high will resume the up trend from 123.94 (2020 low). Next target is 61.8% projection of 148.93 to 208.09 from 184.35 at 220.90. However, decisive break of 197.47 support will dampen this view and extend the corrective pattern with another fall.
Yen Slips as China Sentiment Improves, Political Pressure Builds on BoJ
Yen was under pressure across the board in Asian session today as improved sentiment toward China and dovish domestic signals combined to sap demand for the safe-haven currency. Traders interpreted the latest Chinese inflation report and a surprise U.S. trade gesture as signs of stabilizing conditions, prompting flows back into risk assets.
China’s October CPI returned to positive territory, beating forecasts and ending two months of declines. While deflation concerns have not fully dissipated, the rebound raised confidence that Beijing’s supply-side policies are gaining traction in reducing industrial overcapacity. The focus now shifts to whether authorities will complement those efforts with stronger demand-side measures.
Risk appetite was further buoyed after Washington announced it would suspend for one year any action under its Section 301 investigations into China’s maritime, logistics, and shipbuilding sectors. The pause marks another tangible sign of near-term trade de-escalation and offered additional relief for regional assets already supported by improving Chinese data.
Sentiment toward the Japanese currency was further undermined by comments from Takuji Aida, an influential economist on Prime Minister Sanae Takaichi’s flagship policy panel. Aida told the Nikkei that the BoJ should avoid raising rates in December and wait at least until January to safeguard a fragile recovery.
He argued that the government should cushion households from high living costs with large-scale spending until real income growth turns positive, suggesting monetary and fiscal policies must remain complementary. His views carry weight given his proximity to Takaichi, and they reinforced speculation that policymakers may tolerate a slower path to normalization.
By midday, Yen was the day’s weakest performer, followed by Swiss Franc and Sterling, while Aussie, Kiwi, and Loonie led gains. Dollar and Euro traded mid-pack, reflecting a market tilt toward risk-on positioning.
In Asia, at the time of writing, Nikkei is up 1.29%. Hong Kong HSI is up 1.30%. China Shanghai SSE is up 0.19%. Singapore Strait Times is down -0.42%. Japan 10-year JGB yield is up 0.021 at 1.700.
BoJ summary show split narrows as members debate near term rate hike
The BoJ’s Summary of Opinions from October 29–30 meeting revealed a growing consensus among policymakers that conditions are nearly in place for a rate hike. Eight opinions either called for raising interest rates soon or outlined conditions under which borrowing costs should rise in the near term—marking the clearest sign yet that the BoJ is preparing for its next move.
Several members emphasized that while immediate action may not be necessary, the Bank “should not miss the timing to raise the policy interest rate.” Others noted that a hike would likely follow if global economic conditions remained stable and corporate wage-setting momentum was sustained. One view stated that “conditions for taking a further step toward normalizing the policy rate have almost been met,” but stressed the need to confirm that underlying inflation is firmly entrenched.
Still, some members urged caution. One participant argued that the BoJ should take “a little more time” to assess the impact of U.S. tariffs and Japan’s new fiscal direction before tightening policy further. The minutes reinforce market expectations that the Bank is leaning toward a rate increase either in December or early 2026, contingent on wage data and external stability.
China CPI turns positive to 0.2% yoy in October, core gauge hits 19-month high
China’s inflation turned positive in October, signaling tentative signs of price stabilization e. Headline CPI rose 0.2% yoy, beating expectations of flat growth and rebounding from September’s -0.3%. The return to positive territory, driven largely by firmer service prices, suggests domestic demand may be gradually recovering amid ongoing policy support.
The breakdown showed goods prices still fell -0.2% yoy, while service prices rose 0.8%. Food prices remained weak, down -2.9%. But core CPI—excluding food and energy—accelerated from 1.0% to 1.2%, the highest since March 2024.
Producer prices also edged higher, with PPI contracting -2.1% yoy, less than September’s -2.3% and above forecasts of -2.3% yoy. It marked the 37th straight month of decline but reflected narrower price falls in key industrial sectors.
BoC minutes, UK GDP and Australia jobs to guide markets through quiet week
After weeks dominated by macro turbulence and shifting sentiment, the coming days look comparatively calm. Still, the schedule contains enough central-bank and growth data to keep traders alert for any signs of shifting policy momentum heading into December.
In Canada, the BoC’s Summary of Deliberations will provide color on October’s rate cut and the Governing Council’s conviction that policy is now “about the right level.” That phrase—repeated in Governor Macklem’s parliamentary testimony—signals a shift to an extended holding phase as previous easing filters through an economy adjusting to U.S. tariffs.
The underlying question is how confident policymakers are that they have struck the right balance between supporting growth and containing residual inflation pressures. Markets will watch for any sign that the Bank might reassess if growth deteriorates further into winter.
The UK will meanwhile deliver a busy slate of releases, including Q3 GDP and monthly labor data. Economists expect a modest 0.2% quarterly expansion, reinforcing the case for a BoE rate cut in December as policymakers assess the economy’s fragile growth and softening wage pressures. The easing track remains on course, with the Autumn Budget seen as the final piece before confirmation.
Australia’s October jobs data will also test market expectations. The RBA is seen keeping rates steady until at least February, after reviewing Q4 CPI. However, if employment shows material weakness, the timeline for rate cuts could shift earlier.
Elsewhere, Eurozone Sentix and German ZEW sentiment readings, along with China’s data on industrial output, retail sales, and fixed-asset investment, will also be closely watched.
Here are some highlights for the week:
- Monday: BoJ summary of opinions; Eurozone Sentix investor confidence.
- Tuesday: Australia Westpac consumer sentiment; NAB business confidence; UK employment; Germany ZEW economic sentiment.
- Wednesday: BoC summary of deliberations.
- Thursday: Japan PPI; Australia employment; UK GDP; Swiss CPI; Eurozone industrial production.
- Friday: New Zealand BNZ manufacturing; China industrial production, retail sales, fixed asset investment; Eurozone GDP revision trade balance; Canada manufacturing sales, wholesale sales.
GBP/JPY Daily Outlook
Daily Pivots: (S1) 201.03; (P) 201.56; (R1) 202.47; More...
GBP/JPY's rebound form 199.04 extended higher today but it stays within near term falling channel and below 204.22 resistance. Intraday bas remains neutral first. On the upside, break of 204.22 should confirm that fall from 205.30 has completed as correction, and larger rise from 184.53 is ready to resume through 205.30. On the downside, though, break of 200.63 minor support will extend the correction through 199.04 to 197.47 cluster (38.2% retracement of 184.35 to 205.30 at 197.29).
In the bigger picture, price actions from 208.09 (2024 high) are seen as a corrective pattern which might have completed at 184.35. Firm break of 208.09 high will resume the up trend from 123.94 (2020 low). Next target is 61.8% projection of 148.93 to 208.09 from 184.35 at 220.90. However, decisive break of 197.47 support will dampen this view and extend the corrective pattern with another fall.
EUR/USD Attempts Bounce but Encounters Strong Resistance Barrier
Key Highlights
- EUR/USD started a recovery wave from 1.1465.
- A major bearish trend line is forming with resistance at 1.1620 on the 4-hour chart.
- GBP/USD recovered some losses and climbed above 1.3120.
- USD/JPY is consolidating above the 152.50 support.
EUR/USD Technical Analysis
The Euro found support near 1.1465 against the US Dollar. EUR/USD formed a base and started a recovery wave above 1.1500.
Looking at the 4-hour chart, the pair traded above the 1.1520 and 1.1540 levels. There was a move above the 50% Fib retracement level of the downward move from the 1.1668 swing high to the 1.1468 low.
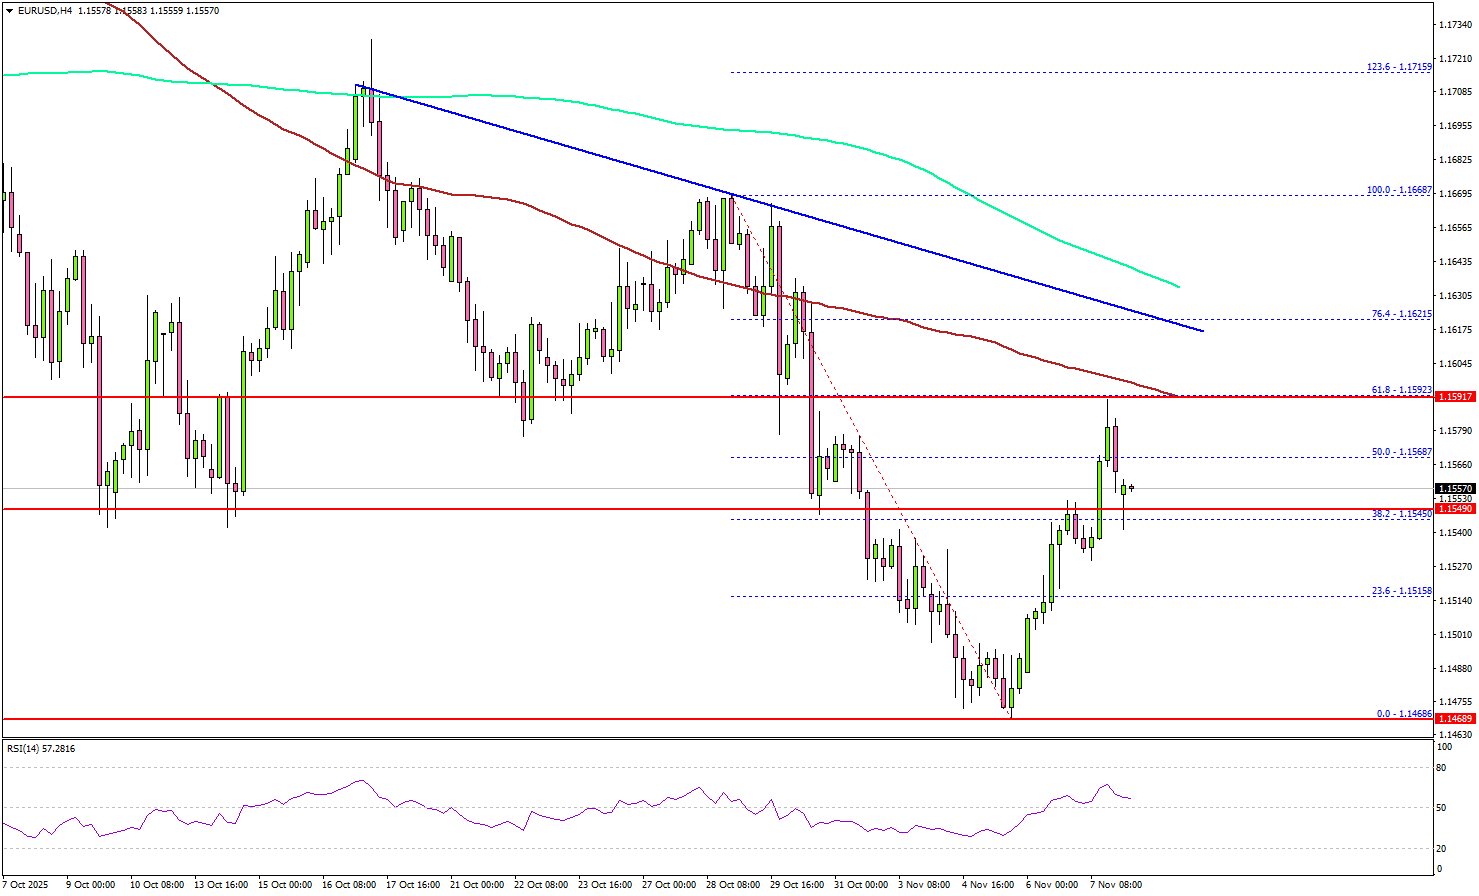
On the upside, the pair faces resistance near the 1.1595 zone, the 61.8% Fib retracement level of the downward move from the 1.1668 swing high to the 1.1468 low, and the 100 simple moving average (red, 4-hour).
The first major resistance is 1.1620. There is also a major bearish trend line forming with resistance at 1.1620 and the 200 simple moving average (green, 4-hour). A close above 1.1620 resistance might push the pair to 1.1680. Any more gains could set the pace for a steady increase toward 1.1750.
On the downside, the pair might find support at 1.1540. The main support might be 1.1520. A close below the 1.1520 zone could start a pullback toward. Any more losses might open the doors for a test of 1.1465.
Looking at GBP/USD, the pair started a recovery wave above 1.3120 but faces hurdles near the 1.3240 level.
Upcoming Key Economic Events:
- Euro Zone Sentix Investor Confidence for Nov 2025 - Forecast -5.5, versus -5.4 previous.
BoJ summary show split narrows as members debate near term rate hike
The BoJ’s Summary of Opinions from October 29–30 meeting revealed a growing consensus among policymakers that conditions are nearly in place for a rate hike. Eight opinions either called for raising interest rates soon or outlined conditions under which borrowing costs should rise in the near term—marking the clearest sign yet that the BoJ is preparing for its next move.
Several members emphasized that while immediate action may not be necessary, the Bank “should not miss the timing to raise the policy interest rate.” Others noted that a hike would likely follow if global economic conditions remained stable and corporate wage-setting momentum was sustained. One view stated that “conditions for taking a further step toward normalizing the policy rate have almost been met,” but stressed the need to confirm that underlying inflation is firmly entrenched.
Still, some members urged caution. One participant argued that the BoJ should take “a little more time” to assess the impact of U.S. tariffs and Japan’s new fiscal direction before tightening policy further. The minutes reinforce market expectations that the Bank is leaning toward a rate increase either in December or early 2026, contingent on wage data and external stability.
China CPI turns positive to 0.2% yoy in October, core gauge hits 19-month high
China’s inflation turned positive in October, signaling tentative signs of price stabilization e. Headline CPI rose 0.2% yoy, beating expectations of flat growth and rebounding from September’s -0.3%. The return to positive territory, driven largely by firmer service prices, suggests domestic demand may be gradually recovering amid ongoing policy support.
The breakdown showed goods prices still fell -0.2% yoy, while service prices rose 0.8%. Food prices remained weak, down -2.9%. But core CPI—excluding food and energy—accelerated from 1.0% to 1.2%, the highest since March 2024.
Producer prices also edged higher, with PPI contracting -2.1% yoy, less than September’s -2.3% and above forecasts of -2.3% yoy. It marked the 37th straight month of decline but reflected narrower price falls in key industrial sectors.
U.S. Shutdown Hits Stocks as Yen Intervention Caution Grows
It was a quiet week in the markets as the U.S. government shutdown became the longest on record. The shutdown hurt confidence and delayed important U.S. economic data. Stocks in the U.S. fell as investors worried that prices are too high and that company profits may slow.
New data also showed signs of weakness in the U.S. economy. The Challenger report revealed that layoffs in October reached the highest level in 20 years, as more companies began using AI to cut costs. Consumer confidence also dropped to its lowest point since 2022, showing that many Americans are becoming more worried about a slowdown.
In the U.K., the Bank of England kept interest rates the same, but four of the nine members voted to cut rates — a sign that some are worried about the economy. In Japan, the Bank of Japan’s September meeting minutes showed that two members supported raising rates to 0.75%, suggesting that Japan may slowly move toward higher interest rates even as other countries consider cutting them.
Markets This Week
U.S. Stocks
The Dow index fell below its 10-day moving average last week as investors continued to take profits amid concerns about overvaluation and signs of a slowing U.S. economy. With the market now trading under this key level, further short-term weakness is likely to continue. Resistance levels are at 47,500, 48,000, and 49,000, while support lies at 46,500, 46,000, 45,500, and 45,000.
Japanese Stocks
The Nikkei 225 fell over 4% last week, which looks big but makes sense after the strong rally in recent months. Profit-taking and weakness in U.S. stocks pushed the market lower. The Japanese government still plans to announce a new stimulus package later this month to support the economy, which could help limit further losses. With the uptrend now broken, traders can look for range-trading chances this week and take advantage of high volatility. Resistance is at 51,250円, 52,000円, and 53,000円, while support is at 50,000円, 49,000円, 48,500円, and 47,000円.
USD/JPY
The USD/JPY continued to test higher last week after the Bank of Japan decided to delay any rate hikes. However, new Finance Minister Satsuki Katayama expressed concern about the yen’s weakness, raising the possibility of intervention and leading the pair to close slightly lower for the week. While the yen is likely to stay weak overall, a move above 155 seems unlikely in the short term, making the current market conditions attractive for range traders. Resistance is at 154.5, 155, and 156, while support is at 153, 151.5, 151, and 150.
Gold
Gold moved lower early last week but held firm at the $3,900 support level. The market closed the week higher, staying above the 10-day moving average as buyers returned on growing concerns about U.S. equities and the broader economy. Similar buying interest is expected this week, with the market likely to trade sideways to slightly higher and test the $4,050 level. Resistance is at $4,050, $4,150, and $4,200, while support stands at $3,925, $3,900, and $3,800.
Crude Oil
WTI came under pressure last week, falling below the key $60 support level as weak U.S. economic data and concerns about lower demand from China weighed on prices. The 10-day moving average is now turning lower, suggesting that further weakness is likely. Traders should focus on selling opportunities as long as prices remain below the 10-day moving average. Resistance is at $65, $66.50, $70, and $75, while support is at $55 and $50.
Bitcoin
Bitcoin fell below key support at $106,000 as rising risk-off sentiment triggered selling from technical traders. While retail investors have continued to buy, institutional investors are showing more caution, adding to downward pressure. Further liquidation is possible, so it’s better to look for selling opportunities near the 10-day moving average as long as the market stays below $106,000. Resistance is at $106,000, $116,000, and $120,000, while support stands at $100,000, $95,000, and $90,000.
This Week’s Focus
- Tuesday: Japan Current Account, U.K. Unemployment Rate, E.U. ZEW Economic Sentiment
- Thursday: Australia Unemployment Rate, U.K. GDP and Industrial Production, U.S. Initial Jobless Claims
- Friday: E.U. GDP and Trade Balance
Traders are focusing on investor sentiment as delays to important U.S. economic data from the government shutdown make it hard to understand the current outlook. The Japanese yen is in focus, as more weakness could lead to action from the Bank of Japan, while gold traders are watching to see if prices can recover after recent losses. Bitcoin is holding near key support at $100,000, keeping volatility high and leaving the risk of a sharp drop.
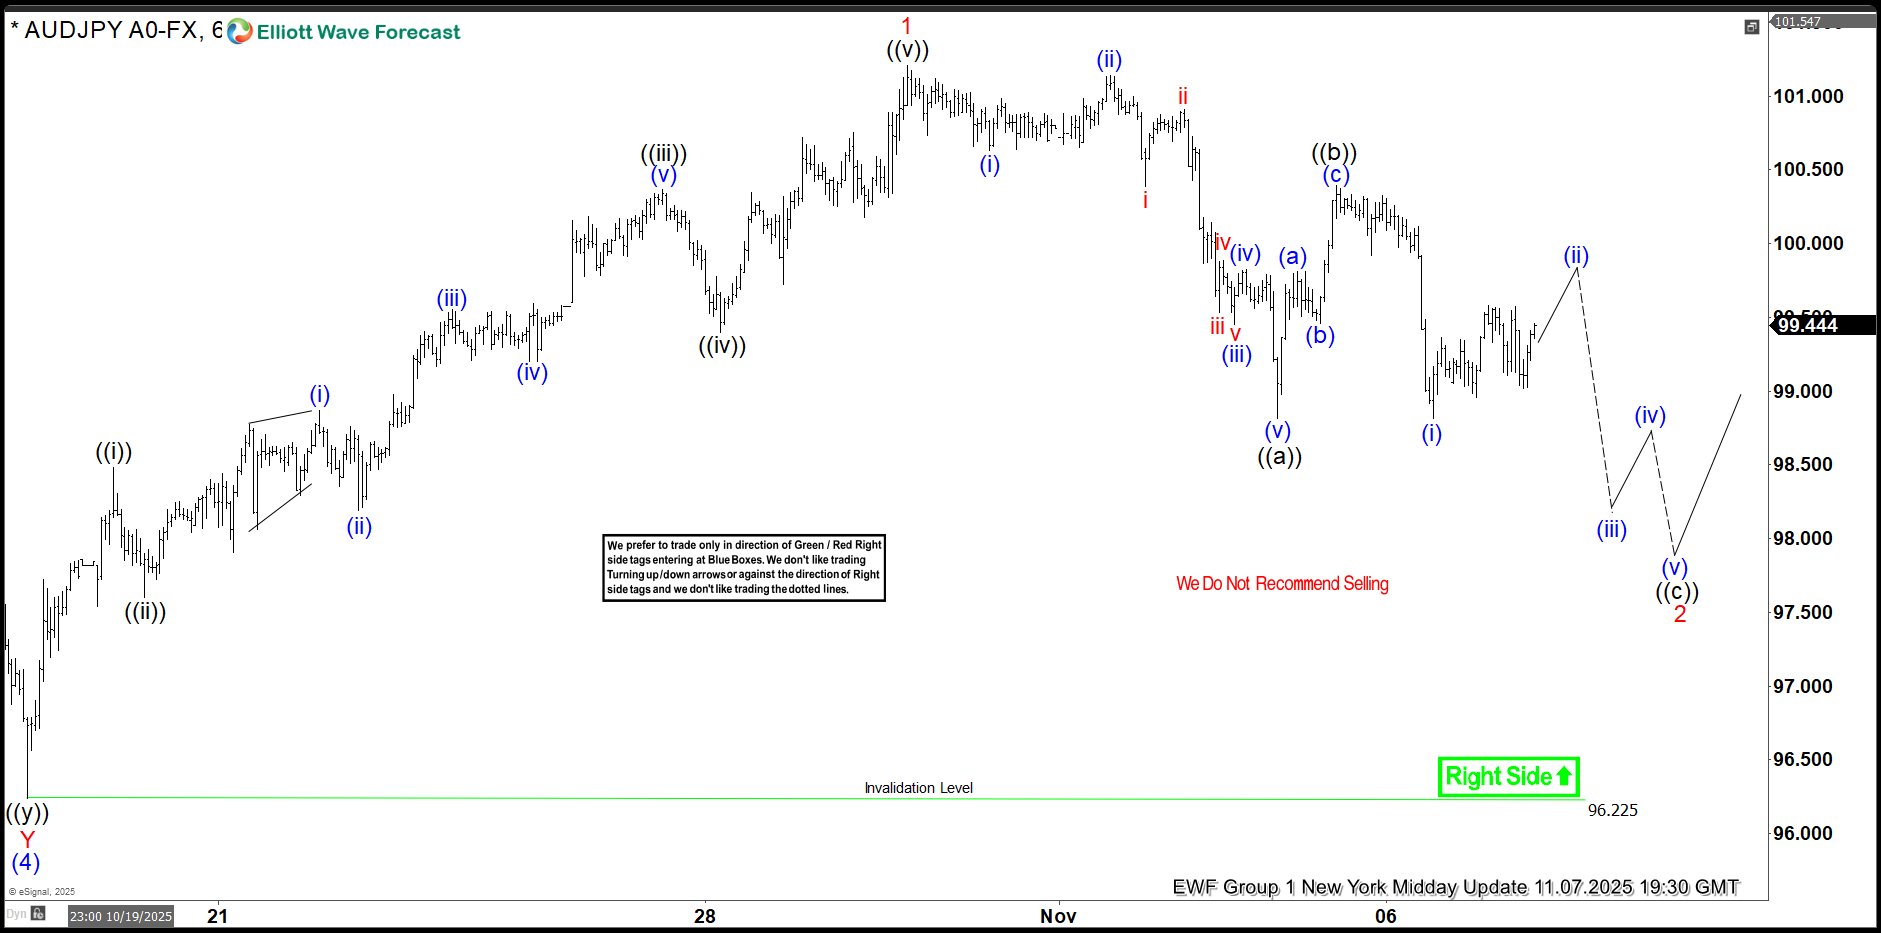
AUDJPY Elliott Wave Update: Zigzag Formation in Progress
Hello fellow traders,
In this technical article, we are going to present Elliott Wave charts of AUDJPY Forex pair . As our members know, the pair is showing a 3-wave pullback against the 96.23 low, taking the form of an Elliott Wave Zigzag structure.In the following sections, we will explain the Elliott Wave pattern and analysis, along with the potential targets.
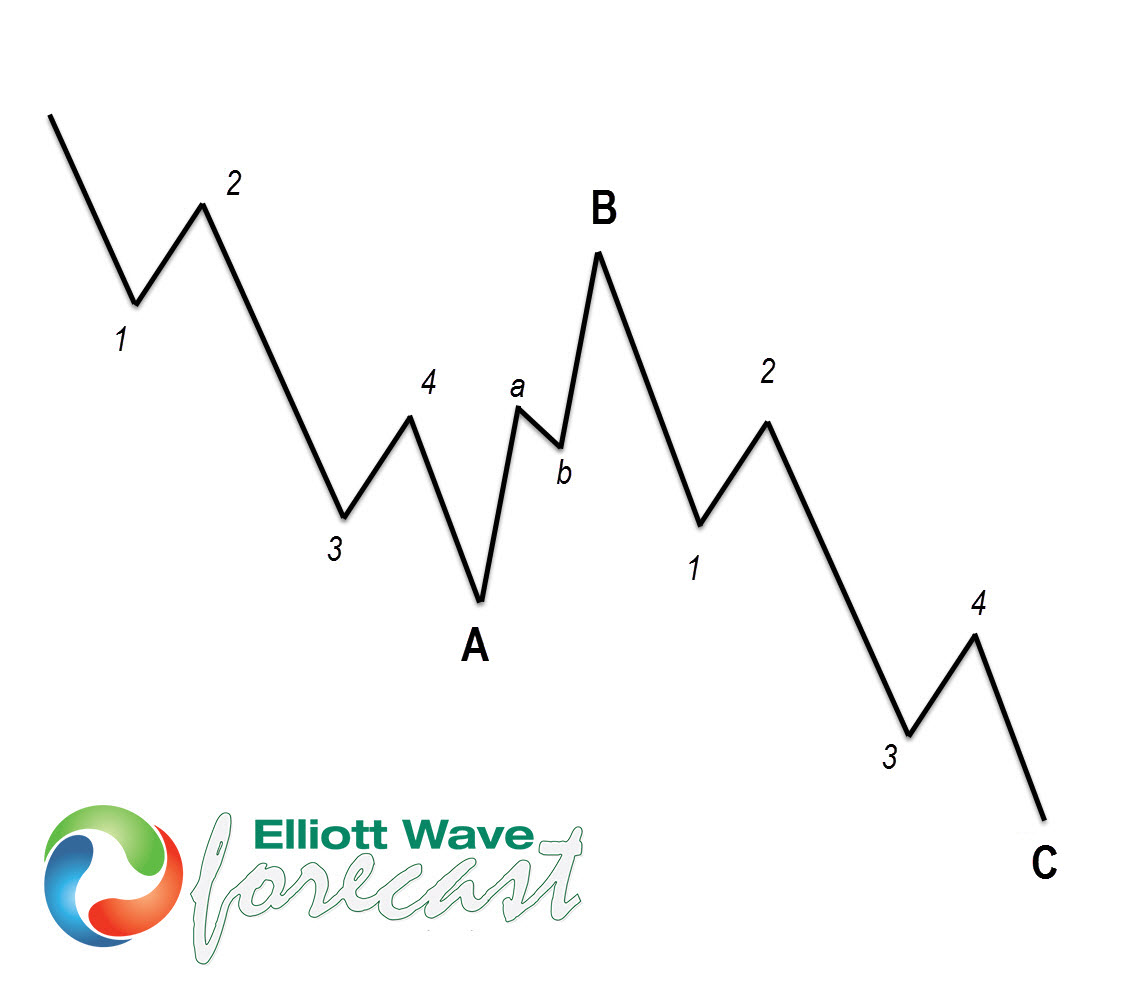
Before we take a look at the real market example, let’s explain Elliott Wave Zigzag.
Elliott Wave Zigzag is the most popular corrective pattern in Elliott Wave theory . It’s made of 3 swings which have 5-3-5 inner structure. Inner swings are A,B,C where A =5 waves, B=3 waves and C=5 waves. That means A and C can be either impulsive waves or diagonals. (Leading Diagonal in case of wave A or Ending in case of wave C) . Waves A and C must meet all conditions of being 5 wave structure, such as: having RSI divergency between wave subdivisions, ideal Fibonacci extensions and ideal retracements.
AUDJPY 1-Hour Elliott Wave Analysis 11.05.2025
AUDJPY ended the cycle from the 96.23 low as a 5-wave structure. The pair is now in the process of correcting that cycle. So far, we can count 5 waves in the decline, which suggests that the pullback remains incomplete.
The 5-wave drop from the peak indicates that we may have only completed the first leg of the correction. We expect to see a 3-wave bounce in wave ((b)), followed by another leg lower in wave ((c)) black.
Wave ((b)) typically completes within the 50%–61.8% Fibonacci retracement zone, which in this case comes in around the 100.017–100.293 area. In that zone, we expect sellers to appear again for another leg down in wave ((c)).
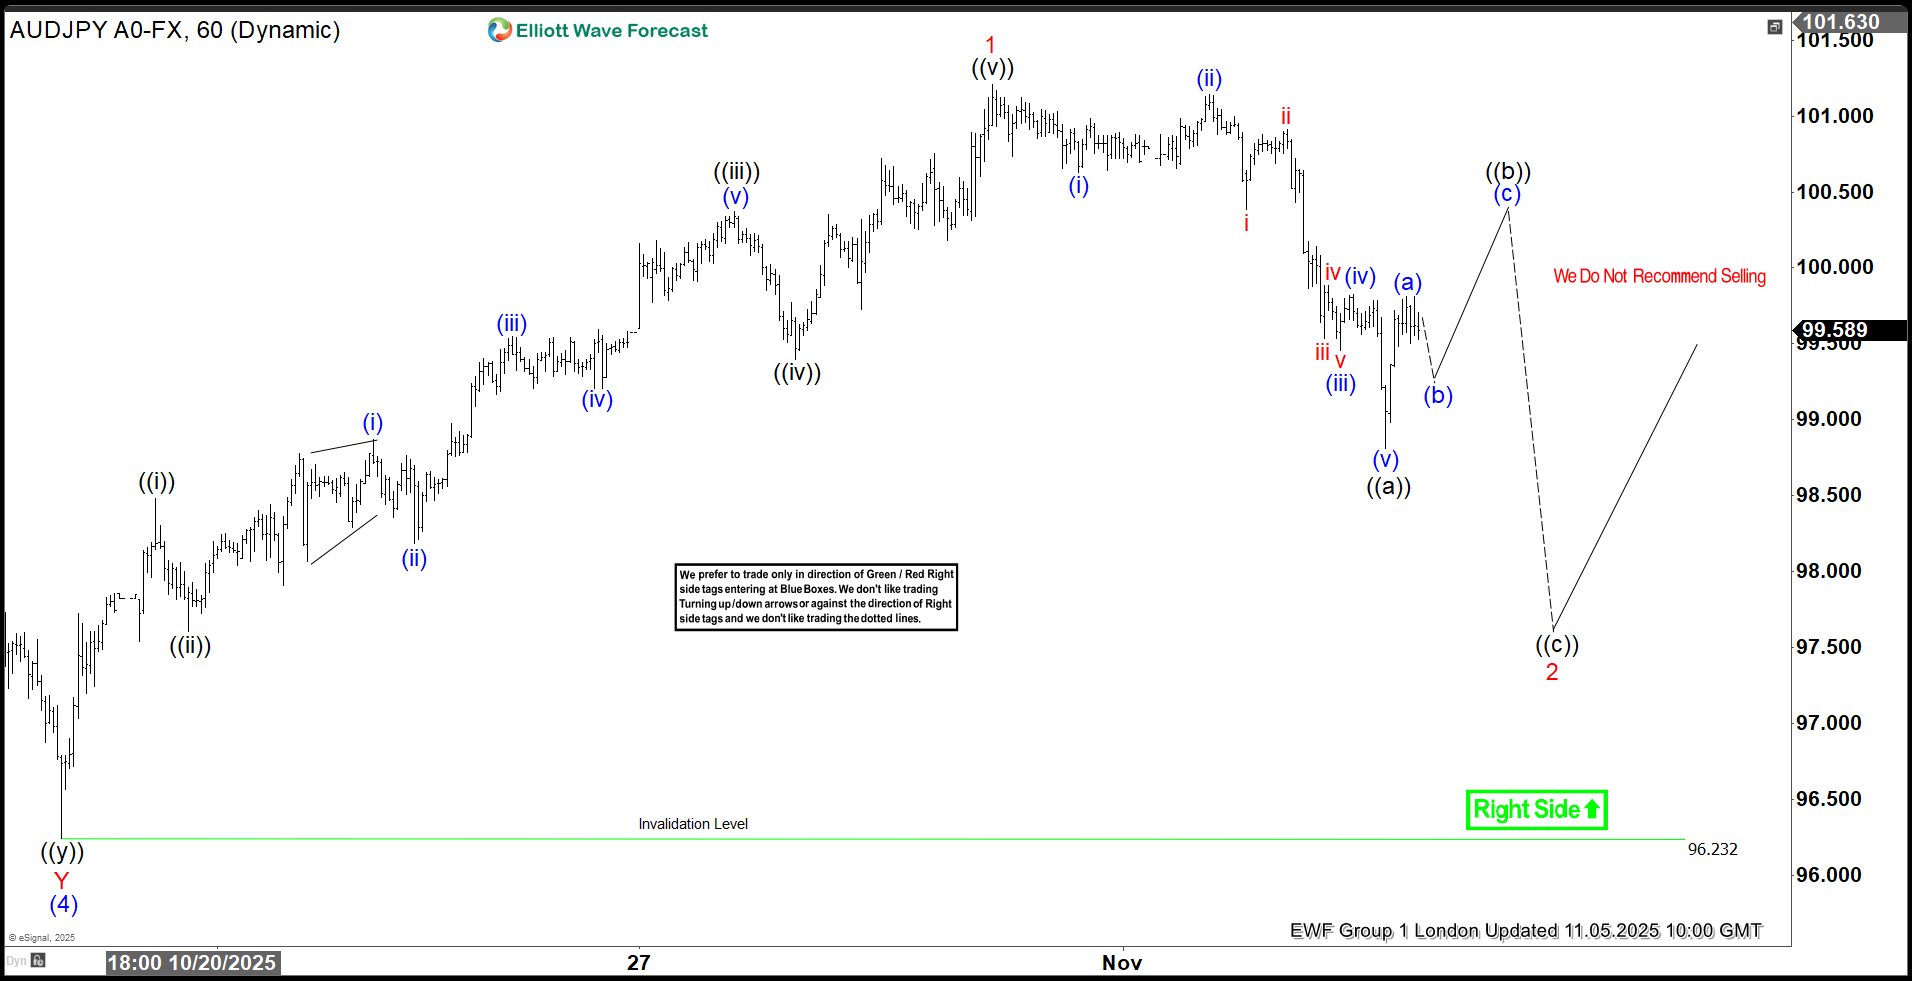
AUDJPY 1-Hour Elliott Wave Analysis 11.07.2025
AUDJPY completed a 3-wave bounce in wave ((b)) black, right within the 50%–61.8% Fibonacci retracement zone (100.017–100.293), as expected. From that area, the pair experienced a sharp decline.
While below the 100.40 high, we can count wave ((b)) as completed, and the pair can continue trading lower within wave ((c)). The next potential target area for buyers is seen at 97.97 -97.48.