
Sample Category Title
Weekly Focus – Rising US Job Cuts Add Uncertainty to Markets
While the US government is still in shutdown, we are not getting much official data. This puts more focus on private releases and this week we got mixed data for the US labour market. The ADP employment number for October surprised to the upside with a gain of 42k following a drop of 29k in September. However, the Challenger data on announced job cuts showed a sharp rise in layoffs to the highest level since the pandemic. A concerning signal for future employment data.
The US government shutdown, the longest in history, might be nearing its end. Some Republicans are reportedly warming up to the idea of extending the ACA/Obamacare health insurance subsidies that Democrats are demanding. The most likely path seems to be that Congress first passes a short-term 'CR' funding bill until the end of the year, and the finalizes the full-year funding with the ACA extensions included.
US Supreme Court started hearings on the legality of Trump's tariffs on Wednesday, which revealed scepticism among even some of the conservative judges. With a 6-3 split between conservative vs. liberal judges in the court only two conservatives need to vote against the lawfulness of the tariffs. If the court rules against Trump the administration is likely to invoke Section 122 of Trade Act of 1974, which explicitly allows president to set up 15% universal tariffs for 150 days almost immediately. This would buy time for crafting a longer-term plan. We will likely get a ruling during the next month.
In the euro zone service PMI for October was revised higher to a strong reading of 53.0, the highest level in more than a year. It follows data last week showing rising German business expectations and higher euro consumer confidence. With fiscal easing on the horizon, it underpins our view of decent growth outlook and the ECB staying on hold.
China PMIs for October disappointed with a decline in both the official as well as private versions. However, it was driven by a sharp decline in export orders, which was likely related to Trump's threat of 100% tariffs in October, and we look for a rebound in November after the trade deal instead led to a 10% tariff reduction on China.
Bond yields were on a rollercoaster this week initially rising on decent ADP employment but falling again when the rise in job cuts was released Thursday. Stocks were on the backfoot as bubble concerns crept into markets and the high job cuts spurred concerns over the economy. The USD ended the week broadly flat mirroring the shifts in US bond yields.
Next week is still rather light on market movers due to the US government shutdown. In the euro zone we get the Euro Sentix survey and German ZEW, which sometimes give a good lead on PMIs. US NFIB Small Business Optimism also has some labour market components that has extra focus right now. China releases the monthly batch of data for retail sales, industrial production, home sales and house prices.
Canadian Employment Shoots Higher – CAD Takes the Lead
Amid the absence of key US labor data during the longest US government shutdown in history (which has undoubtedly started to weigh on market sentiment, look at stocks this week!), the northern neighbor Canada was still able to deliver a surprise to traders.
The Canadian labor market delivered a second consecutive beat in employment growth, reporting an actual gain of 66.6K jobs (exp -2.5K).
This unexpected surge provides a much-needed lift.: while Canada has been struggling with tariffs biting into some of its key sectors, notably metals and lumber, this comeback in employment marks some slow but tangible regaining of confidence from businesses after what was a rough summer.
However, a closer look reveals that most of these jobs added have been part-time positions.
While this headline beat provided an immediate and strong boost to the Canadian Dollar (CAD), the key question remains whether the market can hold today's current strength without a corresponding increase in full-time employment.
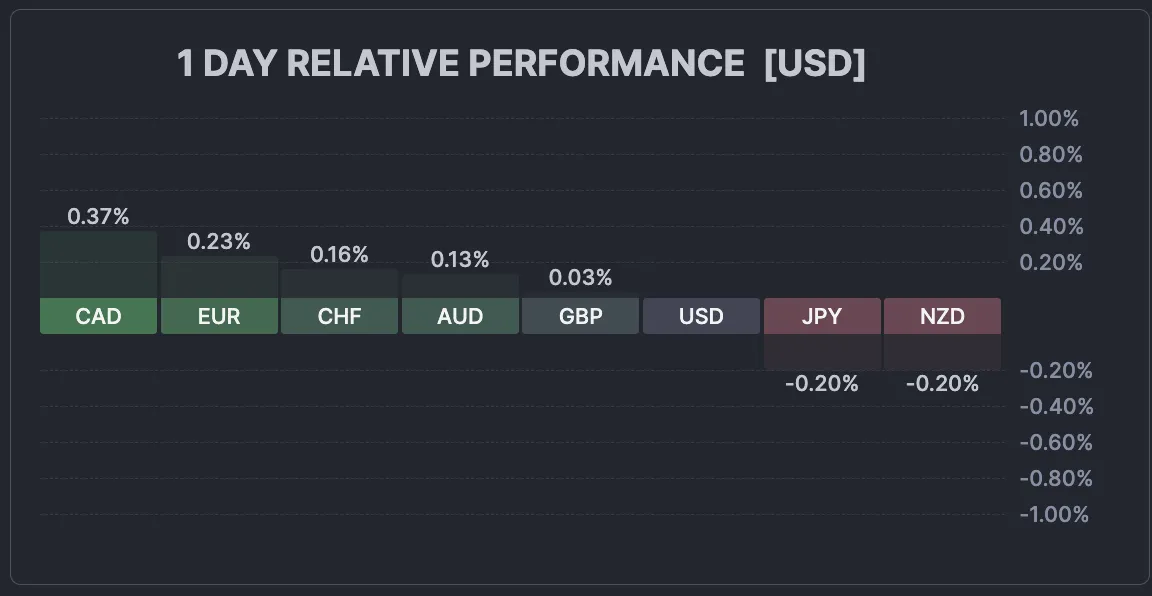
The Canadian Dollar takes the lead on the FX space – November 7, 2025 – Source: Finviz
This is at least a more positive report which may just be the light at the end of the tunnel for the land of Maple Syrup.
Let's now take a look at multi-timeframe charts for USD/CAD to see where this fundamental surprise could take the pair.
USD/CAD multi-timeframe technical analysis
Daily Chart
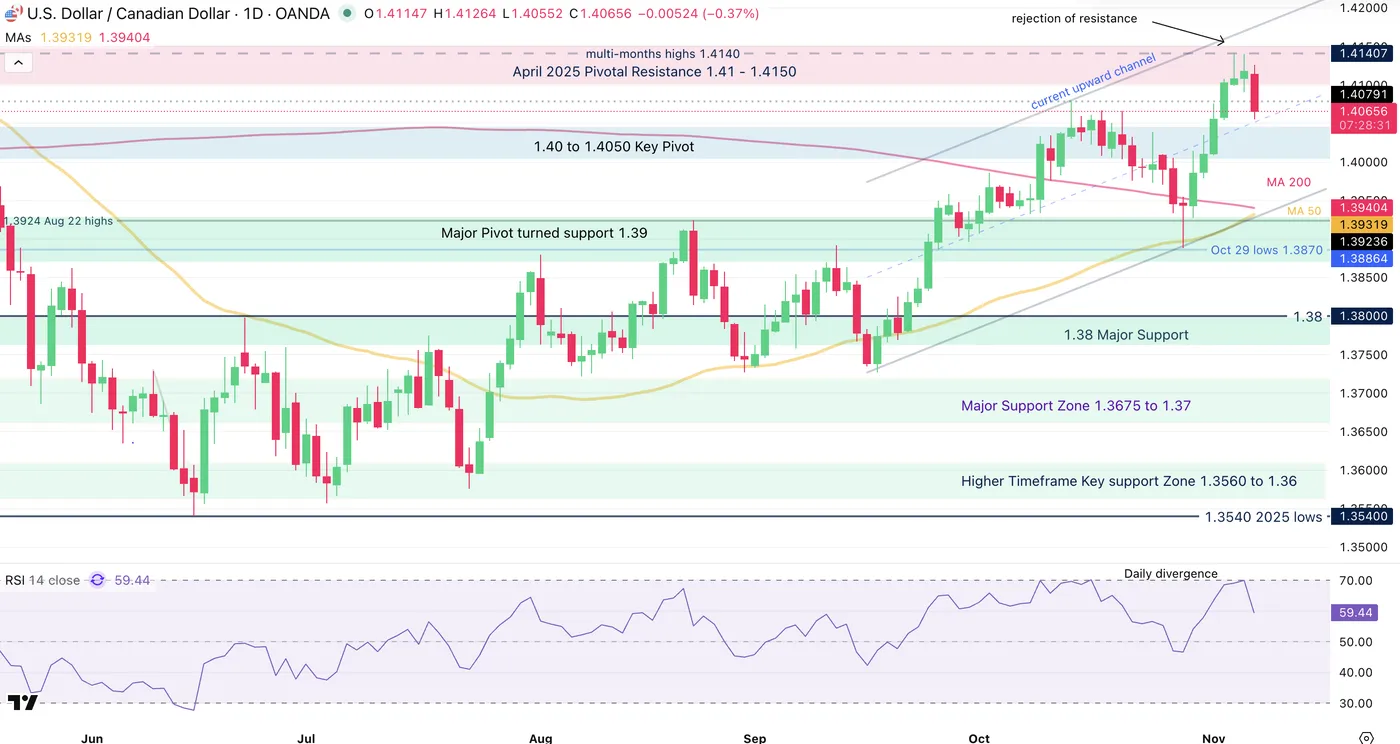
USD/CAD Daily Chart, November 7, 2025 – Source: TradingView
Today's candle marks the first red candle in the North American pair in 7 sessions.
Some slowing down in buying had brought a double-top RSI divergence which is now seeing some consequences.
The Canadian Dollar has been bleeding for a while with the latest turmoil in US-Canada trade talks – For now, price action remains above the Daily pivot region (1.40 to 1.4050).
4H Chart and levels
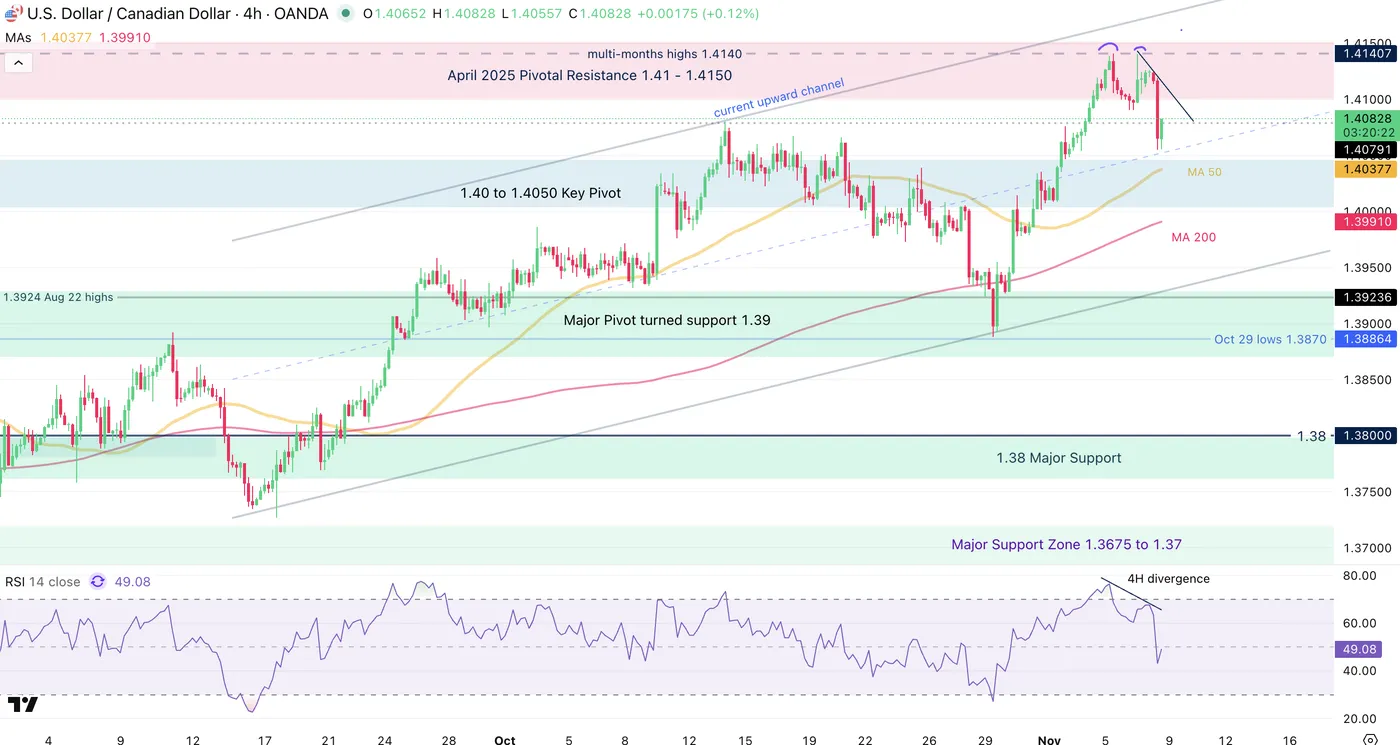
USD/CAD 4H Chart, November 7, 2025 – Source: TradingView
Levels to place on your USD/CAD charts:
Resistance Levels
- April 2025 Pivotal Resistance 1.41 - 1.4150
- Nov 5 weekly and multi-month highs 1.4140
- Key resistance 1.4250
Support Levels
- 1.40 to 1.4050 Key Pivot (4H MA 50)
- Major Daily Pivot 1.39 (+/- 200 pips)
- 1.38 Major support +/- 150 pips
- 1.3550 Main 2025 Support
1H Chart
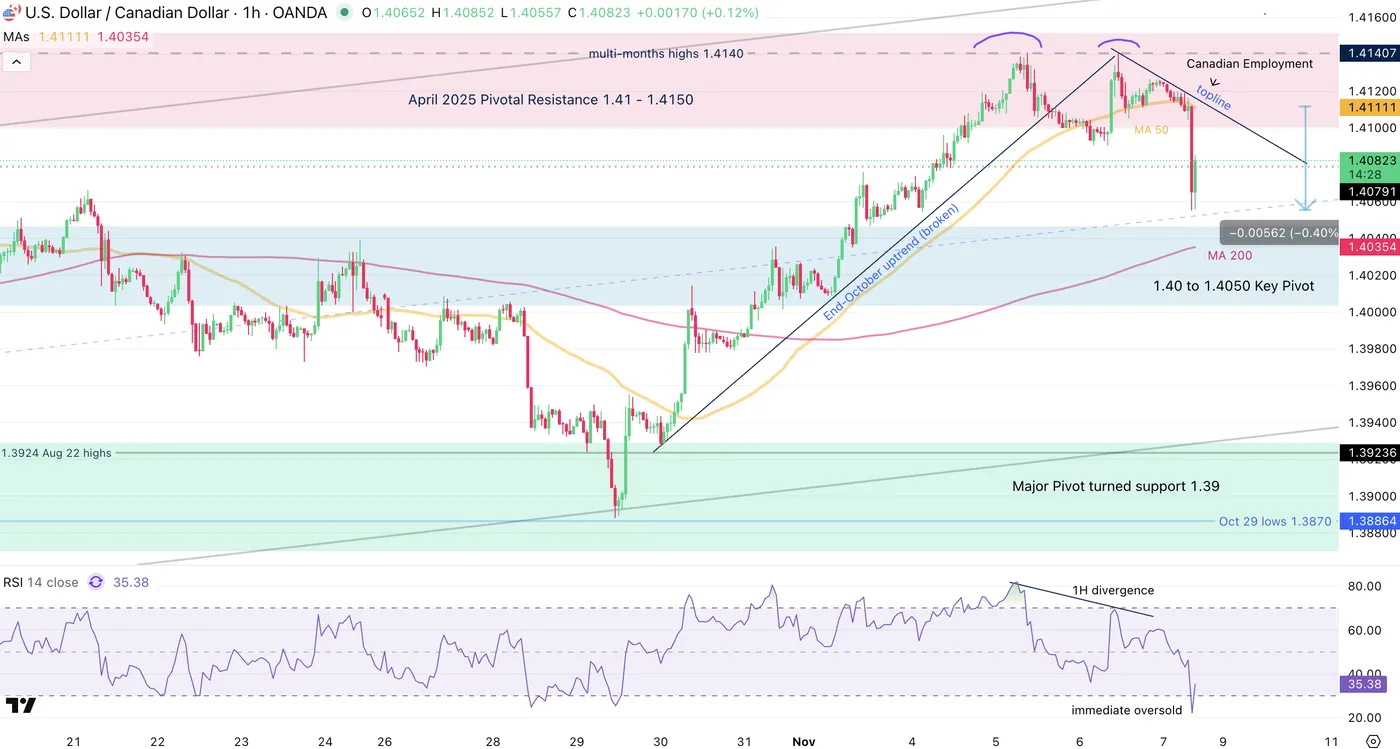
USD/CAD 1H Chart, November 7, 2025 – Source: TradingView
Looking even closer, the divergence happened on all timeframes which magnified this morning's 600 pip move in the pair.
Oversold RSI on the short timeframe prompts small mean-reversion, but as markets head into the weekly close, check if buyers manage to close the week above 1.41.
Failing to do so adds more probabilities of a short-term reversal within the upward channel (upper bound recently tested)
While the market awaits more developments on trade deals, the main aspects to watch for USD/CAD are:
- Is confidence coming back for Canadian businesses? Look at upcoming Canadian PMI data and retails sales; Stronger data there could support CAD strength
- Is the US Dollar still on its run higher or has it found a local top?
- The usual rate differential: A more hawkish Fed boosted the US Dollar. Look out for Federal Reserve speeches
Safe Trades!
Sunset Market Commentary
Markets
Fragile risk sentiment is still name of the game with main European and US equity markets losing up and over 1%. We don’t see the classic risk-off correlations with core bonds losings marginally ground as well, while the dollar fails to make ground beyond tested resistance levels. Lack of eco data give the opportunity to dive somewhat deeper into several comments by Fed governors today and yesterday. Vice chair Jefferson endorsed the risk management motive that prompted 25 bps rate cuts in September and October but thinks that it makes sense to proceed slowly as we approach the neutral rate. He blames the recent lack of progress in the disinflation appears on tariffs, but still sees underlying inflation progressing to 2%. Chicago Fed Goolsbee (voter) is uneasy with the current shortage of economic numbers. Especially as there aren’t as many private-sector data sources for inflation as there are for the labor market. It makes him feel uneasy as it would take a fair amount of time before any potential problems on the inflation side pop up. He therefore leans more to be “a little careful and slow down when it’s foggy”. St. Louis Fed Musalem (voter) believes that monetary policy is now somewhere between modestly restrictive and neutral. In terms of financial conditions, it’s even getting close to neutral. He wants the Fed to be very careful to continue to lean against above-target inflation. While he acknowledges downside risks to the labor market, he’s happy with the insurance against that risks that the Fed already provided with back-to-back rate cuts. Both Goolsbee and Musalem seems to be preparing to line up with Kansas City Fed Schmid in voting for an unchanged policy rate in December. Schmid already did so in October. Cleveland Fed Hammack (non-voter) is on the same (hawkish) line, labelling inflation a bigger concern than the labor market right now. She argues for a mildly restrictive monetary policy stance to ensure that inflation returns to 2% in timely fashion, adding that the current stance is barely restrictive. Finally, NY Fed Williams elaborated on the ending of quantitative tightening. Recent sustained repo market pressures and other growing sings of reserves moving from abundant to ample justify the decision to end QT starting December 1st. He added that the Fed may soon switch from keeping its balance sheet steady (implying a further mechanical shrinking of reserves) to begin reserve management bond buying. That would obviously be a technical measure and not a signal of a monetary shift.
News & Views
Canadia labour market data for October for the second consecutive month surprised sharply to the upside. The economy added 66.6k jobs, after a rise of 60.4 k in September. The market expected a slight monthly decline. The rise in employment was entirely due to part-time employment (+85.1k). Full time employment declined 18.5k, but coming after a sharp 106.1 k rise in the previous month. The participation rate rose 65.3% from 65.2%. The unemployment rate eased from 7.1% tot 6.9%. Average hourly wages increased 3.5%Y/Y from 3.3% in September. End last month, the Bank of Canada (BoC) cut its policy rate by 25 bps (to 2.25%) as it expected the economy to remain weak in H2 due to the fall-out from the trade tensions with the US. Even so, the BoC then already indicated that “if inflation and economic activity evolve broadly in line with the October projection, the Governing Council sees the current policy rate at about the right level to keep inflation close to 2% while helping the economy through this period of structural adjustment”. Today’s data only reinforce that view. The 2-y Canada Bond yield rises 5.5 bps to 2.44%. The Canadian dollar strengthens from USD/CAD 1.411 to 1.4065.
Dovish Polish NBP member Kotecki expects the recent benign inflation path to continue toward the 2.5% inflation target. Inflation might already come close to that level in November. The current 145 bps inflation-adjusted, real, policy rate still provides room some further easing towards a potential endpoint for the cycle in the 3.75%-4% range, maybe closer to 3.75% in H1 of next year. A terminal rate of 3.5% only would be possible if inflation fell permanently below target amid slowing growth. That’s not a scenario emerging from current forecasts. The NBP today released its November inflation report. The central path for inflation stands at 3.7%, 2.9% and 2.5% for the 2025-2027 period. GDP growth at 3.4%, 3.7% and 2.6%. Kotecki also indicated that a rate cut in December is rather unusual, but can’t be complete ruled out. The zloty continues trading in a tight range near EUR/PLN 4.25.
U.S. UoM consumer sentiment slides to 50.3 as shutdown worries weigh
U.S. consumer confidence weakened sharply in November as the University of Michigan Consumer Sentiment Index fell to 50.3, down from 53.6 and below expectations of 53.2. Both key subcomponents declined: the Current Economic Conditions Index plunged to 52.3 from 58.6. Expectations Index slipped to 49.0 from 50.3, reflecting broad concern about the economic outlook.
The survey noted that sentiment deteriorated amid growing anxiety over the federal government shutdown, which has now stretched beyond a month.
Inflation expectations also ticked higher, with the one-year outlook rising to 4.7% from 4.6% in October.
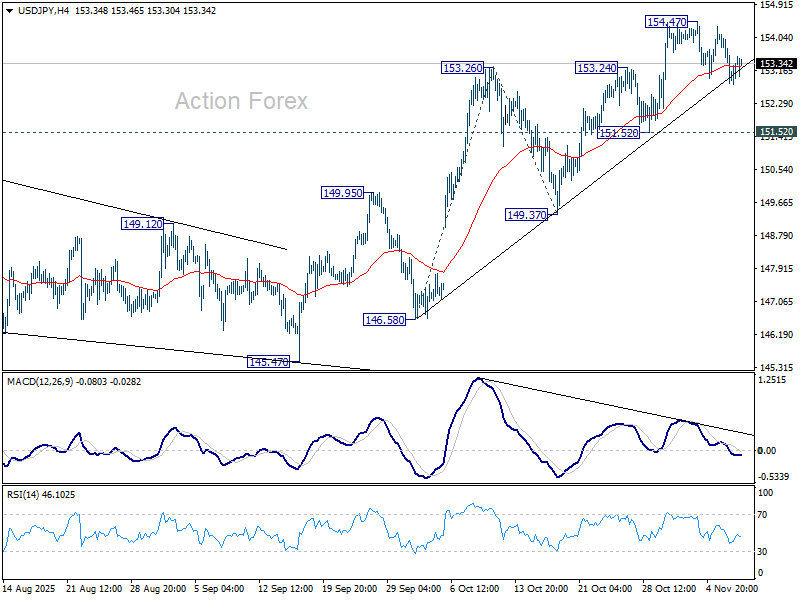
USD/JPY Mid-Day Outlook
Daily Pivots: (S1) 152.55; (P) 153.35; (R1) 153.86; More...
USD/JPY is still bounded in consolidations below 154.47 and intraday bias stays neutral. Further rally is expected as long as 151.52 support holds. Above 154.47 will resume larger rise from 139.87 to 100% projection of 146.58 to 153.26 from 149.37 at 156.05. Break there will pave the way to 158.85 key structural resistance.
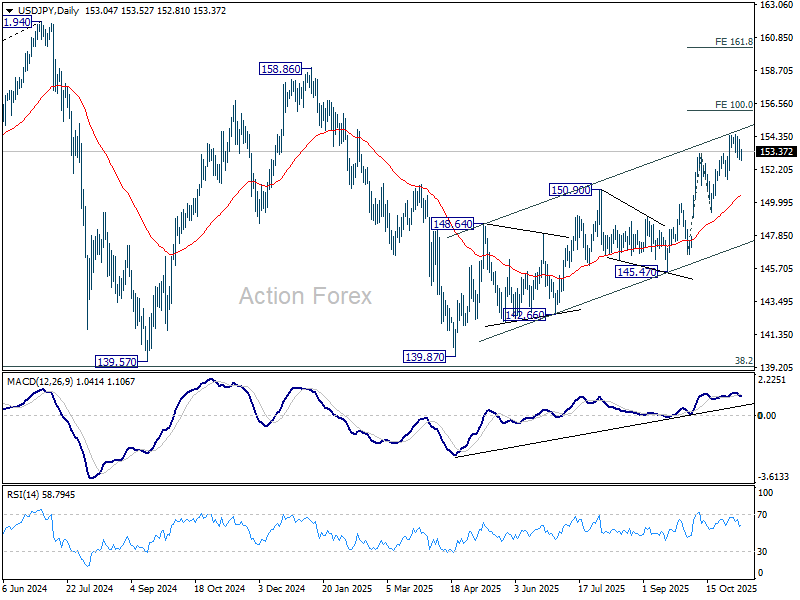
In the bigger picture, current development suggests that corrective pattern from 161.94 (2024 high) has completed with three waves at 139.87. Larger up trend from 102.58 (2021 low) could be ready to resume through 161.94 high. On the downside, break of 145.47 support will dampen this bullish view and extend the corrective pattern with another falling leg.
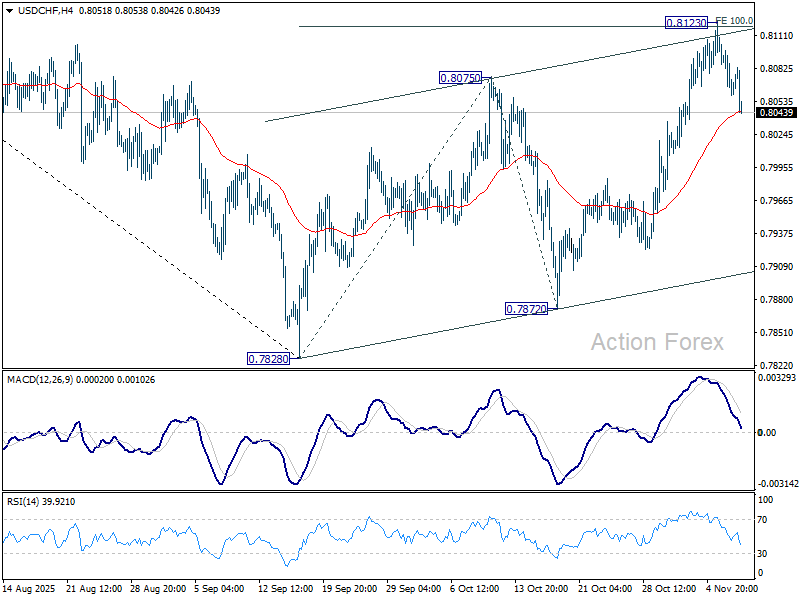
USD/CHF Mid-Day Outlook
Daily Pivots: (S1) 0.8045; (P) 0.8076; (R1) 0.8092; More…
Intraday bias in USD/CHF remains on neutral for the moment. On the upside, firm break of 0.8123 will extend the corrective rally from 0.7828 to 138.2% projection of 0.7828 to 0.8075 from 0.7872 at 0.8213. On the downside, sustained break of 55 D EMA (now at 0.8007) will argue that the corrective bounce has completed and bring retest of 0.7828 low.
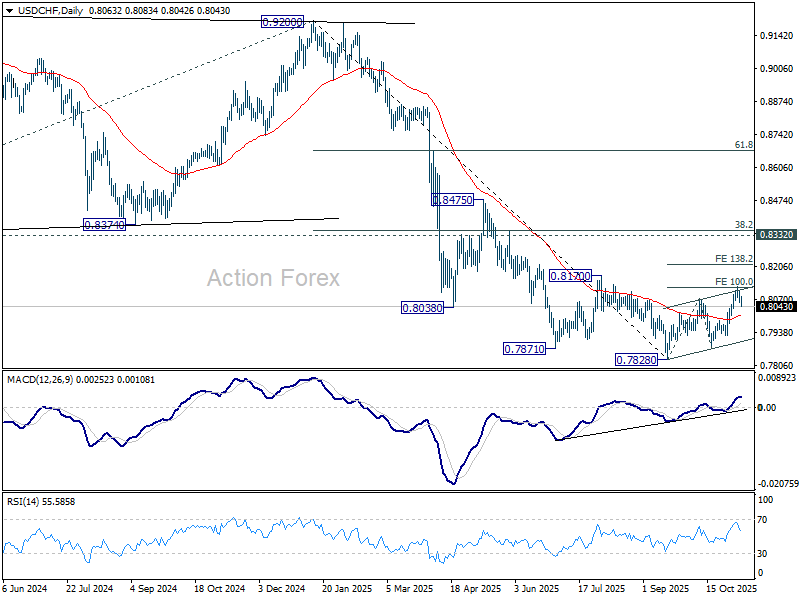
In the bigger picture, long term down trend from 1.0342 (2017 high) is still in progress. Next target is 100% projection of 1.0146 (2022 high) to 0.8332 from 0.9200 at 0.7382. In any case, outlook will stay bearish as long as 0.8332 support turned resistance holds (2023 low).
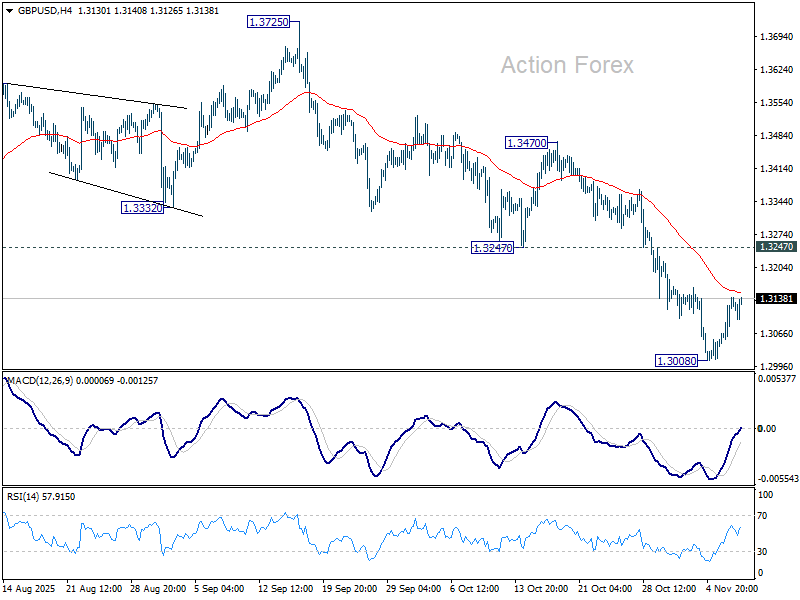
GBP/USD Mid-Day Outlook
Daily Pivots: (S1) 1.3075; (P) 1.3109; (R1) 1.3171; More...
Intraday bias in GBP/USD remains neutral and more consolidations could be seen above 1.3008. Further decline is expected with 1.3247 support turned resistance intact. Break of 1.3008 will resume the fall from 1.3787 and target 61.8% retracement of 1.2099 to 1.3787 at 1.2744. Sustained break there will pave the way to 1.2099 support next.
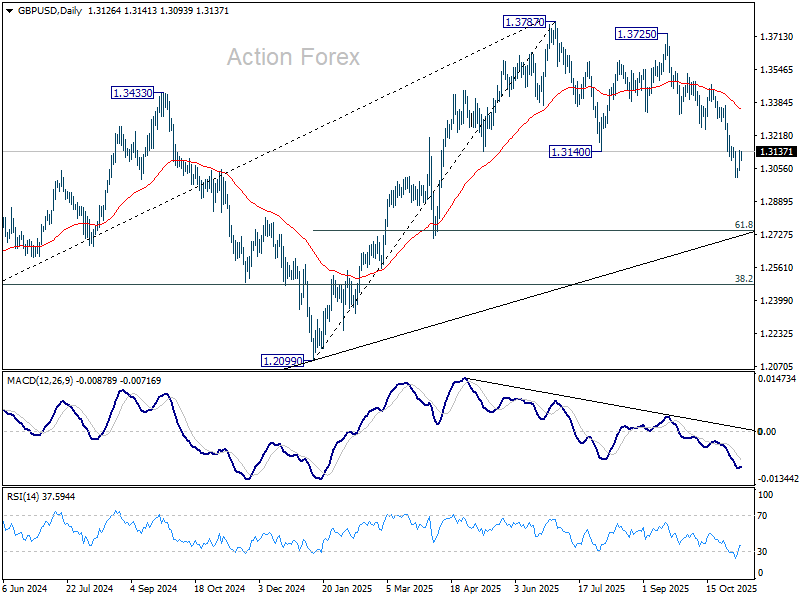
In the bigger picture, the break of 55 W EMA (now at 1.3185) is taken as the first sign that corrective rise from 1.0351 (2022 low) has completed. Decisive break of trend line support (now at 1.2780) will solidify this case and target 38.2% retracement of 1.0351 to 1.3787 at 1.2474 next. Meanwhile, in case of another rise, strong resistance should emerge below 1.4248 (2021 high) to cap upside to preserve the long term down trend.
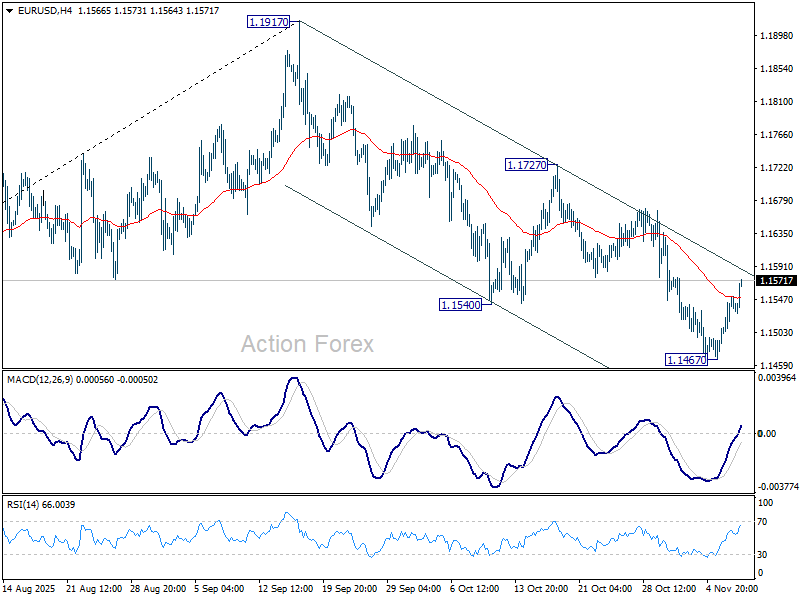
EUR/USD Mid-Day Outlook
Daily Pivots: (S1) 1.1508; (P) 1.1530; (R1) 1.1569; More…
EUR/USD's recovery form 1.1467 extended higher today but stays well inside near term falling channel. Intraday bias remains neutral and further decline is expected. On the downside, below 1.1467 will resume the fall from 1.1917. However, firm break of the channel resistance (now at 1.1589) will confirm short term bottoming, and turn bias back to the upside for 1.1727 resistance instead.
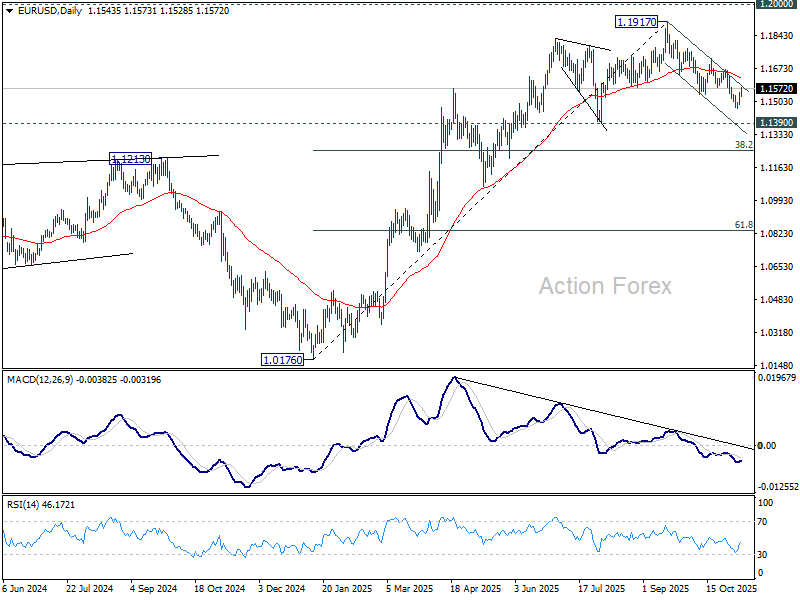
In the bigger picture, considering bearish divergence condition in D MACD, a medium term top is likely in place at 1.1917, just ahead of 1.2 key psychological level. As long as 55 W EMA (now at 1.1306) holds, the up trend from 0.9534 (2022 low) is still expected to continue. Decisive break of 1.2000 will carry larger bullish implications. However, sustained trading below 55 W EMA will argue that rise from 0.9534 has completed as a three wave corrective bounce, and keep outlook bearish.
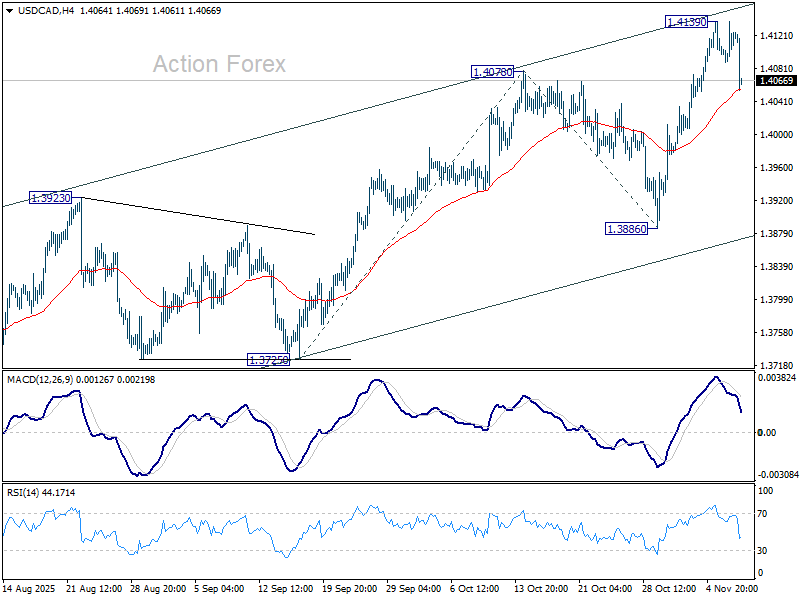
USD/CAD Mid-Day Outlook
Daily Pivots: (S1) 1.4091; (P) 1.4116; (R1) 1.4141; More...
USD/CAD dips notably in early US session but stays above 55 4H EMA (now at 1.4055) so far. Intraday bias remains neutral first. On the upside break of 1.4139 will resume larger rally from 1.3538 to 100% projection of 1.3725 to 1.4078 from 1.3886 at 1.4239. However, sustained break of 55 4H EMA (now at 1.4052) will bring deeper fall back to 1.3886 support instead.
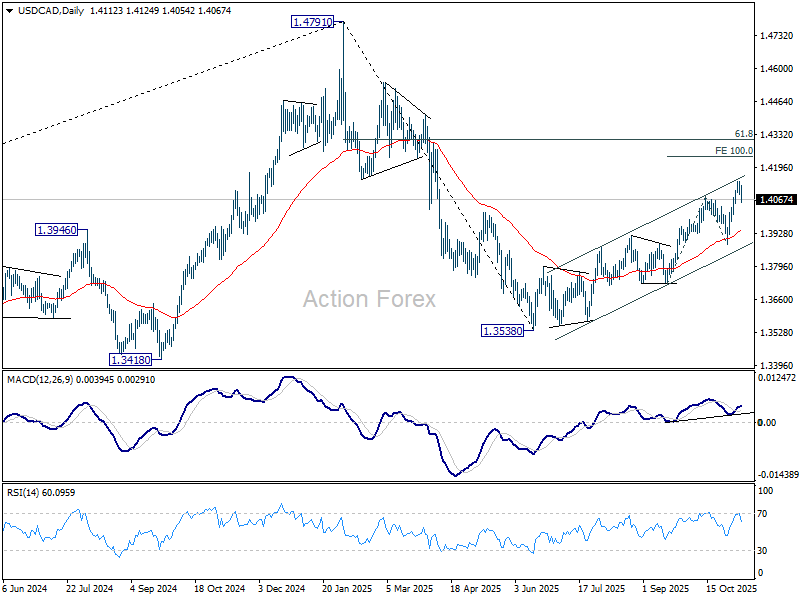
In the bigger picture, price actions from 1.4791 medium term top is likely just unfolding as a correction to up trend from 1.2005 (2021 low). Based on current momentum, rise from 1.3538 is the second leg, and a third leg should follow before up trend resumption. That is, range trading is set to extend for the medium term. For now, this will remain the favored case as long as 1.3886 support holds. However, firm break of 1.3886 will revive the case that fall from 1.4791 is indeed a larger scale correction.
Loonie Lifts on Strong Jobs Data as Global Risk Mood Stays Sour
Canadian Dollar firmed sharply in early U.S. session after a surprisingly strong set of October employment figures. While the gains were largely driven by part-time positions, the sheer magnitude of the increase — a second consecutive month of robust job creation — underscores that momentum is returning to the Canadian economy even amid lingering trade-related headwinds.
For the BoC, today’s data should come as a welcome relief. It suggests the economy is regaining traction after months of tariff-induced uncertainty, and that further near-term monetary stimulus may not be necessary. The employment resilience aligns with Governor Tiff Macklem’s recent remarks that interest rates are now “at the right level” for policymakers to pause and assess how structural adjustments from trade frictions unfold.
Beyond Canada, global market sentiment remains broadly cautious. Risk aversion continues to dominate, with equity weakness extending from Asia into Europe. The tone remains fragile following renewed concerns about an extended correction in technology and AI-linked stocks, which triggered sharp declines earlier in the week.
Major European indices are trading lower, mirroring losses in Asia. At the time of writing, FTSE is down -0.78%, DAX -0.98%, and CAC -0.47%, while government bond yields are slightly higher, with UK 10-year gilt yield rising to 4.48% and Germany’s bund yield at 2.67%. Earlier in Asia, Nikkei fell -1.19%, Hong Kong HSI -0.92%, and China Shanghai SSE -0.25%, with Singapore’s Strait Times the lone gainer, up 0.16%.
In the U.S., futures are pointing to a weaker open while 10-year Treasury yield has climbed back above 4.1%. The next test for sentiment will be whether the AI selloff that began earlier in the week continues to gather steam into the weekend.
In currency markets, for the week so far, Kiwi and Aussie remain the weakest performers, while the Loonie, though still soft overall, could climb up the ranks if momentum extends. Meanwhile, Yen remains the strongest currency, followed by Euro and Dollar. Sterling and Swiss Franc sit in the middle of the pack.
Canada employment surges 66.6k in October, driven by part-time work
Canada’s labor market surprised to the upside once again in October, as employment jumped by 66.6k, far exceeding expectations of -4k decline. The robust increase followed an already strong 60.4k rise in September, signaling that continuous hiring momentum. Unemployment rate slipped from 7.1% to 6.9%, beating forecasts for 7.2%, while employment rate edged up from 60.6% to 60.8%.
However, the composition of the October gains was less encouraging. The headline strength was largely driven by part-time positions, which rose by 85k, while full-time employment contracted. On a more positive note, private-sector jobs increased by 73k, marking the first rise since June,.
Wage data also showed mild upward pressure, with average hourly pay up 3.5% yoy, accelerating from 3.3% yoy in September.
Fed's Jefferson: Economy holding up, to proceed cautiously near neutral
Fed Vice Chair Philip Jefferson said in speech today that despite the lack of official data amid the ongoing U.S. government shutdown, private-sector indicators show the overall economy "has not changed much" in recent months. Growth continues at a moderate pace, while the labor market appears to be gradually cooling.
On inflation, Jefferson acknowledged that price growth remains elevated, but he attributed the "lack of progress in headline inflation" largely to tariff effects. He noted that underlying inflation measures continue to “make progress” toward target.
Jefferson reiterated his support for last week’s 25bps rate cut given the shift in risks toward weaker employment. He added that the policy stance remains somewhat restrictive but is now closer to neutral, making it sensible for the Fed to “proceed slowly” from here.
Looking ahead, Jefferson emphasized that future policy decisions will be made on a meeting-by-meeting basis. With the government shutdown likely to continue suppressing key releases before December, "this approach is especially prudent".
China exports fall -1.1% in October as tariff frontloading fades
China’s trade momentum faltered in October, with exports contracting -1.1% yoy, far below expectations for a 3.0% rise and the weakest reading since February. The figures suggest that the earlier tariff frontloading surge has fully dissipated, exposing underlying fragility in external demand. In particular, shipments to the U.S. tumbled -25.2% yoy, extending a seven-month run of double-digit declines. Exports to the EU inched up 0.9% and to ASEAN gained 8.9%.
Imports increased a modest 1.0% yoy, missing forecasts of 3.2%, as domestic consumption and industrial demand was muted. Purchases from the U.S. fell -23%, underlining the structural damage caused by persistent tariff barriers. Trade surplus stood at USD 90.07 B, reflecting sluggish imports rather than export strength.
The trade figures come amid renewed political friction between Beijing and Washington. Early October saw tensions flare after US President Donald Trump threatened 100% tariffs in response to China’s decision to expand export controls on rare earth metals. A meeting between Trump and President Xi Jinping in South Korea last week helped ease market nerves, resulting in a one-year extension of the bilateral truce that had been due to expire on November 10.
Still, the truce provides only limited near-term relief. U.S.-bound Chinese exports continue to face average tariffs of about 45%, well above the profit-neutral level of 35% identified by analysts.
USD/CAD Mid-Day Outlook
Daily Pivots: (S1) 1.4091; (P) 1.4116; (R1) 1.4141; More...
USD/CAD dips notably in early US session but stays above 55 4H EMA (now at 1.4055) so far. Intraday bias remains neutral first. On the upside break of 1.4139 will resume larger rally from 1.3538 to 100% projection of 1.3725 to 1.4078 from 1.3886 at 1.4239. However, sustained break of 55 4H EMA (now at 1.4052) will bring deeper fall back to 1.3886 support instead.
In the bigger picture, price actions from 1.4791 medium term top is likely just unfolding as a correction to up trend from 1.2005 (2021 low). Based on current momentum, rise from 1.3538 is the second leg, and a third leg should follow before up trend resumption. That is, range trading is set to extend for the medium term. For now, this will remain the favored case as long as 1.3886 support holds. However, firm break of 1.3886 will revive the case that fall from 1.4791 is indeed a larger scale correction.