Sample Category Title
USD/CAD Daily Outlook
Daily Pivots: (S1) 1.4091; (P) 1.4116; (R1) 1.4141; More...
Intraday bias in USD/CAD remains neutral and more consolidations could be seen below 1.4139 temporary top. On the upside break of 1.4139 will resume larger rally from 1.3538 to 100% projection of 1.3725 to 1.4078 from 1.3886 at 1.4239. However, sustained break of 55 4H EMA (now at 1.4052) will bring deeper fall back to 1.3886 support instead.
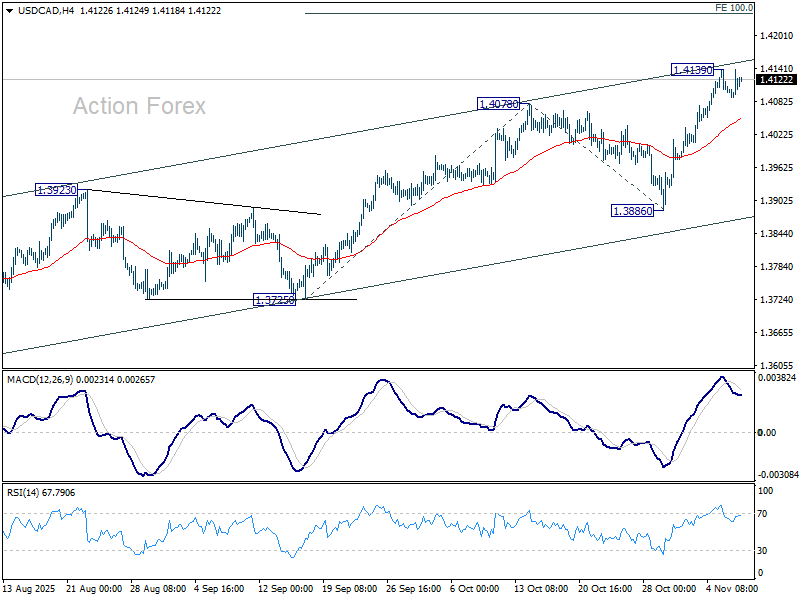
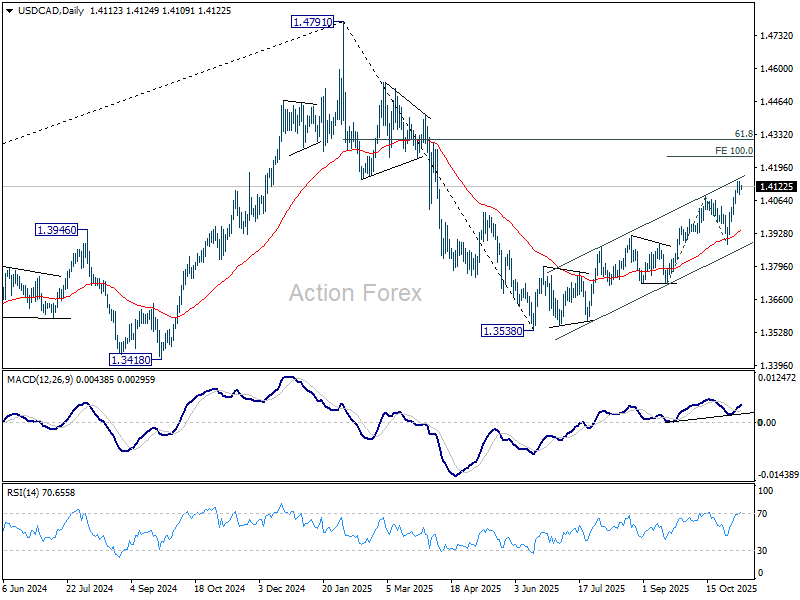
In the bigger picture, price actions from 1.4791 medium term top is likely just unfolding as a correction to up trend from 1.2005 (2021 low). Based on current momentum, rise from 1.3538 is the second leg, and a third leg should follow before up trend resumption. That is, range trading is set to extend for the medium term. For now, this will remain the favored case as long as 1.3886 support holds. However, firm break of 1.3886 will revive the case that fall from 1.4791 is indeed a larger scale correction.
Risk-Off Reigns: Tech Selloff, China Trade Miss, and U.S. Layoffs Hit Sentiment
Global markets turned defensive again as risk aversion returned, led by a renewed wave of selling in technology shares. The U.S. tech rout, which rattled Wall Street overnight, spread to Asia, triggering broad weakness across regional equity markets. Japan was hit especially hard, with SoftBank and semiconductor names leading the decline. Traders noted growing anxiety that the earlier AI rally may have reached overbought extremes, prompting profit-taking and algorithmic unwinds.
Additionally, investor nerves were compounded by signs of strain in the U.S. labor market, as well as poor trade data from China. In the US, layoff tracker data showed that over 153k job cuts were announced in October, marking the worst October figure in more than two decades. The sudden spike in layoffs adds to fears that labor market conditions are softening faster than expected, particularly troubling given the absence of key economic releases during the prolonged U.S. government shutdown. The lack of official data leaves policymakers and markets alike flying partly blind.
Meanwhile, China’s October trade report dealt another blow to sentiment. The fading of tariff frontloading has left China’s export engine sputtering, and with U.S. demand constrained by tariffs and sluggish global trade, Beijing now faces the challenge of reigniting domestic demand to fill the gap. Yet, confidence remains fragile, with investors wary that further delays in stimulus rollouts could deepen the slowdown.
Currency markets reflected the risk-off tone, with Yen leading the pack for the week so far, followed by Euro and Dollar. Kiwi remained the weakest, trailed by Aussie and Loonie, while Sterling and the Franc stayed mid-range.
In Asia, at the time of writing, Nikkei is down -1.72%. Hong Kong HSI is down -0.94%. China Shanghai SSE is down -0.06%. Singapore Strait Times is down -0.10%. Japan 10-year JGB yield is flat at 1.684. Overnight, DOW fell -0.84%. S&P 500 fell -1.12%. NASDAQ fell -1.90%. 10-year yield fell -0.064 to 4.093.
China exports fall -1.1% in October as tariff frontloading fades
China’s trade momentum faltered in October, with exports contracting -1.1% yoy, far below expectations for a 3.0% rise and the weakest reading since February. The figures suggest that the earlier tariff frontloading surge has fully dissipated, exposing underlying fragility in external demand. In particular, shipments to the U.S. tumbled -25.2% yoy, extending a seven-month run of double-digit declines. Exports to the EU inched up 0.9% and to ASEAN gained 8.9%.
Imports increased a modest 1.0% yoy, missing forecasts of 3.2%, as domestic consumption and industrial demand was muted. Purchases from the U.S. fell -23%, underlining the structural damage caused by persistent tariff barriers. Trade surplus stood at USD 90.07 B, reflecting sluggish imports rather than export strength.
The trade figures come amid renewed political friction between Beijing and Washington. Early October saw tensions flare after US President Donald Trump threatened 100% tariffs in response to China’s decision to expand export controls on rare earth metals. A meeting between Trump and President Xi Jinping in South Korea last week helped ease market nerves, resulting in a one-year extension of the bilateral truce that had been due to expire on November 10.
Still, the truce provides only limited near-term relief. U.S.-bound Chinese exports continue to face average tariffs of about 45%, well above the profit-neutral level of 35% identified by analysts.
Fed’s Hammack: Policy barely restrictive, inflation still too high
Cleveland Fed President Beth Hammack struck a notably hawkish tone overnight, warning that monetary policy remains only “barely restrictive” after last week’s rate cut. She remains concerned about high inflation and believes policy should continue “leaning against it.” She reiterated her opposition to the Fed’s decision to lower the federal funds rate by 25bps to 3.75%–4.00%.
Hammack said policy should stay "mildly restrictive" to ensure inflation returns to the 2% objective in a “timely fashion” while minimizing risks to employment. She forecast inflation to end the year near 3%, remaining elevated through 2026 before gradually easing back toward target.
On the labor front, Hammack said she does not assign high odds to a downturn, though subdued hiring may point to “more fragility”.
Fed’s Musalem: Policy near neutral, tariff impact on inflation to fade in 2026
St. Louis Fed President Alberto Musalem said overnight that this year’s interest-rate cuts have been “appropriate”, but warned that policymakers must remain cautious about inflation risks. Speaking at an event, he emphasized the need to “lean against above-target inflation while continuing to provide some insurance to the employment sector,” suggesting that while the easing cycle has helped stabilize growth, vigilance is still warranted as inflation remains above 2%.
Musalem described current monetary settings as “somewhere between modestly restrictive and neutral,” noting that financial conditions are now close to neutral and “rather supportive of economic activity and the labor market.”
On inflation drivers, Musalem highlighted U.S. trade tariffs as a lingering source of upward price pressure but said their impact has so far been blunted by corporate pricing restraint. He expects this effect to dissipate in the second half of 2026, paving the way for inflation to resume its gradual return toward the 2% target.
USD/CAD Daily Outlook
Daily Pivots: (S1) 1.4091; (P) 1.4116; (R1) 1.4141; More...
Intraday bias in USD/CAD remains neutral and more consolidations could be seen below 1.4139 temporary top. On the upside break of 1.4139 will resume larger rally from 1.3538 to 100% projection of 1.3725 to 1.4078 from 1.3886 at 1.4239. However, sustained break of 55 4H EMA (now at 1.4052) will bring deeper fall back to 1.3886 support instead.
In the bigger picture, price actions from 1.4791 medium term top is likely just unfolding as a correction to up trend from 1.2005 (2021 low). Based on current momentum, rise from 1.3538 is the second leg, and a third leg should follow before up trend resumption. That is, range trading is set to extend for the medium term. For now, this will remain the favored case as long as 1.3886 support holds. However, firm break of 1.3886 will revive the case that fall from 1.4791 is indeed a larger scale correction.
China exports fall -1.1% in October as tariff frontloading fades
China’s trade momentum faltered in October, with exports contracting -1.1% yoy, far below expectations for a 3.0% rise and the weakest reading since February. The figures suggest that the earlier tariff frontloading surge has fully dissipated, exposing underlying fragility in external demand. In particular, shipments to the U.S. tumbled -25.2% yoy, extending a seven-month run of double-digit declines. Exports to the EU inched up 0.9% and to ASEAN gained 8.9%.
Imports increased a modest 1.0% yoy, missing forecasts of 3.2%, as domestic consumption and industrial demand was muted. Purchases from the U.S. fell -23%, underlining the structural damage caused by persistent tariff barriers. Trade surplus stood at USD 90.07 B, reflecting sluggish imports rather than export strength.
The trade figures come amid renewed political friction between Beijing and Washington. Early October saw tensions flare after US President Donald Trump threatened 100% tariffs in response to China’s decision to expand export controls on rare earth metals. A meeting between Trump and President Xi Jinping in South Korea last week helped ease market nerves, resulting in a one-year extension of the bilateral truce that had been due to expire on November 10.
Still, the truce provides only limited near-term relief. U.S.-bound Chinese exports continue to face average tariffs of about 45%, well above the profit-neutral level of 35% identified by analysts.
Fed’s Musalem: Policy near neutral, tariff impact on inflation to fade in 2026
St. Louis Fed President Alberto Musalem said overnight that this year’s interest-rate cuts have been “appropriate”, but warned that policymakers must remain cautious about inflation risks. Speaking at an event, he emphasized the need to “lean against above-target inflation while continuing to provide some insurance to the employment sector,” suggesting that while the easing cycle has helped stabilize growth, vigilance is still warranted as inflation remains above 2%.
Musalem described current monetary settings as “somewhere between modestly restrictive and neutral,” noting that financial conditions are now close to neutral and “rather supportive of economic activity and the labor market.”
On inflation drivers, Musalem highlighted U.S. trade tariffs as a lingering source of upward price pressure but said their impact has so far been blunted by corporate pricing restraint. He expects this effect to dissipate in the second half of 2026, paving the way for inflation to resume its gradual return toward the 2% target.
Fed’s Hammack: Policy barely restrictive, inflation still too high
Cleveland Fed President Beth Hammack struck a notably hawkish tone overnight, warning that monetary policy remains only “barely restrictive” after last week’s rate cut. She remains concerned about high inflation and believes policy should continue “leaning against it.” She reiterated her opposition to the Fed’s decision to lower the federal funds rate by 25bps to 3.75%–4.00%.
Hammack said policy should stay "mildly restrictive" to ensure inflation returns to the 2% objective in a “timely fashion” while minimizing risks to employment. She forecast inflation to end the year near 3%, remaining elevated through 2026 before gradually easing back toward target.
On the labor front, Hammack said she does not assign high odds to a downturn, though subdued hiring may point to “more fragility”.
Cliff Notes: Gaining Confidence With Inflation
Key insights from the week that was.
As Half Yours’ forged ahead to take the Melbourne Cup, RBA Governor Bullock and the Monetary Policy Board (MPB) made clear they are not willing to gamble on inflation’s return to target, opting to keep the cash rate on hold at 3.6% at their November meeting. The unanimous decision came as no surprise to market participants after annual trimmed mean inflation printed at 3.0%yr in Q3. The MPB conceded that some of this acceleration was due to “temporary factors”, but there was also “evidence of more persistence”. The RBA’s revised forecasts now see the unemployment rate at 4.4% over the forecast horizon (up from 4.3%), while underlying inflation holds above the mid-point of the target range through 2026, then draws close in 2027.
Highlighted by Westpac Chief Economist Luci Ellis in this week’s video update, with policy only mildly restrictive, the RBA can afford to keep the cash rate at current levels while it assesses the inflation trend for a couple more quarters without too much of a risk to activity. We expect two more 25bp rate cuts from the RBA, but not until May and August next year.
Turning to the outlook for the consumer. Our card activity data continues to point to a solid uptrend in consumer demand; however, the Q3 update on household spending muddied the waters, real spending surprising to the downside with a meagre 0.2% lift compared to Q2’s 0.9% gain. The susceptibility of household demand to sentiment and the cost of living was also called out by the RBA’s latest business liaison which characterised consumers as “value conscious”. We will receive a full update on consumer demand and household finances in the National Accounts release on 3 December, but this will only be for Q3. We may not get a full picture on the susceptibility of consumer demand to changing interest rate expectations until early-to-mid-2026.
The uncertainty over the timing and scale of further interest rate cuts notwithstanding, October’s Cotality data points to household wealth compounding at a rapid rate, with home prices across the major capital cities growing at a circa 12% annualised pace during the 3 months to October. The RBA believes these gains may boost spending in time. That said, one household’s gain is another’s loss vis a vis affordability; and an increase in spending ahead of income requires a willingness to dissave or take on additional debt. Bear in mind as well that the support afforded by rate cuts and policy measures such as the recent roll-out of the First Homebuyer Guarantee Scheme will fade in coming months as prices move higher. Tight supply, however, will remain a support for price growth for the foreseeable future.
Offshore, the data flow was again light as the current US Government shutdown became the longest ever. The ISM manufacturing and service PMIs point to soggy conditions, the headline indexes remaining below average and the employment measures consistent with an outright reduction in headcount in October. Challenger job cuts also spiked to the highest October reading in over 20 years, taking year-to-date job losses above 1 million. Challenger, Gray and Christmas report that the reductions have been concentrated in technology and warehousing and are in part due to AI adoption. Note that this measure is an estimate of gross job cuts. ADP private payrolls is, in contrast, a measure of net job creation. The latter survey reported a 42k job gain in October, leaving the 6-month average at a modest, but positive, 20k. Apart from Governor Miran, Fed speakers this week kept their options open for the December meeting, continuing to raise concerns over inflation risks as well as threats to the labour market.
Across the Atlantic, the Bank of England’s Monetary Policy Committee left the Bank Rate unchanged at 4.0%. The decision was a 5-4 split decision, and the communications carried a dovish tone. The minutes revealed that among the five members in the majority, four were concerned about the persistence of inflation. One member, Governor Bailey, judged that slack in the UK economy is rising; however, he preferred to “wait and see if the durability of disinflation is confirmed”. The forward guidance was explicit, stating that “Bank Rate is likely to continue on a gradual downward path” if the disinflationary process continues.
There were few changes to the BoE’s forecasts. CPI inflation is expected to fall below 3% around Q2 next year, then return to around 2% in Q2 2027 – a very similar path the August projection. GDP growth is expected to remain in the 1–1.5% range until early 2027, with some acceleration towards a 2% pace from late-2027. With Governor Bailey likely to favour a cut if current trends persist, we now anticipate a further 25bp policy easing at the MPC’s final meeting of the year in December and a 25bp rate cut per quarter through the first half of 2026.
Stocks Get Slammed Again After a Hopeful Rebound
Yesterday's session offered quite a positive rewind after what had been a rough start to the month.
The powerful uptrends are still technically dominant in the global stocks' impressive yearly explosion, but ever since their first appearance at the big surprise in the August NFP, it seems that sellers are trying to make a decisive appearance again.
The underlying technical background for equities has largely stayed positive: strong fundamental value underpinned by roughly 80% of reporting US firms showing growth, combined with a projected dovish path from the Fed while the economy stands solid, had fueled exactly what the bulls needed to close last month at new highs.
But the relentless march to consistent new record levels keeps raising the same critical question: Are stock valuations simply too high now?
Stock Markets are closing today's session at their lows and at key inflexion points for future action.
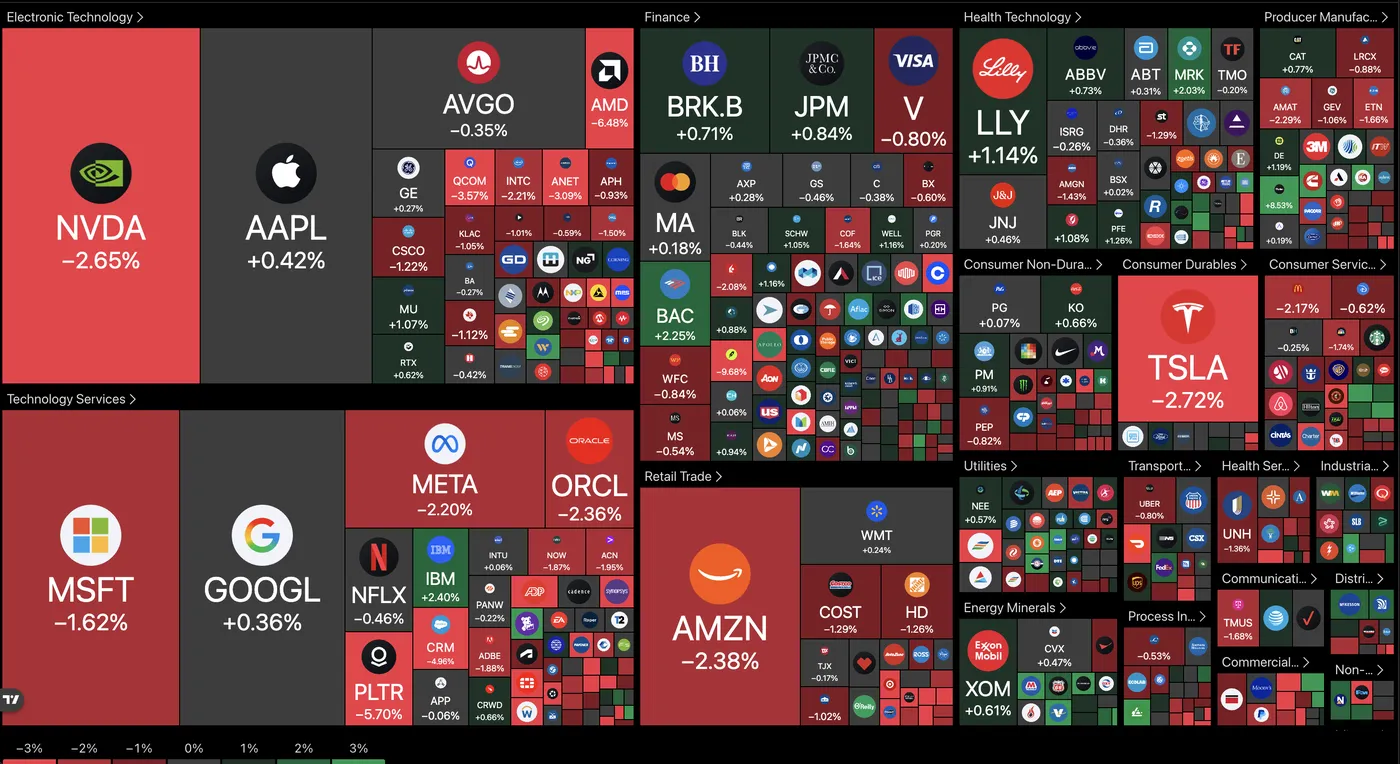
US Equity heatmap – November 6, 2025 – Source: TradingView
The Federal Reserve's most recent not-so-dovish return—delivered during what was still technically a rate cut—appears to have finally started to scare highly leveraged participants. In response, traders are now aggressively taking profit on this uncertainty.
Some analysts also warn of a rally lacking breadth (leaders bring the market up while the others lag), AI and financial leaders are issuing public warnings and there are even mentions of an Hindenburg Omen (although the accuracy of such signal has reduced as of late).
One thing is for sure: Volatility is going to stay elevated, and this is generally a good thing for traders! (Less for investors)
Let's have a closer look at intraday charts for all major stock indices: the Dow Jones, Nasdaq, and S&P 500, to gauge the immediate momentum.
Dow Jones 2H Chart and technical levels
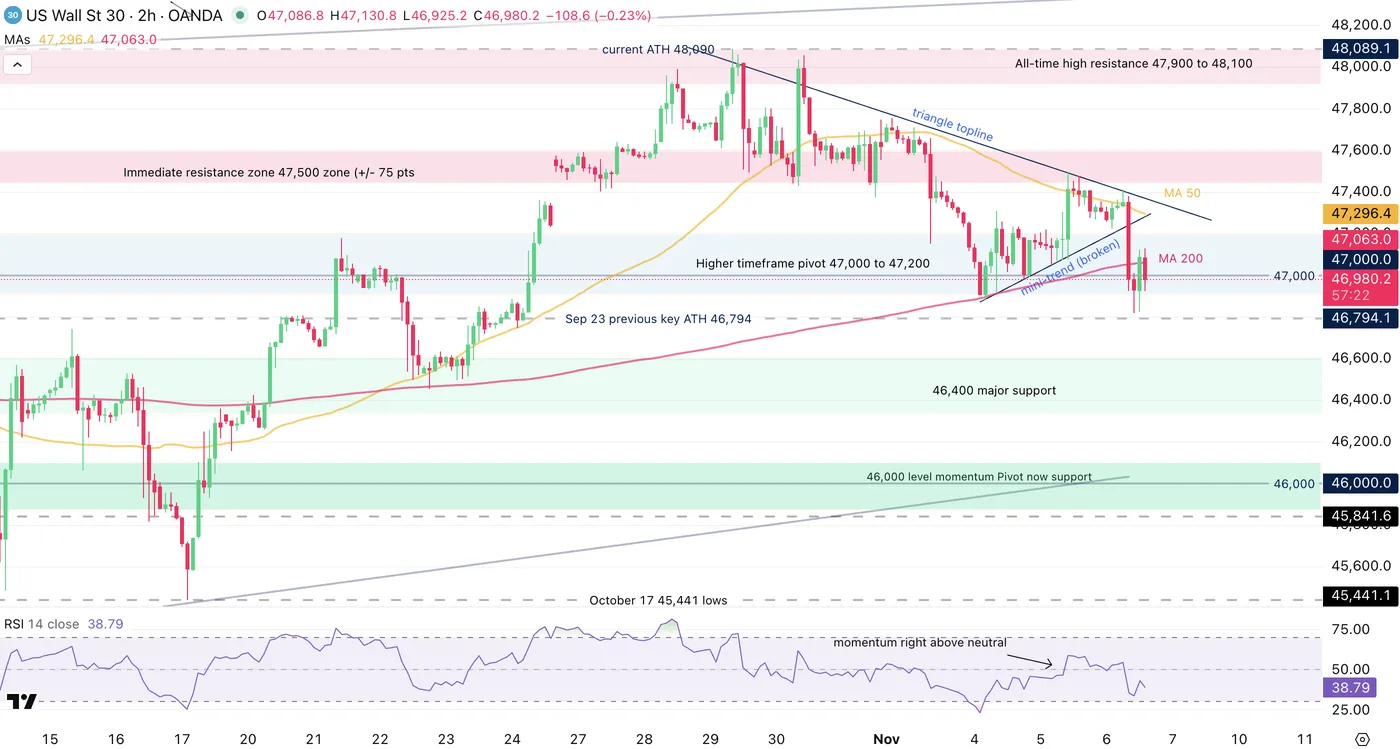
Dow Jones 2H Chart, November 6, 2025 – Source: TradingView
Our past-day analysis looked at the mini-trendline which needed to hold for bullish prospects.
But the Dow could not hold the wave of profit-taking which took the index to retest the September 23 previous record (46,794 on the CFD – 46,714 on the actual Index).
A close below this key level may bring further continuation, as the RSI momentum consistently grinds lower.
On the brighter side, staying above the 45,000 level – Key for a Market barometer – maintains the higher timeframe bullish picture.
Dow Jones technical levels of interest:
Resistance Levels
- Current All-time high 48,090
- 4H MA 50 and resistance at 47,500
- ATH Resistance Zone 47,900 to 48,100
- post-FOMC highs resistance zone around 46,400 (immediately testing)
Support Levels
- Short timeframe pivot 47,000 to 47,200
- 46,400 major support
- 46,000 higher timeframe Pivot now support
- 45,000 psychological level
- 44,400 to 44,500
Nasdaq 2H Chart and levels
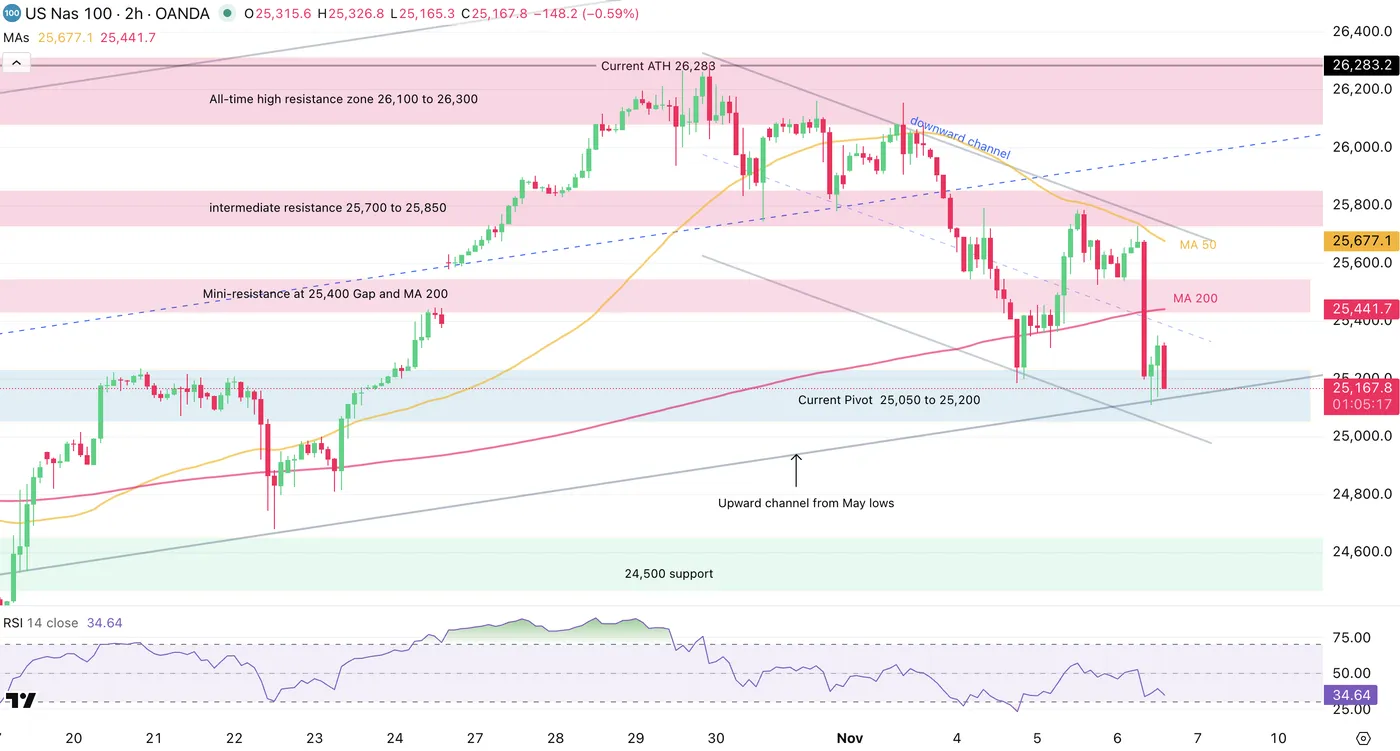
Nasdaq 2H Chart, November 6, 2025 – Source: TradingView
The current 4% correction from the 26,200 All-time Highs is evolving in a small downward channel which contains both buying and selling within.
Sellers are now reaching the lower bound of the May upward channel, a key high timeframe technical aspect to keep an eye on.
A rebound here (around 25,000) may be bringing some dip-buying opportunities, however, a break and close below could also bring more selling (as higher timeframes show overbought signs).
Nasdaq technical levels of interest:
Resistance Levels
- Current ATH 26,283 (CFD)
- All-time high resistance zone 26,100 to 26,300
- Intermediate resistance and 4H MA 50 25,700 to 25,850
- Mini-resistance at 25,400 Gap and MA 200
- Session highs 25,730 and MA 50
Support Levels
- Current Pivot 25,050 to 25,200 (Tuesday lows 25,186)
- 24,500 intermediate support
- October lows 23,997
- Early 2025 ATH at 22,000 to 22,229 Support
- Session Lows 25,110
S&P 500 2H Chart and level
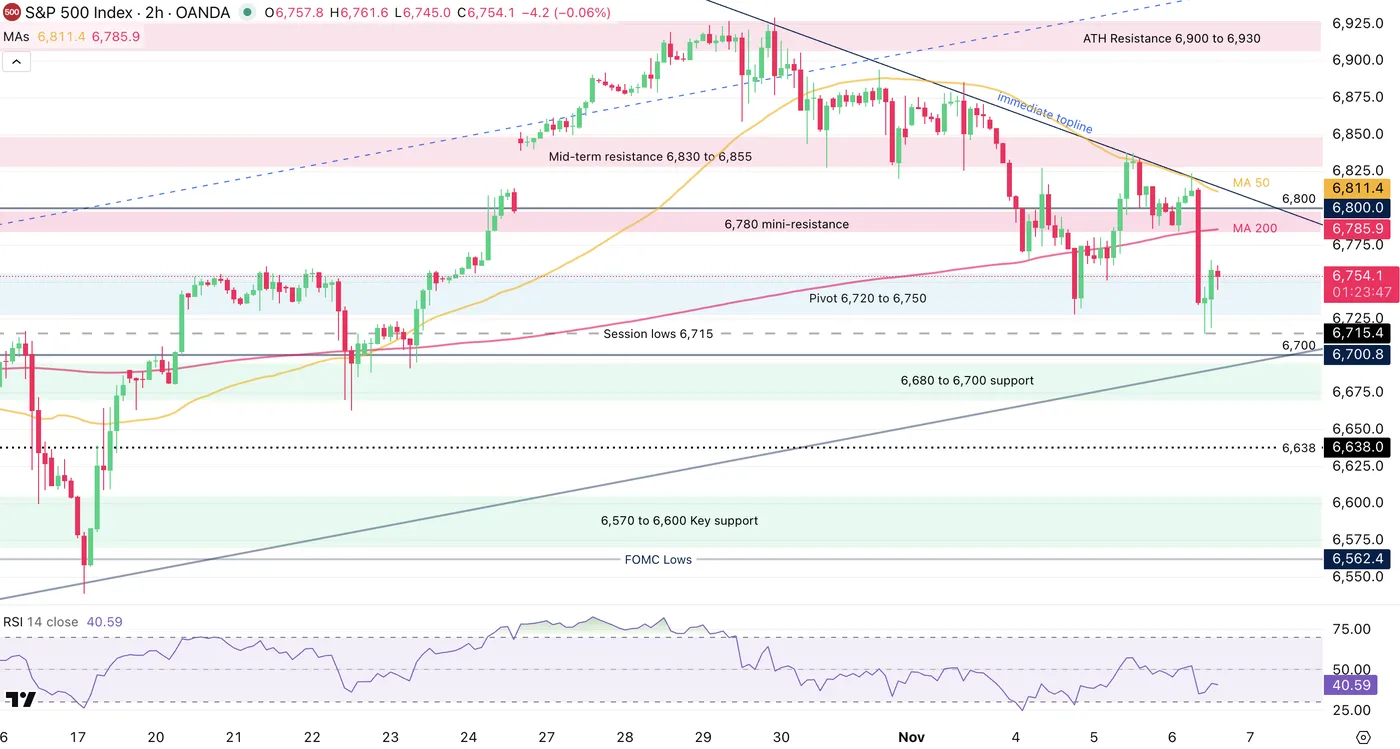
S&P 500 2H Chart, November 6, 2025 – Source: TradingView
Down close to 1% on the session as we speak, the index representing the 500 best US firms is not resisting to the pressure.
Yesterday's analysis indentified a topline that acted as fuel for profit-taking with the confluence of the 50-period Moving average (6,811).
Watch the psychological, round levels:
A weekly close above 6,800 should act as a positive levy for continuation.
Else, below 6,700, a larger pullback could be starting.
S&P 500 technical levels of interest:
Resistance Levels
- 6,930 (current All Time-Highs)
- ATH Resistance 6,900 to 6,930
- Intermediate resistance 6,830 to 6,855
- Daily highs 6,796
Support Levels
- 6,707 session lows
- Pivot and MA 200 6,720 to 6,750 (testing)
- 6,680 to 6,700 support
- 6,570 to 6,600 Key support
- 6,490 to 6,512 Previous ATH now Support (4H MA 200 Confluence)
PS: The Fear and Greed Index indicates Extreme fear, but with prices less than 5% from all-time highs, it doesn't look like things are quite there yet.
Safe Trades!
USD/JPY Hits Resistance: Bearish Signal Warns of a Potential Top
USD/JPY, arguably the most volatile FX currency pair, has certainly held its reputation this year with a constant flurry of uptrends and downtrends.
The first half of the year, demarcated by widespread dollar-selling, took the pair to lows not seen since September 2024 at 139.20.
However, a Liberation Day bottom in the dollar followed by a prolonged multi-month range led to a huge, decisive rebound in the pair.
Fundamentally, the still large yield differential—between the near-zero 0.50% in Japan and the persistently above 4% for the US 10-year yield—remained a fundamental boost underpinning demand for the US Dollar against the Yen.
This phenomenon significantly accelerated after Takaichi Sanae's appointment as Japan's Prime Minister.
As a notable fiscal dove following the ultra-loose policies of former PM Shinzo Abe to bolster Japanese economic growth, the Yen could not resist the renewed pressure.
After the election, USD/JPY jumped 1600 pips in a breakout gap and kept on going to the recent 154.50 highs, 4.70% above the October open.
Only recently, interesting technical developments may have marked a new intermediate top.
A bearish daily divergence is helping mean-reversion selling in the current risk-off session.
Explore its impact through our mulit-timeframe analysis of the FX pair.
USD/JPY multi-timeframe technical analysis
Daily Chart
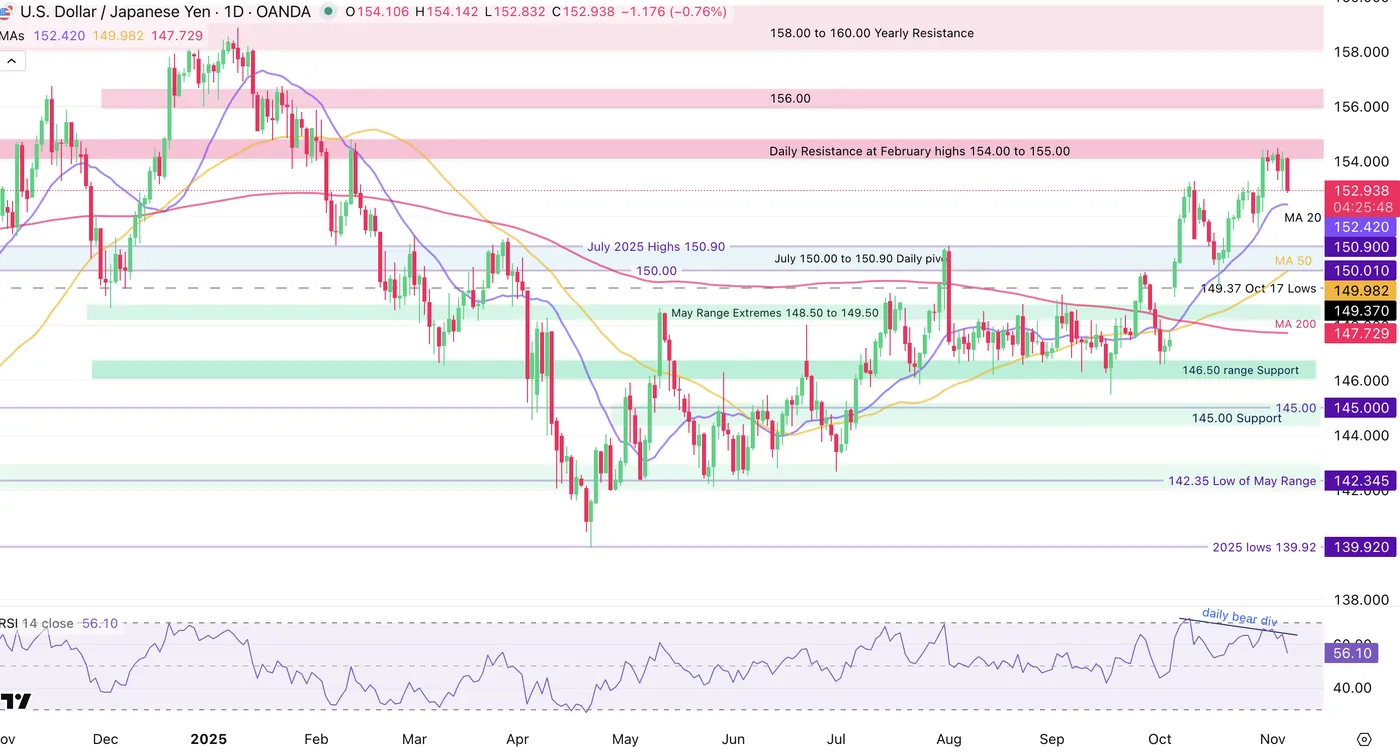
USD/JPY Daily Chart, November 6, 2025 – Source: TradingView
The pair broke out far above its slower moving-averages but held rebounded several times on its 20-Day Moving Average (currently at 152.420) key technical pattern to monitor for immediate trends.
The new month may have marked the end of the ongoing rally however with the pair's buying momentum regressing from overbought levels; the Daily RSI even shows a Daily divergence - a typical sign of trend exhaustions.
Bearish divergences happen when new highs in price are not followed by new highs in momentum (or buyer strength) and the inverse can happen for a bullish divergence.
Such breakouts may not immediately be followed with a reversal, but the recent risk-off markets (Equities and Cryptos selling) seen since the middle of last month may provide a boost to the Yen.
Let's take a closer look.
USD/JPY 4H Chart and technical levels
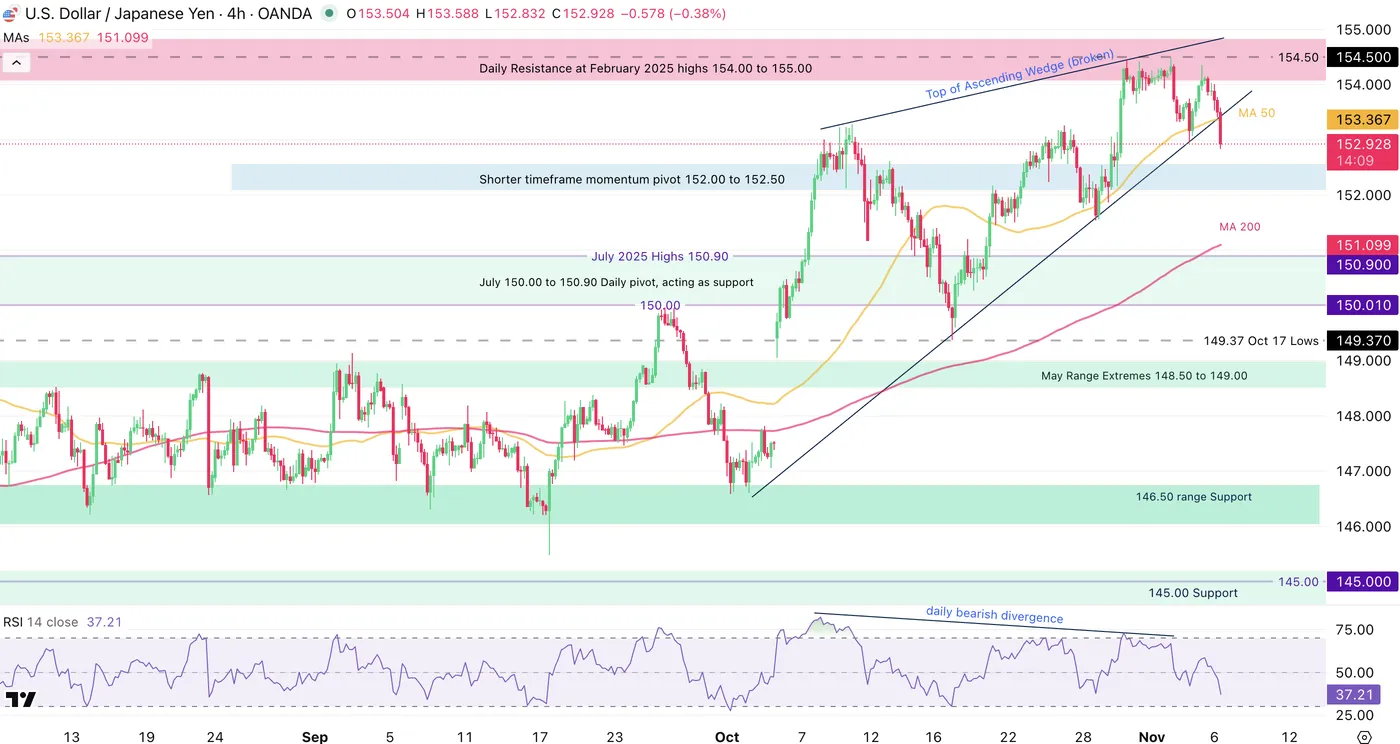
USD/JPY 4H Chart, November 6, 2025 – Source: TradingView
USD/JPY technical levels of interest:
Support Levels:
- Shorter timeframe momentum pivot 152.00 to 152.50
- 151.50 Oct 28 rebound (minor support)
- July 150.00 to 150.90 support
- May Range Extremes 148.50 to 149.00
Resistance Levels:
- Recent highs 154.50
- Daily Resistance at February 2025 highs 154.00 to 155.00
- 4H MA 50 at 153.40
- 156.00 upside resistance
USD/JPY 1H Chart
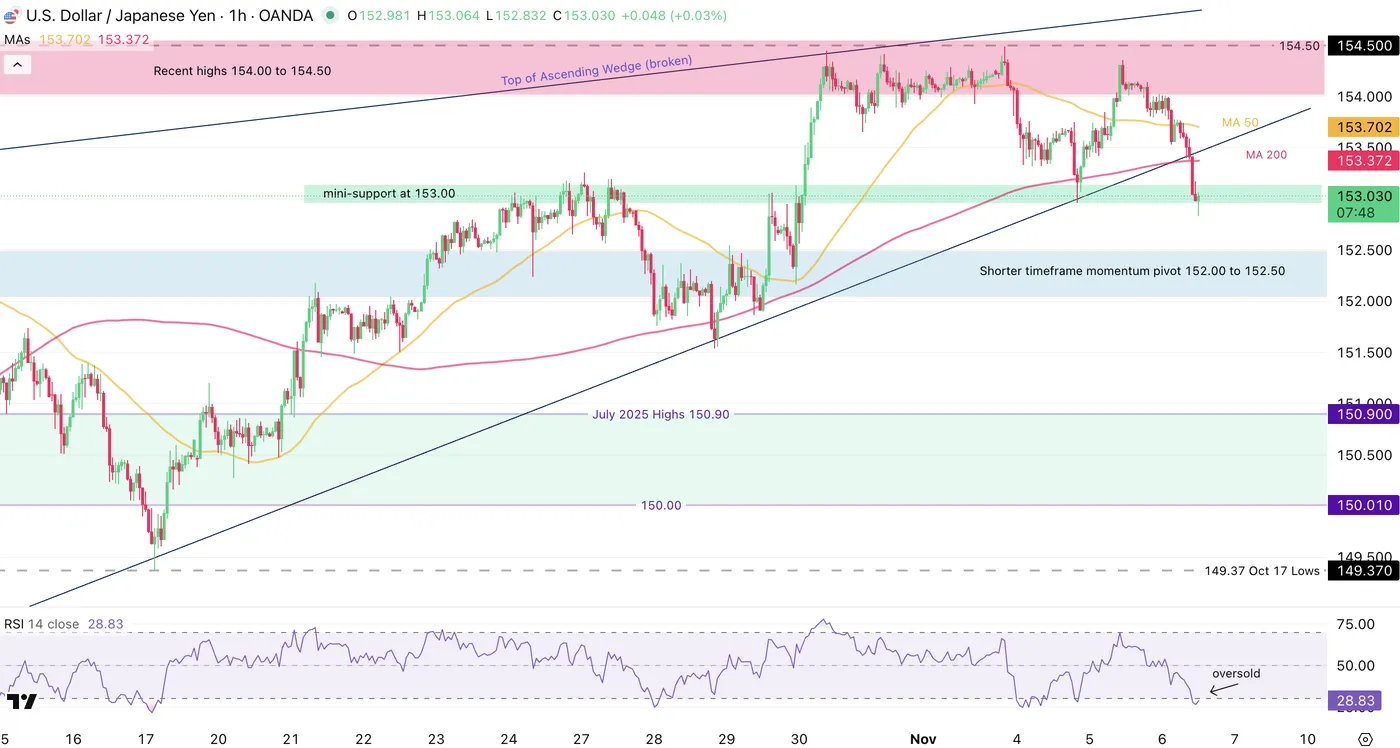
USD/JPY 1H Chart, November 6, 2025 – Source: TradingView
The current move has been one-sided for mean-reversion sellers taking the pair to a break of its ascending wedge.
An interesting test of the 153.00 handle, right around the current session lows, should offer a key mark to follow:
- A daily close below could prompt further selling
- A rebound from here may lead to a break-retest of the wedge.
- If buyers step again above 153.70 (look for a 4H candle close), a re-entry in the uptrend keeps high probability
Safe Trades!
Bitcoin Holds Above $100,000, But for How Long?
Cryptocurrencies have held their record prices and valuations in a gigantic 2025 rebound.
The outstanding run in digital money has been bolstered by much better regulation and significant dollar diversification, with sanctions further accelerating the need for different means of transacting.
Helping consistent stablecoin growth, de-globalization trends are playing their part for the general Crypto market growth.
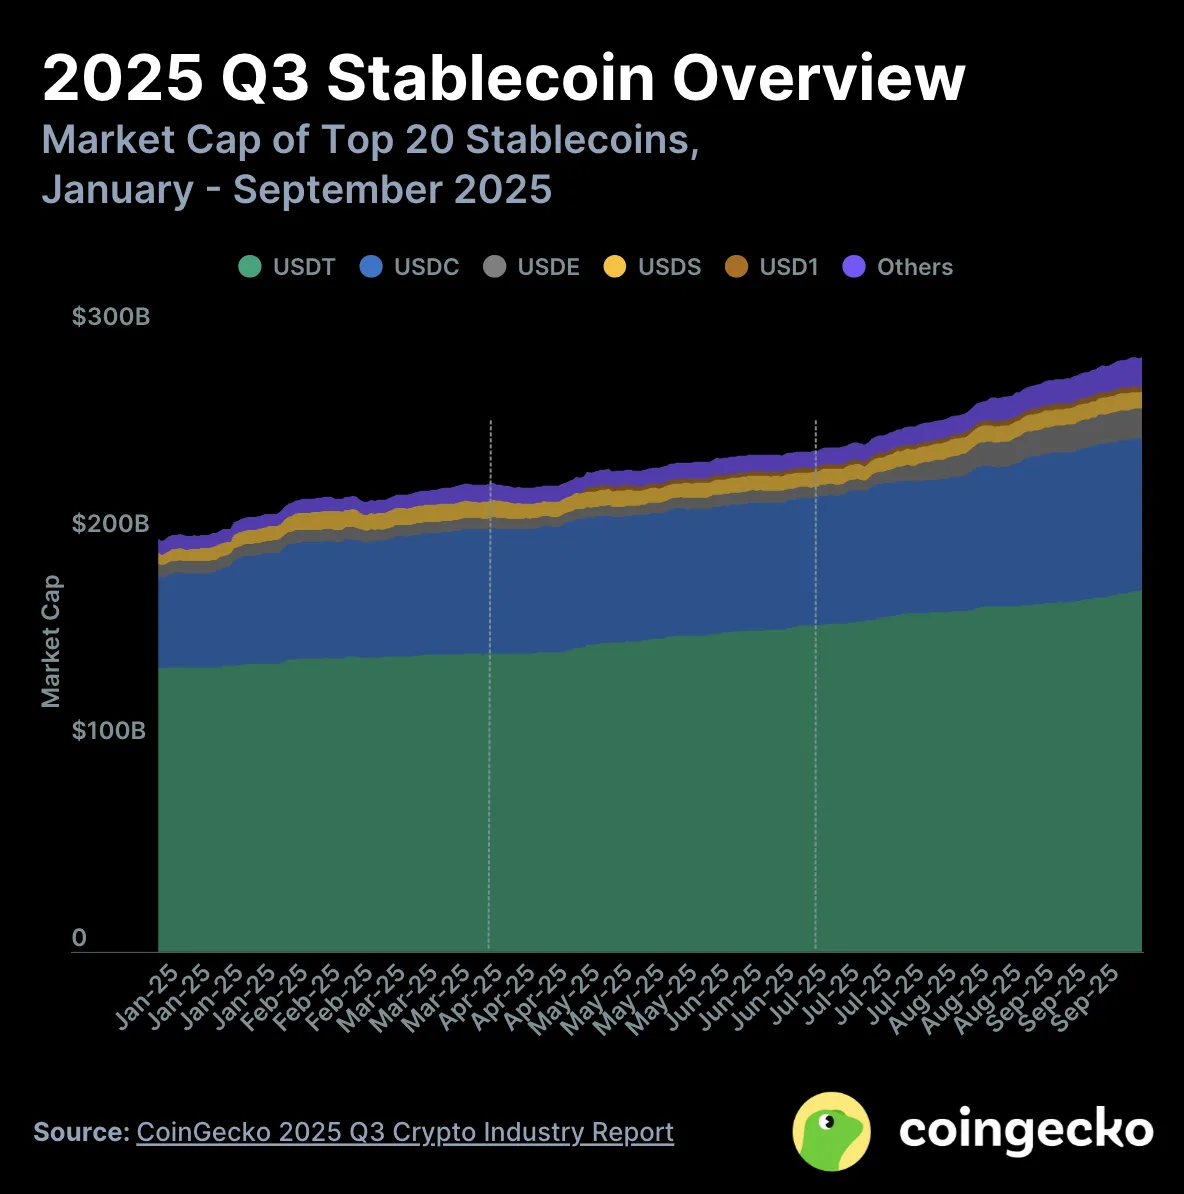
Stablecoin growth in 2025 from $200B to close to $300B – Source: Coingecko
This has become increasingly important as tariffs hurt US trade, international SWIFT usage faces scrutiny, and sanctions are bypassed by major players like Russia and China, particularly in Asia.
Nonetheless, despite resilient Bitcoin prices, the world's largest crypto has started to show some warning signs that it's jaw-dropping rise isn't as invincible.
A dip right below the $100,000 psychological mark just last week follows a mid-October flash crash that had erased above $600B of valuation in one day (before a fast recovery).
Unfortunately for digital currency aficionados, only 15 days have seen upticks in cryptos in the past month with sellers now in short-term control.
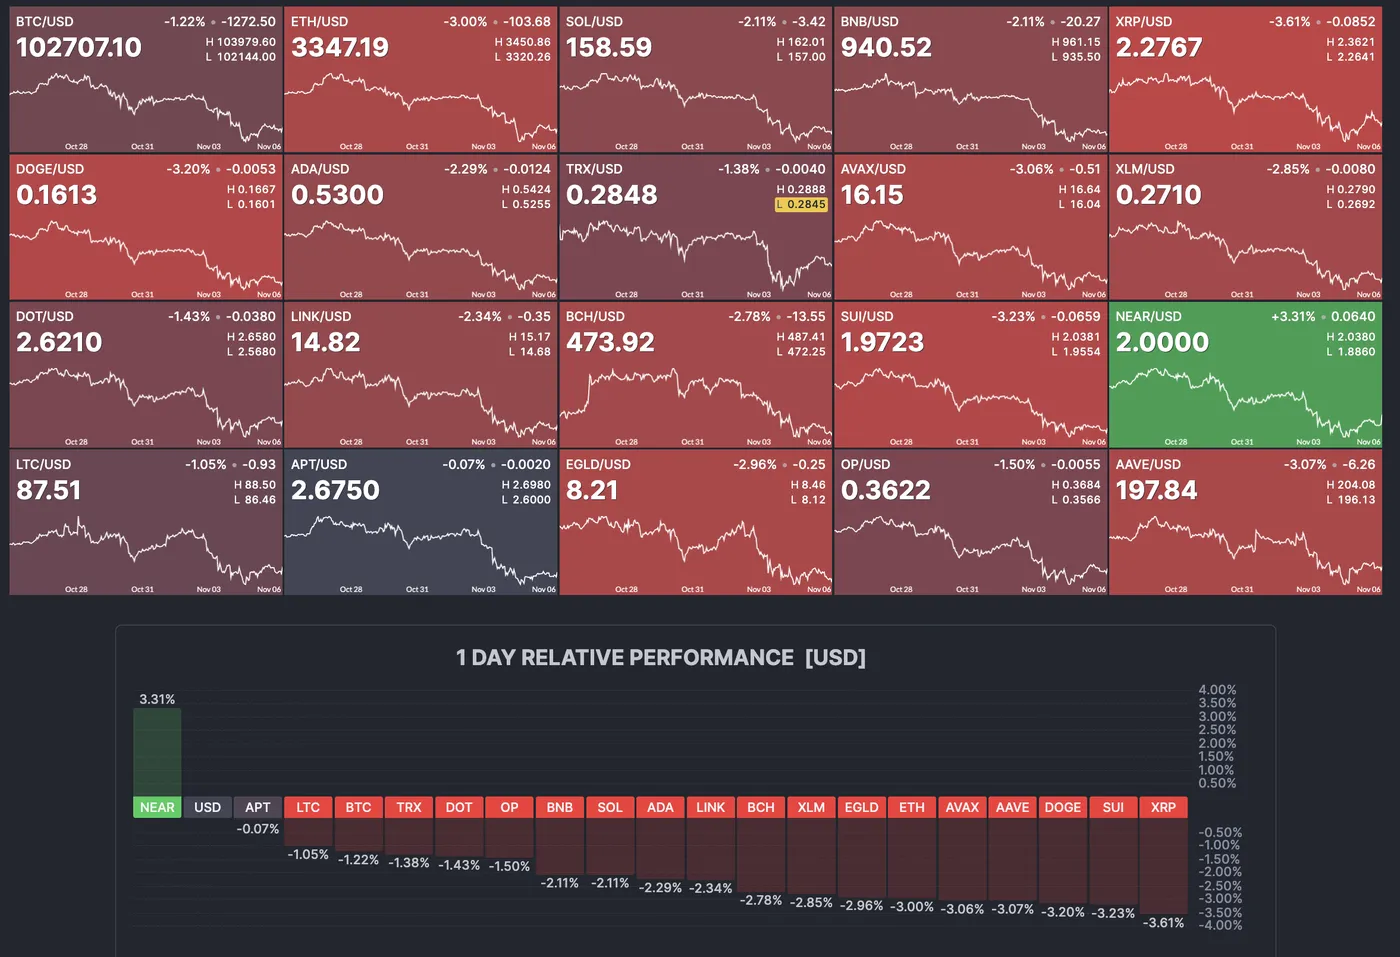
Daily overview of the Crypto Market, November 6, 2025 – Source: Finviz
Now moving in mildly corrective sequences, major altcoins like Solana and ETH have stopped their fulgurant ascent and are beginning to retest lower levels.
The latest Trump-Xi meeting has also put back international relations back on the table, which have hurt gold, also performing strongly in 2025.
This has led to widespread profit-taking, which is clearly visible in the Crypto total market cap, which has fallen by 20% from its record highs and now holds below its December 2024 previous record.
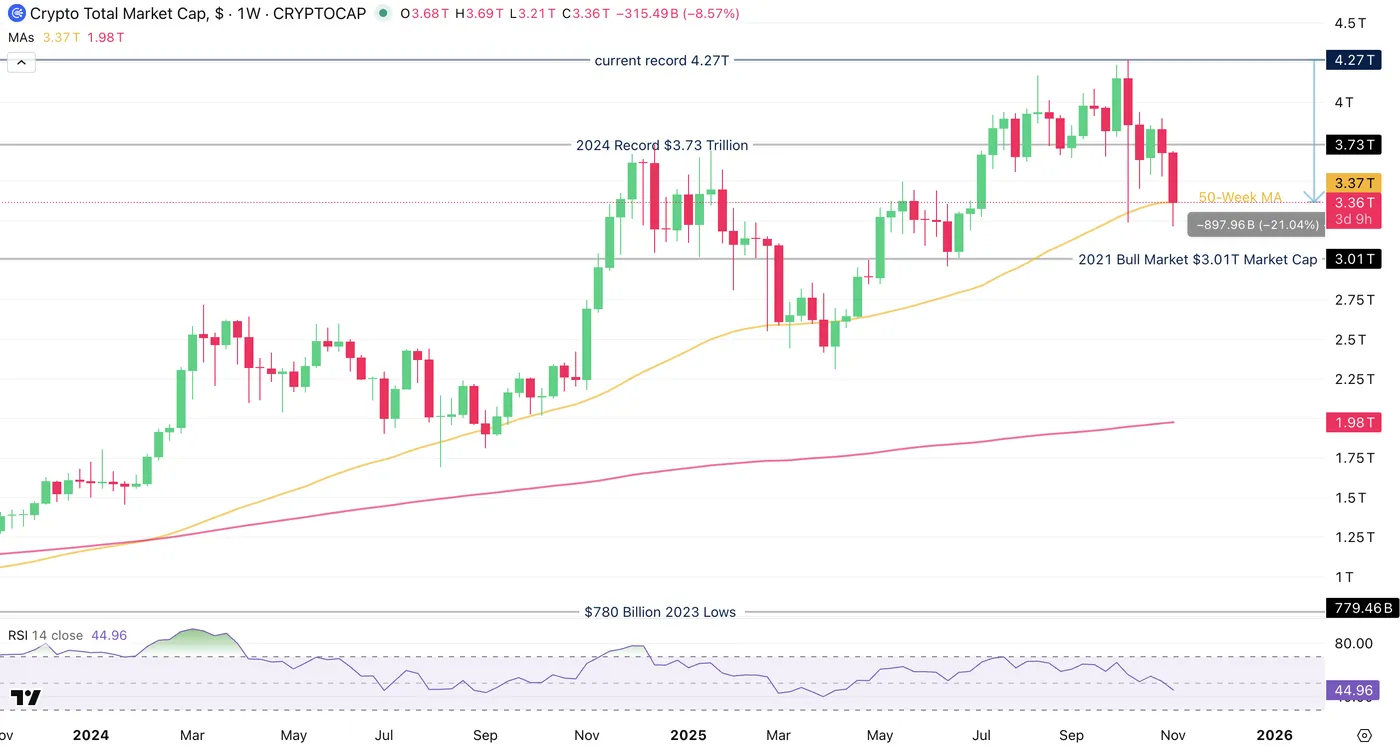
Total Crypto Market Cap, November 6, 2025 – Source: TradingView
The other side of the coin can offer the view that the sudden rise in cryptos haven't many retracements if any.
Retracements are typically good for consolidating value in any markets – But avoiding a bear market remains essential for future growth prospects.
Dip-buying Opportunity or trap? Let's find out through a multi-timeframe analysis of the top 1 crypto.
Bitcoin multi-timeframe technical analysis
Daily Chart
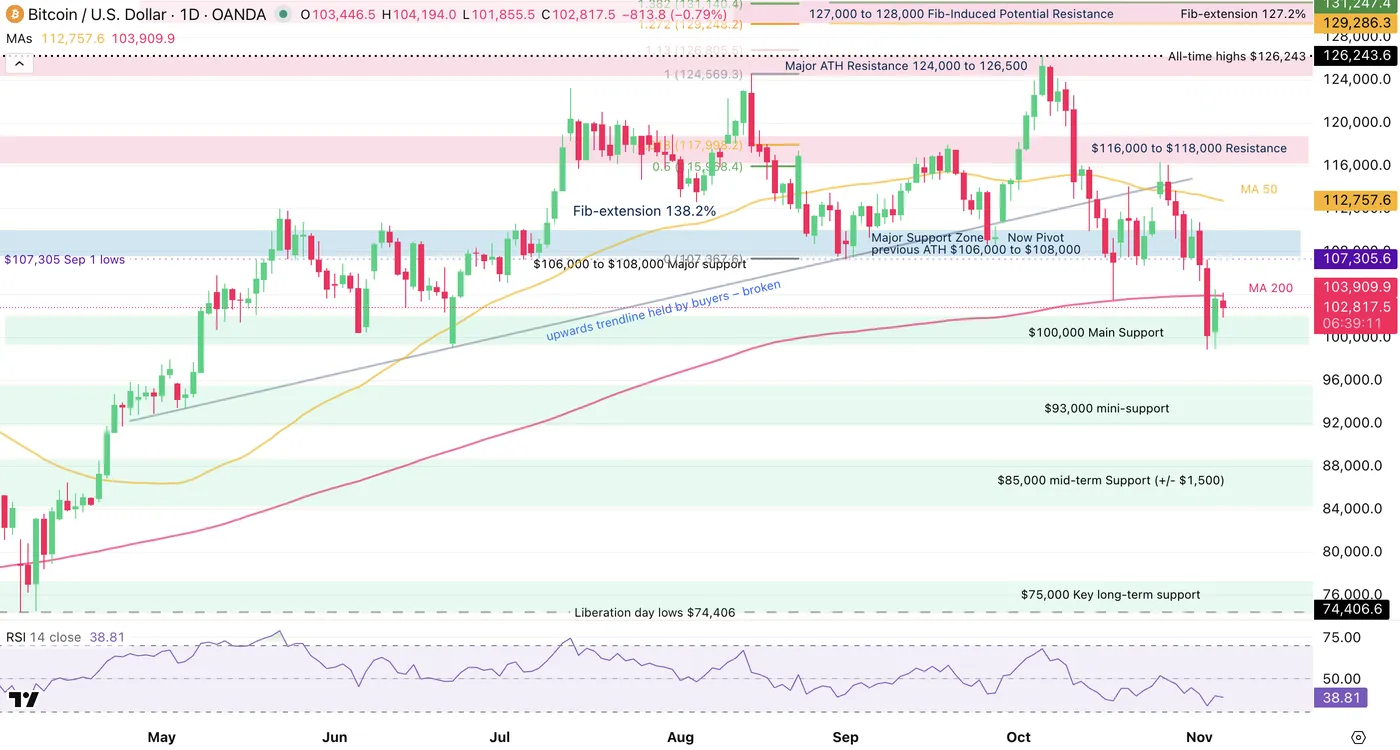
Bitcoin Daily Chart, November 6, 2025 – Source: TradingView
Bitcoin has failed to hold its $106,000 to $108,000 consolidation at its precedingly major support.
The first crack of support happened through the week following the flash crash, but the consequent rebound formed a bull trap.
Shortly after, a retest of the $116,000 level brought sellers to complete a lower high sequence.
The $100,000 still offers a tenace look for the crypto market and stays a barometer for sentiment.
Daily closes above and below will be interesting to watch.
While prices are resiliently holding around the 200-Day MA ($102,700), let's take a closer look.
4H Chart and technical levels
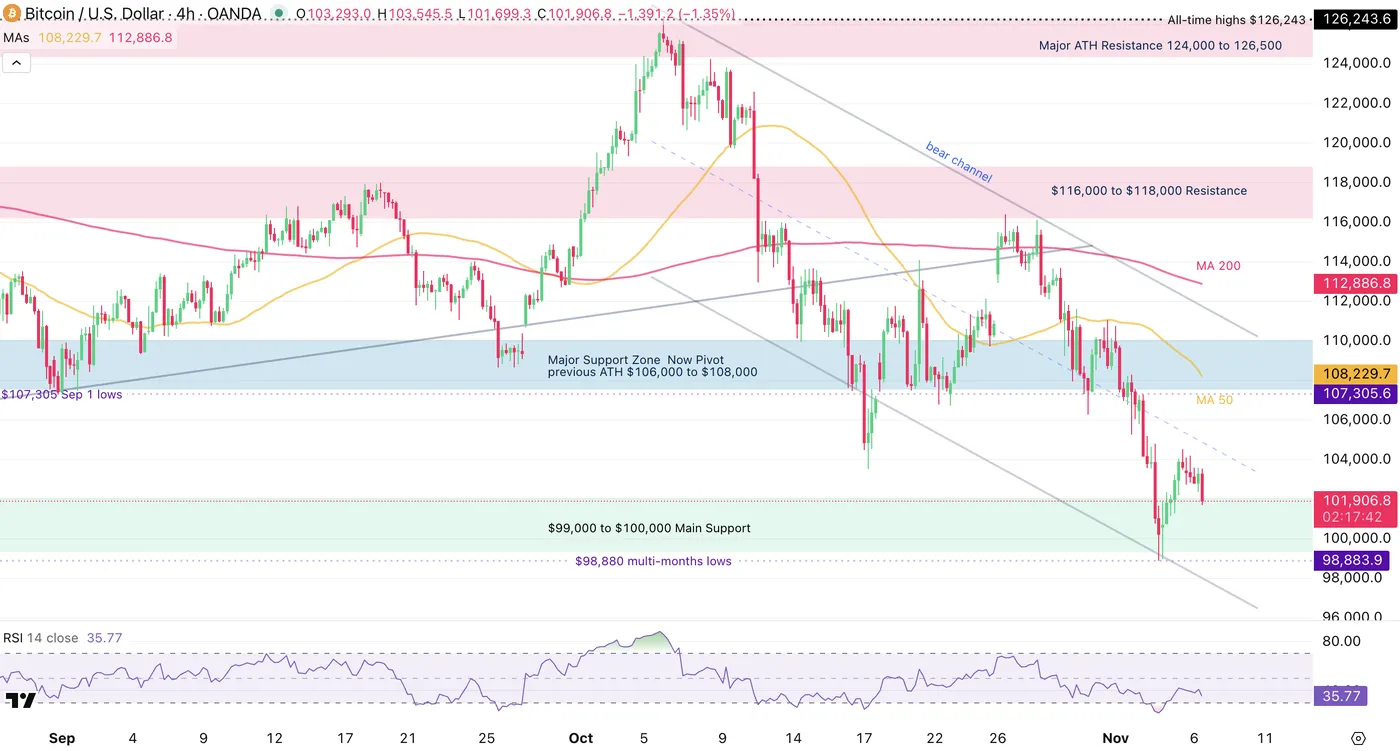
Bitcoin 4H Chart, November 6, 2025 – Source: TradingView
Buyers are stepping in to hold right above the $100,000 Main Support Zone.
Now evolving in a descending channel, reactions to its lows will be key:
- A break below the channel should trigger seller acceleration to the $93,000 Support
- On the other hand, staying above $100,000 (watch for the weekly close) favors a rebound
- owards the Pivot zone (in confluence with the 50-period MA - $107,300)
Levels of interest for BTC trading:
Support Levels:
- $99,000 to $100,000 Main Support
- $93,000 mini-support
- $85,000 mid-term Support (+/- $1,500)
- $75,000 Key long-term support
Resistance Levels:
- Current ATH Resistance $124,000 to $126,000
- Current all-time high $126,250
- $116,000 to $118,000 Resistance
- Major Support Zone–Now Pivot previous ATH $106,000 to $108,000 (and 4H MA 50)
Safe Trades!
GBPUSD – Limited Gains after BOE Kept Rates Unchanged
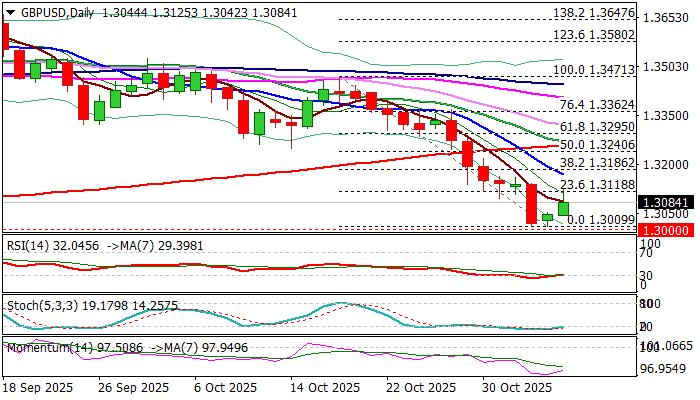
Cable jumped above 1.31 mark after BOE left rates unchanged as widely expected, but trimmed gains on signals that the central bank could cut in December policy meeting, which comes after government’s budget (Nov 26) and releases of inflation reports for October and November, that would provide more information to policymakers.
Bounce from multi-month lows (1.3009 double-bottom, after broader bears faced strong headwinds on approach to psychological 1.30 support), extended into second straight day, but reached so far only the first barrier at 1.3118 (Fibo 23.6% of 1.3471/1.3009), leaving more significant barriers at 1.3170/86, out of reach.
This raise worries about limited recovery, before bears regain control again for fresh attack at 1.30 pivot.
Technical picture on daily chart remains bearish, with recent formation of 10/200DMA death cross and converging 20/200DMA’s on track to form another one, adding to negative outlook, as 14-d momentum (although turning up) is still deeply in negative territory, although RSI emerging from oversold zone, partially offsetting negative signal.
Extended upticks should be capped under 1.3186 Fibo barrier, to mark a healthy correction before larger downtrend resumes.
Alternatively, stronger acceleration higher and violation of 1.3240/60 (50% retracement / 200DMA) would sideline bears and open way for potential stronger recovery.
Res: 1.3143; 1.3186;1.3218; 1.3240
Sup: 1.3042; 1.3000; 1.2948; 1.2810