Sample Category Title
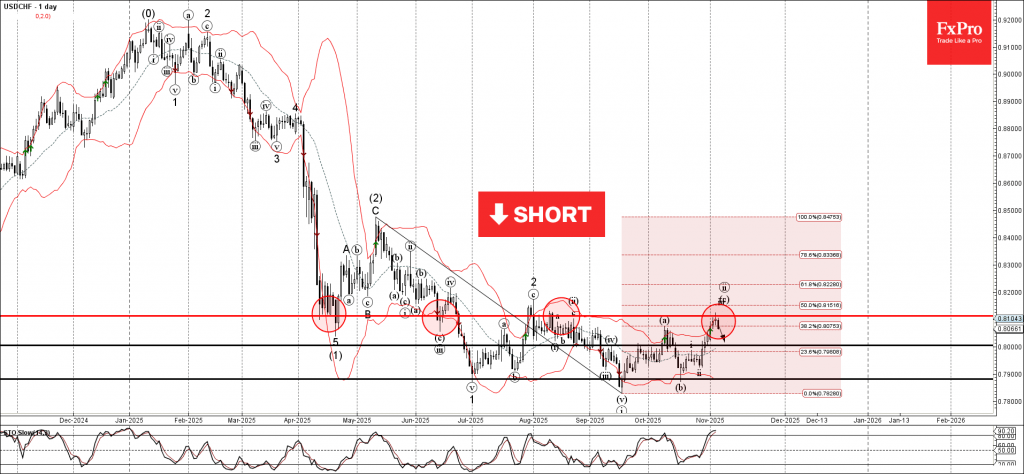
USDCHF Wave Analysis
USDCHF: ⬇️ Sell
- USDCHF reversed from resistance area
- Likely to fall to support level 0.8000
USDCHF currency pair recently reversed from the resistance area between the resistance level 0.810 (former strong support from April and June, which has been reversing the price from August) and the upper daily Bollinger Band.
This resistance area was further strengthened by the 50% Fibonacci correction of the downward impulse from May.
Given the clear daily downtrend, USDCHF currency pair can be expected to fall to the next round support level 0.8000.
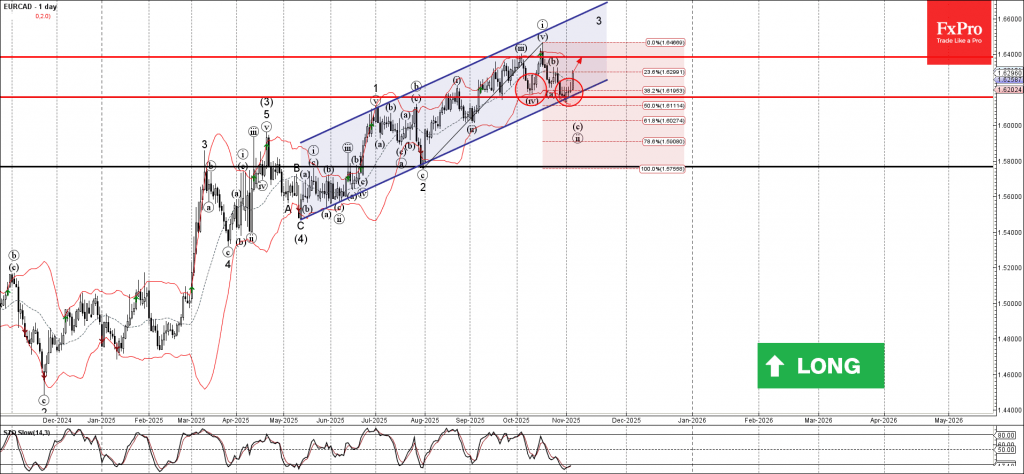
EURCAD Wave Analysis
EURCAD: ⬆️ Buy
- EURCAD reversed from support area
- Likely to rise to resistance level 1.6385
EURCAD currency pair recently reversed from the support area between the key support level 1.6160 ( which has been reversing the price from the middle of September), lower daily Bollinger Band and the support trendline of the daily up channel from May.
The upward reversal from the support area stopped the impulse c-wave of the earlier ABC correction (ii) from the middle of October.
Given the clear daily uptrend the oversold daily Stochastic indicator, EURCAD cryptocurrency can be expected to rise to the next resistance level 1.6385 (which stopped earlier waves iii and v).
Bank of England Review – Dovish Hold
- The Bank of England kept the Bank Rate at 4.00%.
- The vote split was 5-4 in favour of hold, more dovish than expected.
- The potential of further easing hinges a lot on the continuance of the recent promising disinflation.
- The market reacted by trading Gilt yields a bit lower and EUR/GBP higher, although the latter move faded a bit.
The Bank of England (BoE) kept the Bank rate at 4.00% against our expectation but in line with market pricing. The vote split was 5-4 (keep vs. cut), which was more dovish than expected, though. Deputy governors Ramsden and Breeden joined Taylor and Dhingra in the camp voting for cut while Governor Bailey casted his deciding vote for keep with the view: "Rather than cutting Bank Rate now, I would prefer to wait and see if the durability in disinflation is confirmed in upcoming economic developments this year".
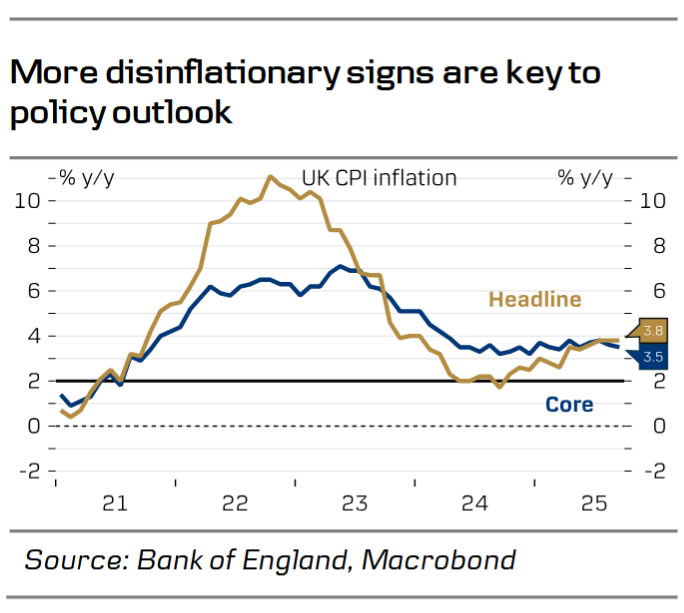
Thus, Bailey looks just one encouraging inflation print away from voting for another cut. Listening in on the press conference, second round effects on inflation were mentioned several times, though, and we do not think Bailey sounds like someone ready to cut at two meetings back-to-back as monetary restrictiveness is reduced further. New projections from the BoE have unemployment slightly higher at 5.0% in 2025/2026 and inflation slightly lower, which does open for more easing. The wording of the BoE's guidance to investors was shortened significantly but the message is unchanged. "The extent of further reductions will therefore depend on the evolution of the outlook for inflation".
BoE call. We now expect the BoE to deliver the next cut in the Bank Rate in December, where we also think fresh government spending cuts will call for further easing. We think a majority in the MPC will be ready to cut unless inflation spikes again. We kick the final rate cut further down the road. As monetary restrictiveness falls, we think the bar will increase for the following rate cut. Thus, we expect the April meeting to conclude the easing cycle with the Bank Rate at 3.50%. The Autumn Statement is a big joker in the BoE outlook, though, see also Research UK - Autumn Statement will be key for UK markets.
Market reaction. Gilt yields traded a couple of basis points lower and EUR/GBP higher on the announcement, with the market putting emphasis on the close vote split indicating more easing likely around the corner. We expect EUR/GBP to trend higher the coming year, targeting the cross at 0.89 in 6-12 months.
Sunset Market Commentary
Markets
The Bank of England kept the policy rate unchanged at 4% but hinted at a move soon, as soon as December and no later than February 2026. Risks to inflation have become more balanced, the statement now reads, and “The Bank rate is likely to continue on a gradual downward path” if disinflation progress continues. That’s less strict than the “gradual and careful” approach of September. In the split 5-4 outcome, governor Bailey was the swing vote. Four members in the group of five placed greater weight on the risk of inflation persistence, particularly through wages. Bailey as the fifth and decisive member was less hawkish. In the first-ever published rationale underpinning their views, Bailey said he finds the mechanisms underlying upside risks less convincing than those underlying the downside but saw value in waiting for more evidence of disinflation to pick up. The members voting for a cut noted the economic slack and a materially deteriorating labour market. The policy statement notes that CPI is expected to have peaked in September (3.8%). The base effects, one-off factors and increases in administered prices that caused the CPI increase through 2025 so far should fade out. Using a similar market-implied Bank Rate to the one used in the August projections – 3.5% by 2026Q3 and of which Bailey said is a fair description of his position – inflation is anticipated to decline to 2.5% by 2026Q4 and to the 2% target from 2027Q2 on. Economic growth was revised up slightly higher for 2026 (1.4%) and 2027 (1.7%) but remains below potential. The unemployment rate is expected to pick up to 5.1% by mid-2026, up from 4.8% currently.
Sterling and UK yields fell after the decision, with some caught off guard by the growing possibility of a December cut. GBP tried to recover but a fragile risk environment stands in the way. EUR/GBP remains north of 0.88. Gilt yields ease 3.5 bps at the front with a December cut now given a two-in-three chance. We think that’s an underestimation given that the government’s November 26 budget is probably going to be a belt-tightening one, further suppressing an already weak economy. Moves in other markets show UST outperformance vs Bunds. Second-tier and rarely-looked-at data from a private outplacement firm showed the most announced job cuts for any October of the last >20 years. It triggered yield declines of up to 6.5 bps at the front, showing just how much markets are eager for some input that polls the US’ economic health. German rates are down 2 bps. Yield differentials favour EUR/USD with the pair nudging higher to 1.152 but the risk environment is capping gains here as well. DXY’s failed adventure north of the 100 barrier is followed by some minor declines to 99.77 currently. Stocks lose modest ground.
News & Views
The Norwegian central bank kept its policy rate unchanged at 4% today. The Committee's assessment is that no new information has come in that indicates a material change to the outlook for the Norwegian economy since the monetary policy meeting in September. If the economy evolves broadly as currently envisaged, the policy rate will be reduced further in the course of the coming year. Governor Wolden Bache added that the Norges Bank isn’t in a hurry to reduce the policy rate though as the job of tackling inflation has not been fully completed. Inflation is still above target, and underlying inflation has been close to 3% for some time. "The outlook suggests that inflation will return to target without a large increase in unemployment," Wolden Bache said, adding that excessively tight monetary policy could restrain economic activity. The September outlook envisioned one rate cut per year in the coming three years. EUR/NOK is going nowhere today at 11.73. Norwegian money markets attach a 45% probability that the next policy rate cut comes by the end of Q1 2026.
The Czech National Bank left its policy rate stable at 3.5% and expects broad stability in the next quarters in light of overall inflationary risks. These stretch from a possible acceleration of money supply growth in the economy due to household loans and growth in total public sector spending over continued rapid wage growth in combination with ongoing tension in the labour market to rising food prices and the persistent inflation in services. A relatively tight policy is still needed even if the CNB slightly lowered CPI forecasts for this year and next, respectively from 2.6% to 2.5% and from 2.3% to 2.2%. The central bank also lowered this year’s growth outlook from 2.6% to 2.3%. The Czech koruna in unnerved by the expected outcome, changing hands at EUR/CZK 24.34.
Fed’s Goolsbee: Lack of inflation data raises caution on rate cuts
Chicago Fed President Austan Goolsbee expressed concern that the ongoing data blackout caused by the government shutdown could hinder the Fed’s ability to judge inflation accurately. Speaking on CNBC, he said the lack of near-term readings makes him “more uneasy” about continuing with interest-rate cuts.
“If there are problems developing on the inflation side, it’s going to be a fair amount of time before we see that," he warned.
Even so, Goolsbee clarified that he remains broadly dovish in the medium term, saying he is “not hawkish on interest rates” and expects the long-run neutral rate to be “a fair bit below” current policy levels.
On the economy, Goolsbee said the labor market continues to show “mild cooling”, describing conditions as consistent with a gradual slowdown rather than a sharp correction.
BoE Hold Rates Steady in Close 5-4 Vote Split, GBP/USD Continues Rally
The Bank of England's committee decided to keep their main interest rate (Bank Rate) at 4%, which is what most people expected. However, the vote was close (5 members for keeping it, 4 members wanted to cut it by a small amount), showing that more people on the committee are leaning towards lowering rates.
For all market-moving economic releases and events, see the MarketPulse Economic Calendar. (click to enlarge)
They believe that the worst of inflation is over and prices are starting to slow down. This slowdown is due to their current high rates, slower wage increases, and weaker price growth in services. They also noted that a slow economy and a less tight job market are helping to push inflation down.
The committee now thinks the risks of missing their 2% inflation target are more balanced; they are less worried about high inflation sticking around and more worried about the economy being too weak. Still, they emphasized they need to see more proof that this trend will continue.
Future rate cuts will happen gradually and will depend entirely on the new economic data that comes in.
UK Inflation is Looking Better
Optimism that the Bank of England (BoE) might cut interest rates this year is rising, causing UK 10-year bond yields to drop significantly since mid-October. Just a month ago, the market doubted the BoE would cut rates again soon. Now, the view is changing because inflation, currently at 3.8%, appears to have peaked.
Even though the full drop won't happen until next year, encouraging signs are appearing: food price inflation is easing more quickly than expected, and service sector inflation is slowing down. This is being helped by private sector wage growth also falling, which is on track to end the year below 4% after starting much higher.
This confidence is also boosted by expectations that the upcoming Autumn Budget will be viewed positively by the financial markets.
UK Chancellor Rachel Reeves welcomed today's BoE cut to inflation forecast.
According to the BoE “Progress on disinflation indicates bank rate likely to continue a gradual downward path: "gradual and careful approach" to further withdrawal of monetary policy restraint”.
On the subject of inflation, Governor Bailey stated “It is encouraging that the inflation peak in September was 0.2 percentage points below our August forecast”. All in all signs appear positive on the Inflation front.
There is another inflation print due out on November 19, which could have a major impact on pricing of a BoE rate cut in December, before attention turns to Chancellor Rachel Reeves’ budget.
UK Autumn Budget Now in Focus
The UK budget will become the main area of focus as the month progresses. Fiscal sustainability remains key and will likely determine the impact the budget speech has on the GBP.
If Chancellor Reeves adopts more fiscal tightening the implications could lead to further weakness for the GBP. A budget which delivers tax hikes but pushes up 2026 inflation could potentially boost the GBP while a budget that under-delivers on fiscal sustainability could prompt a severe sell-off in the GBP.
Chancellor Reeves really has an unenviable task ahead of her with markets paying close attention.
Market Reaction to the BoE Hold
Markets saw the GBP weaken in the aftermath of today's rate decision with a 30-40 pip selloff in GBP/USD.
However, cable has since reversed this and pushed higher to trade around the 1.3100 handle at the time of writing.
A break above the 1.3100 handle and four-hour candle close could embolden bulls and push GBPUSD toward the 1.3250 handle and the 100-day MA which rests around the 1.3270.
If cable fails to find acceptance above 1.3100 handle, a retest of the crucial 1.3000 level may be in the offing.
GBP/USD Four-Hour Chart, November 6, 2025
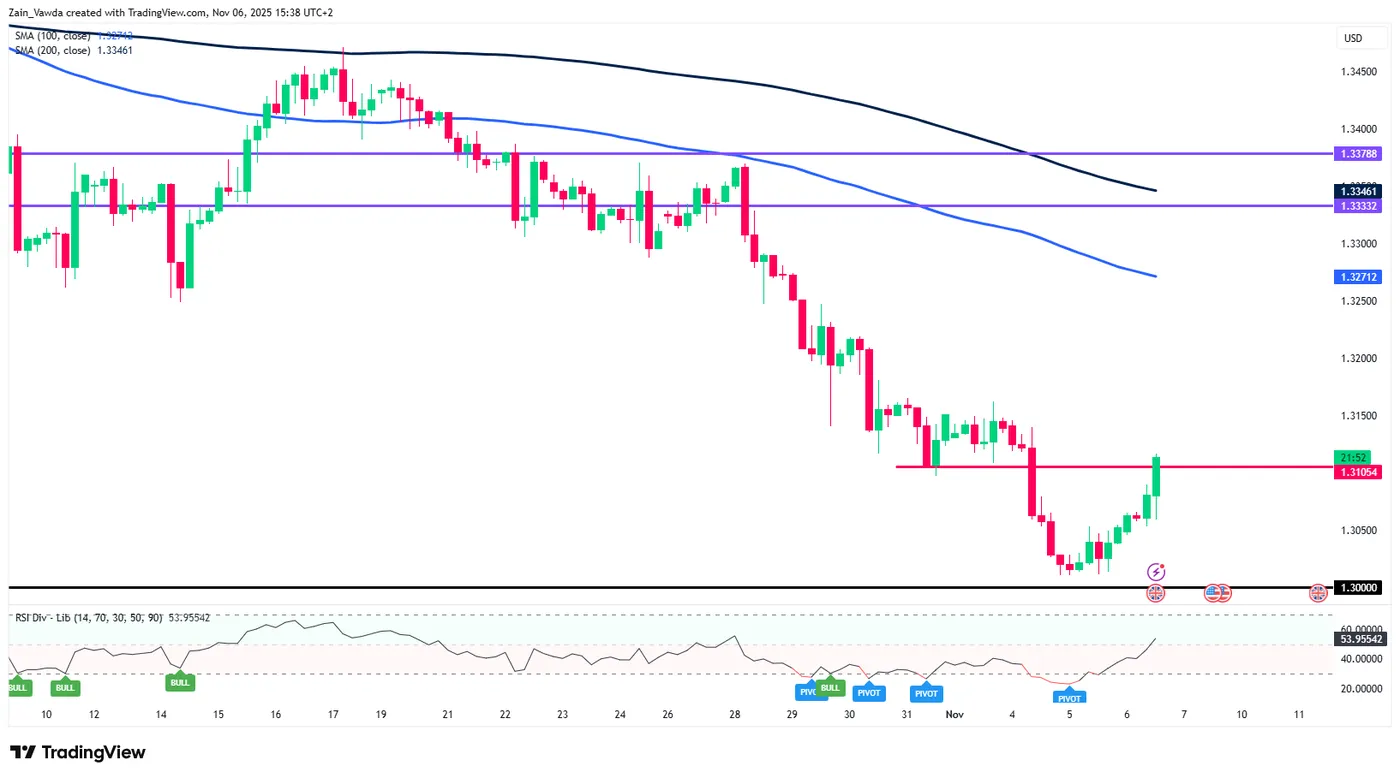
Source: TradingView.com
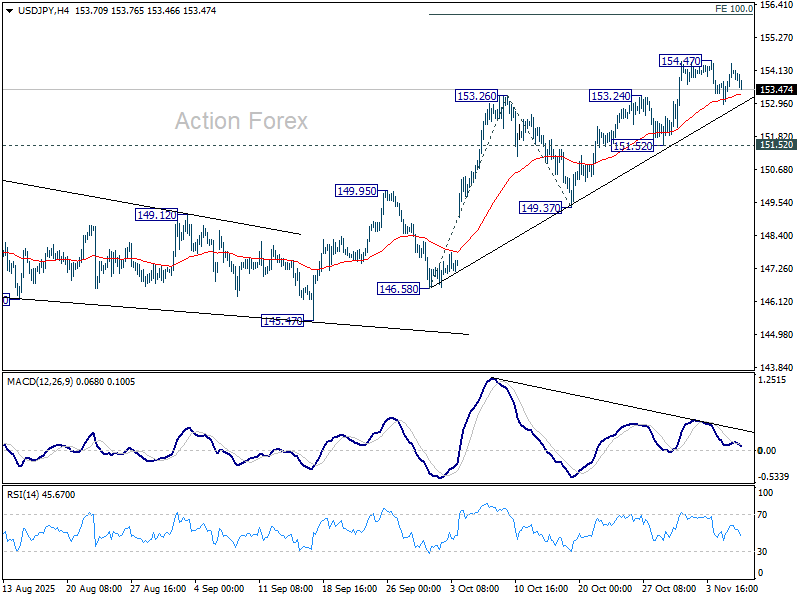
USD/JPY Mid-Day Outlook
Daily Pivots: (S1) 153.27; (P) 153.81; (R1) 154.67; More...
Intraday bias in USD/JPY remains neutral as consolidations continues below 154.47. Further rally is expected as long as 151.52 support holds. Above 154.47 will resume larger rise from 139.87 to 100% projection of 146.58 to 153.26 from 149.37 at 156.05. Break there will pave the way to 158.85 key structural resistance.
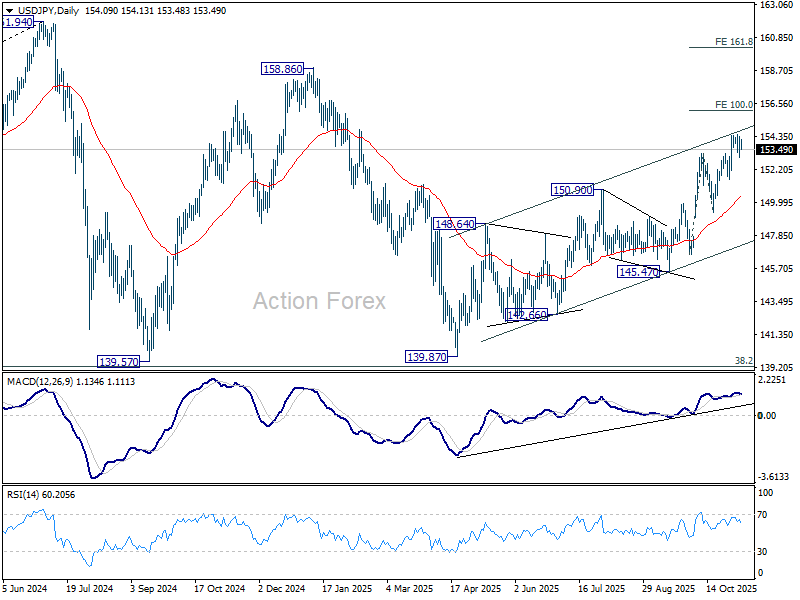
In the bigger picture, current development suggests that corrective pattern from 161.94 (2024 high) has completed with three waves at 139.87. Larger up trend from 102.58 (2021 low) could be ready to resume through 161.94 high. On the downside, break of 145.47 support will dampen this bullish view and extend the corrective pattern with another falling leg.
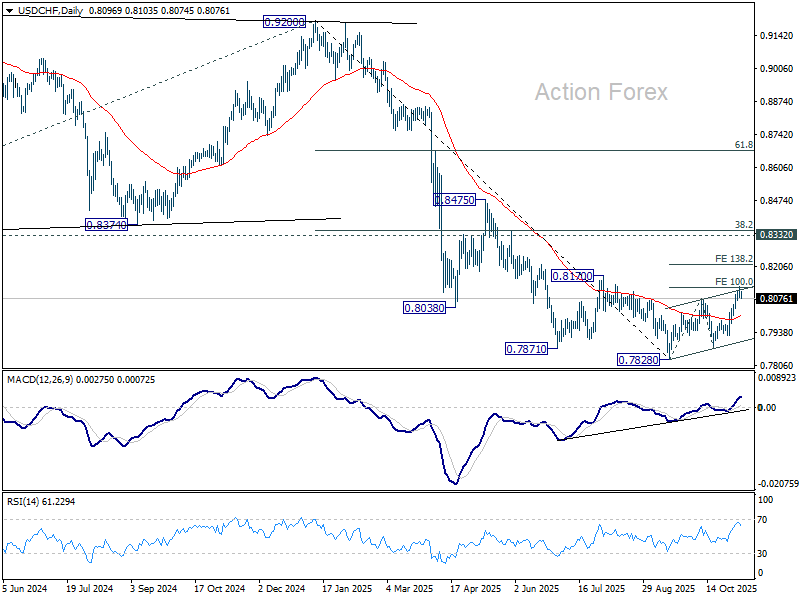
USD/CHF Mid-Day Outlook
Daily Pivots: (S1) 0.8079; (P) 0.8102; (R1) 0.8124; More…
Intraday bias in USD/CHF remains neutral for consolidations below 0.8123 temporary top. On the upside, firm break of 0.8123 will extend the corrective rally from 0.7828 to 138.2% projection of 0.7828 to 0.8075 from 0.7872 at 0.8213. On the downside, sustained break of 55 D EMA (now at 0.8038) will argue that the corrective bounce has completed and bring retest of 0.7828 low.
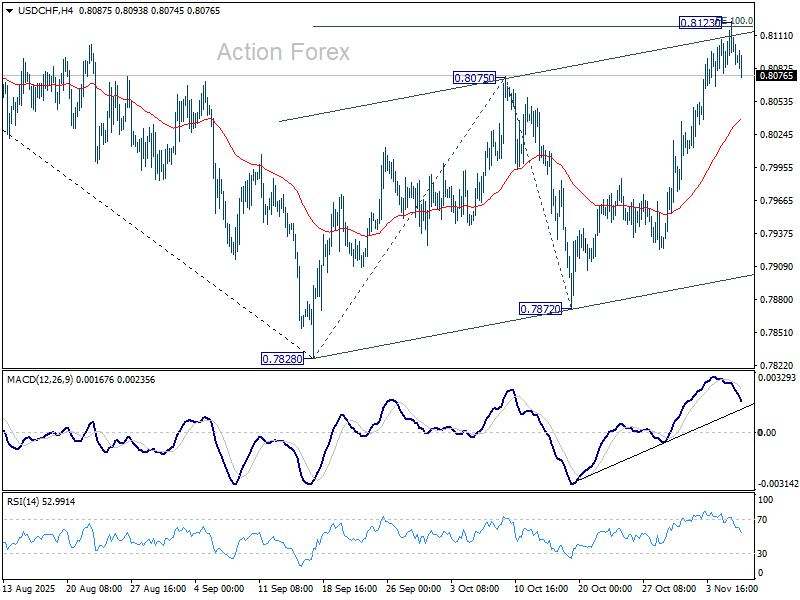
In the bigger picture, long term down trend from 1.0342 (2017 high) is still in progress. Next target is 100% projection of 1.0146 (2022 high) to 0.8332 from 0.9200 at 0.7382. In any case, outlook will stay bearish as long as 0.8332 support turned resistance holds (2023 low).
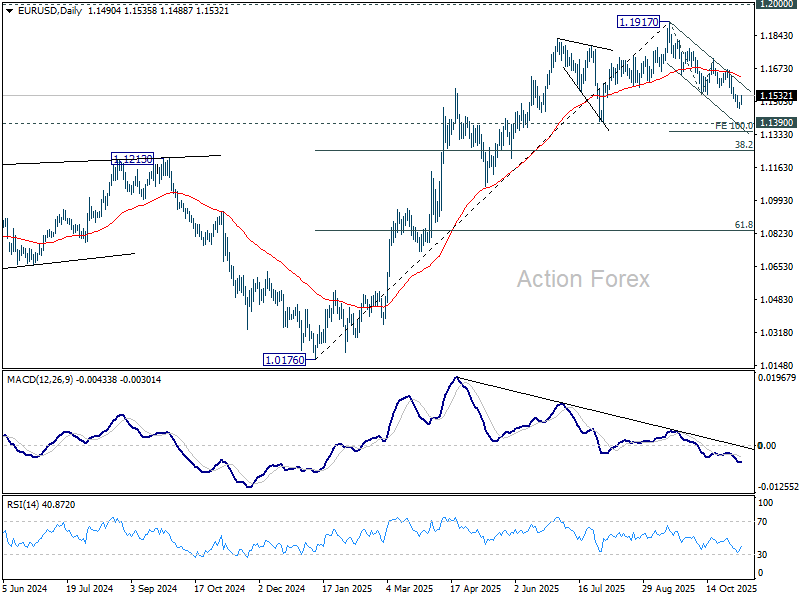
EUR/USD Mid-Day Outlook
Daily Pivots: (S1) 1.1475; (P) 1.1487; (R1) 1.1504; More…
Intraday bias in EUR/USD stays neutral as consolidations continue above 1.1467 temporary low. Further decline is expected as long as 1.1727 resistance holds. Below 1.1467 will extend the fall from 1.1917 to 100% projection of 1.1917 to 1.1540 from 1.1727 at 1.1350. Decisive break there would prompt downside acceleration to 38.2% retracement of 1.0176 to 1.1917 at 1.1252.
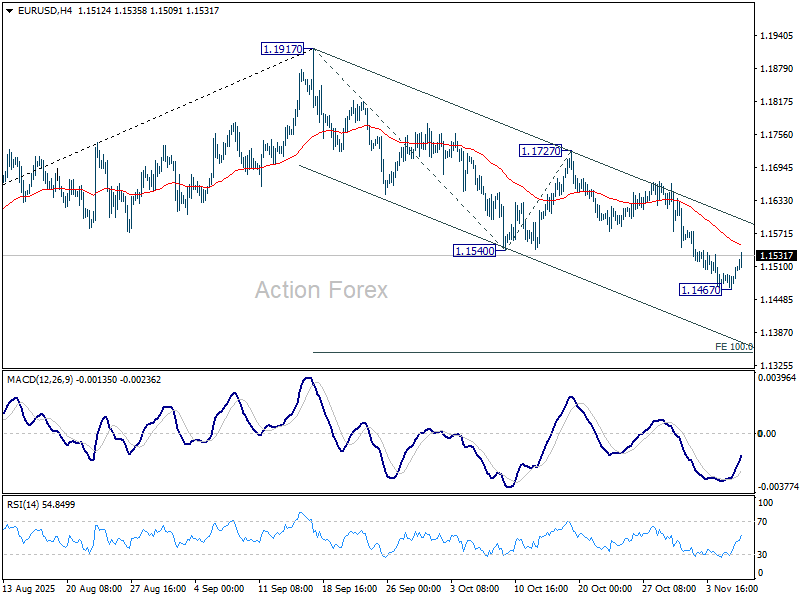
In the bigger picture, considering bearish divergence condition in D MACD, a medium term top is likely in place at 1.1917, just ahead of 1.2 key psychological level. As long as 55 W EMA (now at 1.1306) holds, the up trend from 0.9534 (2022 low) is still expected to continue. Decisive break of 1.2000 will carry larger bullish implications. However, sustained trading below 55 W EMA will argue that rise from 0.9534 has completed as a three wave corrective bounce, and keep outlook bearish.