
Sample Category Title
EUR/AUD Daily Outlook
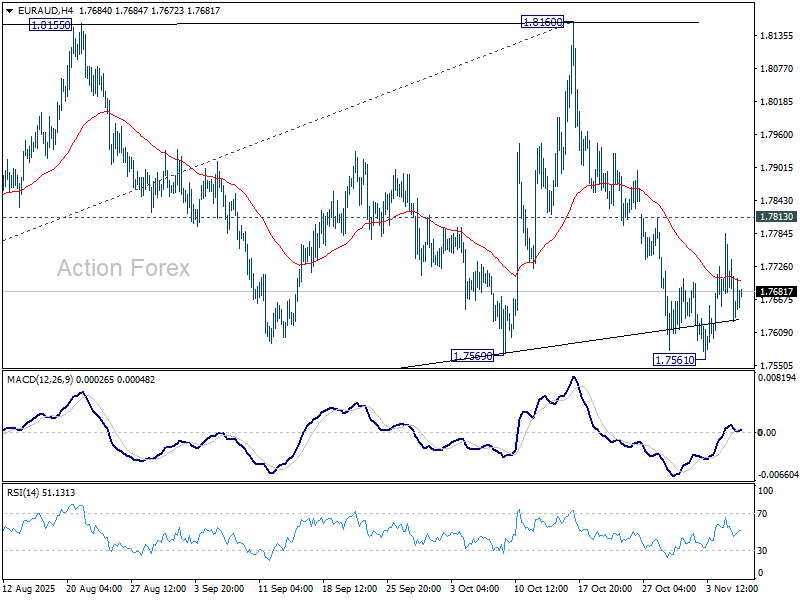
Daily Pivots: (S1) 1.7601; (P) 1.7694; (R1) 1.7755; More...
Intraday bias in EUR/AUD stays neutral for the moment and more consolidations could be seen. Further decline is in favor with 1.7813 minor resistance intact. On the downside, decisive break of 1.7569 support solidify the case that corrective pattern from 1.8554 is already in the third leg. Deeper fall should then be seen to 1.7254 support next. However, strong break of 1.7813 will turn bias back to the upside for 1..8160 resistance instead.
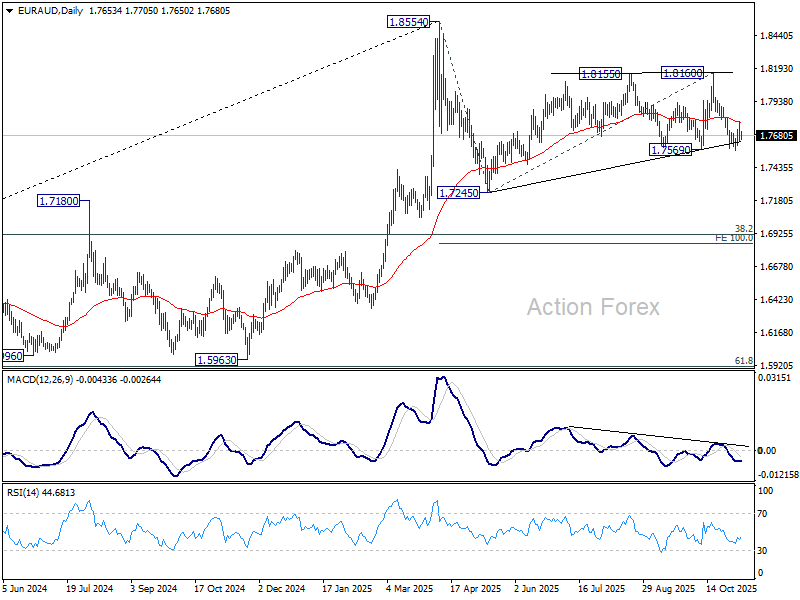
In the bigger picture, price actions from 1.8554 medium term top are seen as a corrective pattern. Sustained break of 55 W EMA (now at 1.7406) will suggest that it's correcting the whole rally from 1.4281 (2022 low). In this case, deeper decline would be seen to 38.2% retracement of 1.4281 to 1.8554 at 1.6922. Nevertheless, strong rebound form 55 W EMA will likely bring resumption of the up trend sooner.
EUR/GBP Daily Outlook
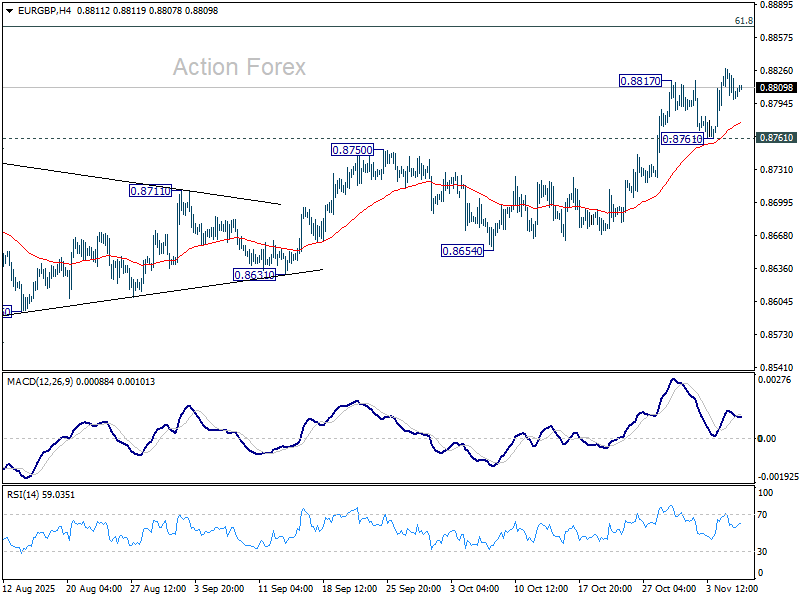
Daily Pivots: (S1) 0.8793; (P) 0.8811; (R1) 0.8824; More…
Intraday bias in EUR/GBP remains on the upside for the moment. Current rise is part of the whole rally from 0.8221. Next target is 0.8867 fibonacci level. Firm break there will carry larger bullish implications. For now, further rise is expected as long as 0.8761 support holds, in case of retreat.
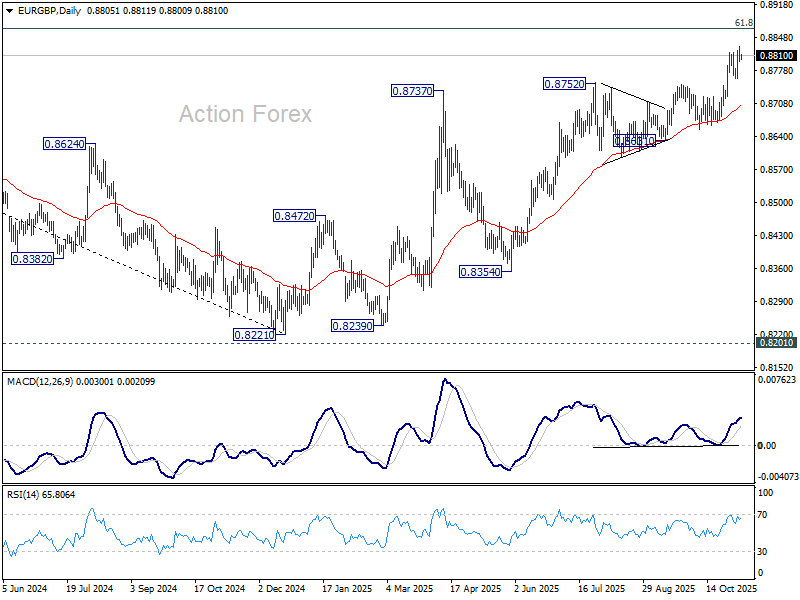
In the bigger picture, rise from 0.8221 medium term bottom is still seen as a corrective move. Upside should be limited by 61.8% retracement of 0.9267 to 0.8221 at 0.8867. Firm break of 0.8654 support will be the first sign that this corrective bounce has completed. However, decisive break of 0.8867 will suggest that EUR/GBP is already reversing whole decline from 0.9267 (2022 high).
BoE in Focus; US Yields Keep Dollar Firm
Market sentiment showed further signs of stabilization today, with Asian equities trading higher after a modest rebound on Wall Street overnight. The sharp AI-driven selloff earlier in the week appears to have passed its initial climax. Still, the recovery remains tentative, suggesting that investors are reluctant to rebuild large positions until the broader correction risk is clearer.
For now, the uptrend in U.S. markets remains technically intact despite this week’s pullback. Major indices, led by NASDAQ, are holding well above key support levels, keeping the year’s broader bullish structure in place. However, confidence is becoming more fragile, and many traders see the recent price action as a warning that the AI rally could be maturing after months of relentless gains.
Meanwhile, one important development to monitor is the renewed climb in U.S. Treasury yields as 10-year yield closed above 4.15%. Yields took another leg higher around midday in New York after U.S. Supreme Court justices signaled skepticism about the legality of tariffs imposed under President Donald Trump. The case has drawn significant market interest due to its potential fiscal implications.
If the court rules against the administration, the White House could be required to return previously collected tariff revenues — funds that have helped offset budget deficits. Such an outcome would likely widen fiscal concerns, driving yields further higher and putting renewed pressure on longer-dated Treasuries.
Overall in the currency markets, the weekly performance picture remains largely unchanged. Yen continues to lead as the strongest currency. Dollar follows closely behind, while Euro is holding firm. At the weaker end, Kiwi remains the laggard, pressured by weak employment data and dovish RBNZ commentary. Loonie and British Pound also underperform. Sterling is particularly vulnerable ahead of today’s BoE rate decision. Markets widely expect a hold at 4.00%, though a minority of analysts see a real risk of a preemptive cut to cushion fiscal tightening later this month. Swiss Franc and Aussie are trading in the middle of the pack.
In Asia, Nikkei rose 1.39%. Hong Kong HSI is up 1.68%. China Shanghai SSE is up 0.94%. Singapore Strait Times is up 1.27%. Japan 10-year JGB yield rose 0.015 to 1.682. Overnight, DOW rose 0.48%. S&P 500 rose 0.37%. NASDAQ rose 0.65%. 10-year yield jumped 0.068 to 4.157.
GBP/USD under pressure, markets see less than one-third chance of BoE cut today
The BoE’s policy decision today is the central focus for the markets, with consensus expecting the Bank Rate to remain unchanged at 4.00%. However, the outcome is far from certain. While most economists expect a hold, market pricing implies less than a one-third chance of a 25 bps cut, reflecting lingering uncertainty over how dovish the committee might lean. Indeed, some forecasters, including Goldman Sachs, are bracing for a narrow 5–4 vote in favor of a cut.
With the deep divisions within the Monetary Policy Committee, BoE’s voting record has become increasingly fractured: Deputy Governor Sarah Breeden and Chief Economist Huw Pill remain among the hawks, while Swati Dhingra and Alan Taylor have consistently called for earlier easing. The stance of the remaining members, including Governor Andrew Bailey, will be key to how markets interpret the decision.
Adding complexity is the upcoming November 26 Budget from Chancellor Rachel Reeves, which is widely expected to deliver a large contractionary impulse to the economy. The timing puts the MPC in a difficult position — whether to act preemptively to cushion the blow or to hold off until fiscal details are clearer.
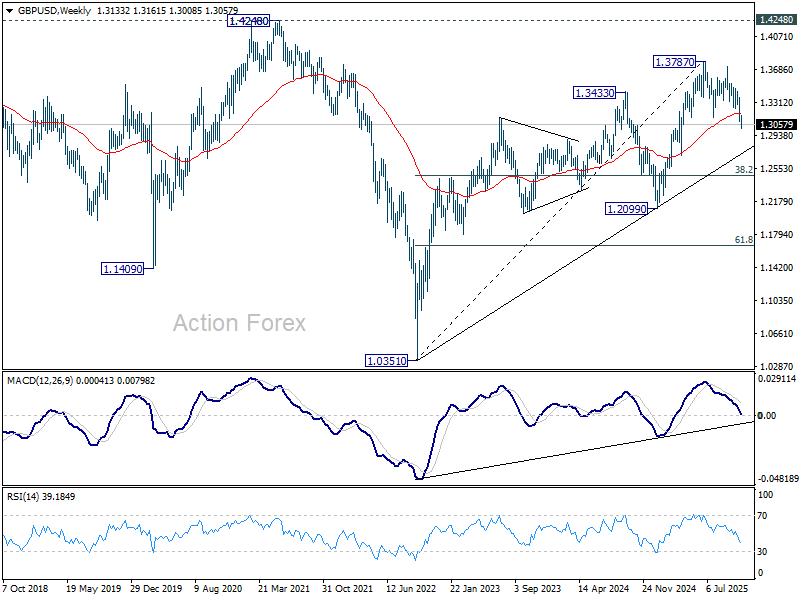
In the currency markets, Sterling remains vulnerable ahead of the decision. The pair’s break below its 55 W EMA (now at 1.3185) last week, followed by continued selling this week, suggests a medium-term top at 1.3787 may be in place. A dovish surprise today could deepen losses toward trendline support around 1.2770. Decisive break there likely indicate that the entire rebound from the 2022 low at 1.0351 has completed.
Japan wage growth at 1.9%, but real income falls for ninth month
Japan’s real wages declined for a ninth consecutive month in September as inflation-adjusted earnings fell -1.4% yoy, following a revised -1.7% drop in August, extending a contraction streak that began in January.
Nominal wages rose 1.9% yoy, slightly below expectations of 2.0% and well short of the 3.4% increase in consumer prices, which accelerated for the first time since April.
While regular pay rose 1.9% yoy, matching August’s pace, and overtime pay ticked up to 0.6% yoy, these gains were insufficient to offset higher living costs. Special payments, largely seasonal bonuses, rose 4.5% after a -7.8% fall in August, offering some temporary relief.
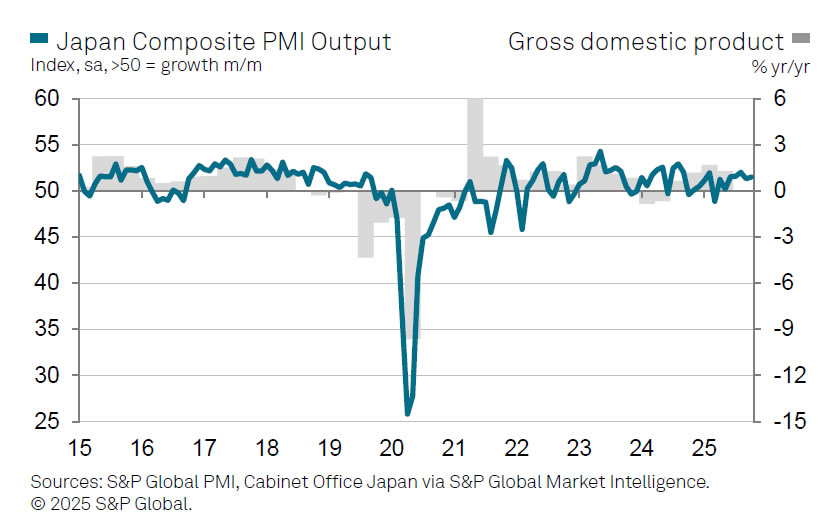
Japan’s PMI composite finalized at 51.5, price risks intensify
Japan’s PMI Services was finalized at 53.1 in October, slightly below September’s 53.3. PMI Composite edged up to 51.5 from 51.3 as strength in services offset continued weakness in manufacturing.
According to Annabel Fiddes, Economics Associate Director at S&P Global Market Intelligence, the survey signaled “further solid expansion” in services output, though other indicators were “not quite as upbeat.”
New business growth slowed sharply, expanding at its weakest pace in 16 months, and foreign demand remained in contraction. At the same time, inflationary pressures intensified, with both input and output prices rising faster, largely due to higher labor costs. Confidence also softened as firms expressed concern about labor shortages and subdued customer demand.
The main risk now lies in intensifying price pressures in both manufacturing and services, which "will be important to monitor in the coming months".
RBNZ’s Hawkesby: Slowdown within expectations, not out of the worst yet
RBNZ Governor Christian Hawkesby said the recent deterioration in the country’s labour market was within expectations. Speaking before a parliamentary committee, Hawkesby noted that the rise in unemployment to its highest level since 2016 reflects where the economy stands in the current cycle. “It is hard out there,” he said, adding that the RBNZ expected this period of softness as part of the adjustment following its recent easing moves.
Despite the alignment with forecasts, Hawkesby warned that risks remain elevated, citing a long list of concerns led by global trade fragmentation and intensifying trade wars. He remarked that “we don’t think we’re out of the worst yet,” pointing to persistent global uncertainty that continues to cloud the medium-term outlook.
The Governor also described New Zealand as a multi-speed economy, with regions and industries responding differently to the current slowdown. While some sectors continue to show resilience, others are struggling under higher costs and weaker demand.
BoC's Macklem sees rate at right level as tariffs reshape Canadian economy structurally
BoC Tiff Macklem told lawmakers overnight that the central bank’s recent policy easing reflects both cyclical weakness and deeper structural challenges facing the Canadian economy. Macklem reiterated that last week’s 25bps rate cut to 2.25% — the second in as many meetings — was aimed at supporting growth amid “contained inflationary pressures.”
Macklem laid out four key messages in his remarks. He said U.S. tariffs and trade uncertainty have significantly weakened Canada’s economy, leading to expectations of “very modest growth” through the rest of 2025, with “some pickup” only by 2026. The trade conflict, he noted, is also producing offsetting inflation dynamics — dampening overall demand but raising input costs for businesses. As a result, these opposing forces should “roughly offset,” keeping inflation near the BoC’s 2% target.
Crucially, Macklem warned that the current slowdown is “more than a cyclical downturn.” He described it as a “structural transition”, arguing that U.S. trade actions have permanently reduced Canada’s productive capacity. The damage from tariffs, he said, has lowered potential growth and limited the central bank’s ability to stimulate demand without reigniting inflation.
“Monetary policy can help the economy adjust as long as inflation is well-controlled,” Macklem emphasized, “but it cannot restore the economy to its pre-tariff path.”
Looking ahead, Macklem suggested that the current policy rate is now “about the right level” to balance inflation control with economic support. The message signals a likely pause in further easing, barring new shocks.
EUR/GBP Daily Outlook
Daily Pivots: (S1) 0.8793; (P) 0.8811; (R1) 0.8824; More…
Intraday bias in EUR/GBP remains on the upside for the moment. Current rise is part of the whole rally from 0.8221. Next target is 0.8867 fibonacci level. Firm break there will carry larger bullish implications. For now, further rise is expected as long as 0.8761 support holds, in case of retreat.
In the bigger picture, rise from 0.8221 medium term bottom is still seen as a corrective move. Upside should be limited by 61.8% retracement of 0.9267 to 0.8221 at 0.8867. Firm break of 0.8654 support will be the first sign that this corrective bounce has completed. However, decisive break of 0.8867 will suggest that EUR/GBP is already reversing whole decline from 0.9267 (2022 high).
GBP/USD under pressure, markets see less than one-third chance of BoE cut today
The BoE’s policy decision today is the central focus for the markets, with consensus expecting the Bank Rate to remain unchanged at 4.00%. However, the outcome is far from certain. While most economists expect a hold, market pricing implies less than a one-third chance of a 25 bps cut, reflecting lingering uncertainty over how dovish the committee might lean. Indeed, some forecasters, including Goldman Sachs, are bracing for a narrow 5–4 vote in favor of a cut.
With the deep divisions within the Monetary Policy Committee, BoE’s voting record has become increasingly fractured: Deputy Governor Sarah Breeden and Chief Economist Huw Pill remain among the hawks, while Swati Dhingra and Alan Taylor have consistently called for earlier easing. The stance of the remaining members, including Governor Andrew Bailey, will be key to how markets interpret the decision.
Adding complexity is the upcoming November 26 Budget from Chancellor Rachel Reeves, which is widely expected to deliver a large contractionary impulse to the economy. The timing puts the MPC in a difficult position — whether to act preemptively to cushion the blow or to hold off until fiscal details are clearer.
In the currency markets, Sterling remains vulnerable ahead of the decision. The pair’s break below its 55 W EMA (now at 1.3185) last week, followed by continued selling this week, suggests a medium-term top at 1.3787 may be in place. A dovish surprise today could deepen losses toward trendline support around 1.2770. Decisive break there likely indicate that the entire rebound from the 2022 low at 1.0351 has completed.
Japan’s PMI composite finalized at 51.5, price risks intensify
Japan’s PMI Services was finalized at 53.1 in October, slightly below September’s 53.3. PMI Composite edged up to 51.5 from 51.3 as strength in services offset continued weakness in manufacturing.
According to Annabel Fiddes, Economics Associate Director at S&P Global Market Intelligence, the survey signaled “further solid expansion” in services output, though other indicators were “not quite as upbeat.”
New business growth slowed sharply, expanding at its weakest pace in 16 months, and foreign demand remained in contraction. At the same time, inflationary pressures intensified, with both input and output prices rising faster, largely due to higher labor costs. Confidence also softened as firms expressed concern about labor shortages and subdued customer demand.
The main risk now lies in intensifying price pressures in both manufacturing and services, which "will be important to monitor in the coming months".
GBP/USD Dives Further, No Sign of Bullish Defense Yet, BoE Next
Key Highlights
- GBP/USD started a major decline and traded below 1.3120.
- A key bearish trend line is forming with resistance at 1.3080 on the 4-hour chart.
- EUR/USD declined further below 1.1500 and tested 1.1475.
- The BoE interest rate decision is scheduled today (forecast 4%).
GBP/USD Technical Analysis
The British Pound failed to stay above 1.3200 against the US Dollar. GBP/USD declined further below 1.3120 and 1.3080 to enter a bearish zone.
Looking at the 4-hour chart, the pair settled below 1.3120, the 100 simple moving average (red, 4-hour), and the 200 simple moving average (green, 4-hour). The pair even tested 1.3000. A low was formed at 1.3009 and the pair is now consolidating losses.
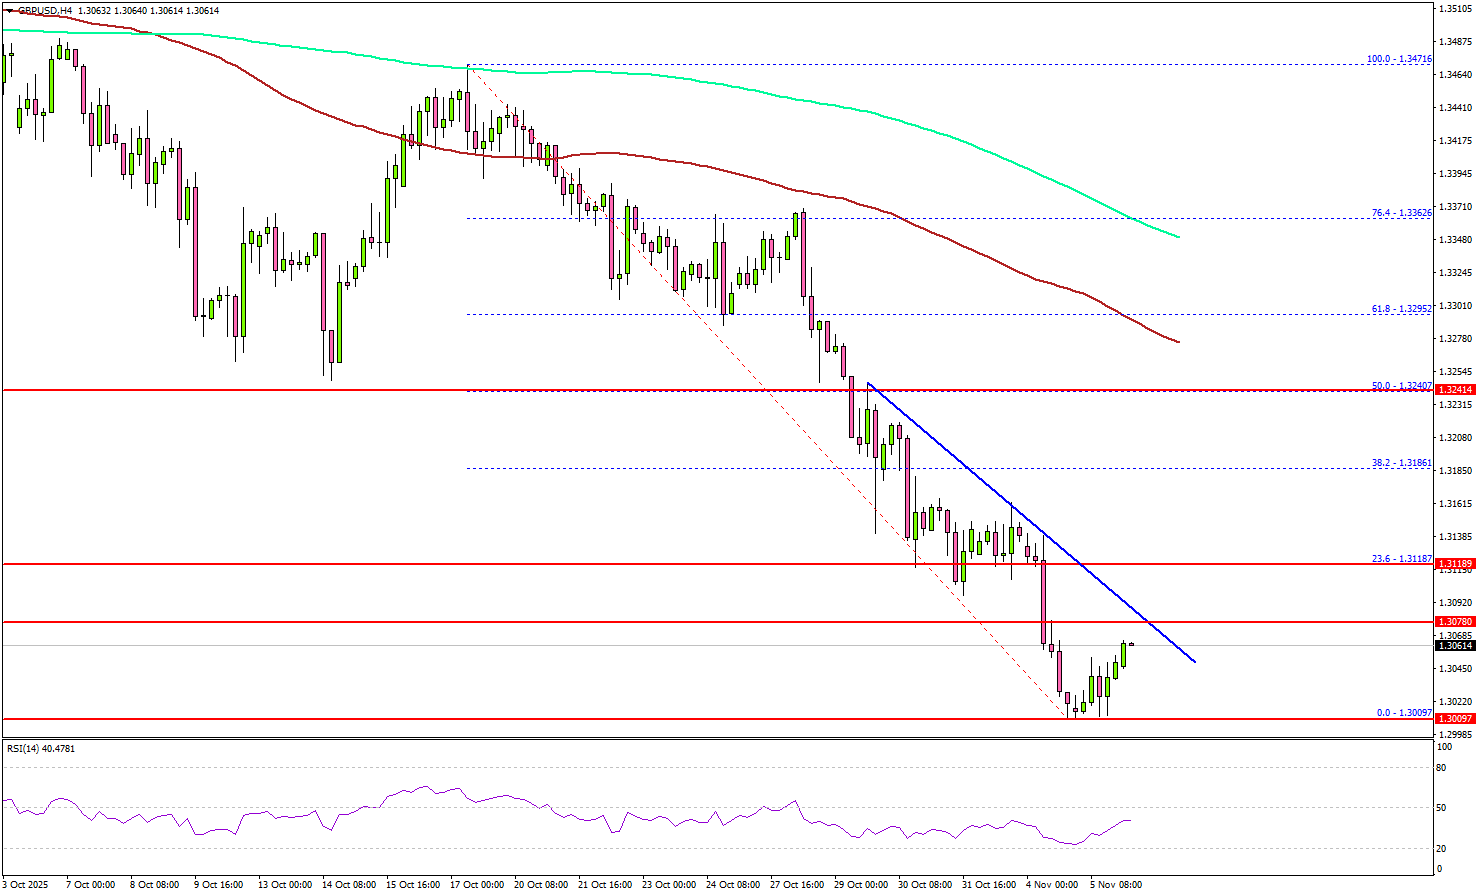
If there is a recovery wave, the pair could face resistance near 1.3080. There is also a key bearish trend line forming with resistance at 1.3080. The first major resistance is 1.3120.
A close above 1.3120 resistance might push the pair to 1.3180 and the 50% Fib retracement level of the downward move from the 1.3471 swing high to the 1.3009 low. Any more gains could set the pace for a steady increase toward 1.3240.
On the downside, the pair might find support at 1.3020. The main support might be 1.3000. A close below the 1.3000 zone could start a major pullback toward 1.2880. Any more losses might open the doors for a test of 1.2750.
Looking at EUR/USD, the pair extended losses below 1.1500 and might struggle to recover above 1.1550 in the near term.
Upcoming Key Economic Events:
- BoE Interest Rate Decision - Forecast 4%, versus 4% previous.
- US Initial Jobless Claims - Forecast 223K, versus 218K previous.
Japan wage growth at 1.9%, but real income falls for ninth month
Japan’s real wages declined for a ninth consecutive month in September as inflation-adjusted earnings fell -1.4% yoy, following a revised -1.7% drop in August, extending a contraction streak that began in January.
Nominal wages rose 1.9% yoy, slightly below expectations of 2.0% and well short of the 3.4% increase in consumer prices, which accelerated for the first time since April.
While regular pay rose 1.9% yoy, matching August’s pace, and overtime pay ticked up to 0.6% yoy, these gains were insufficient to offset higher living costs. Special payments, largely seasonal bonuses, rose 4.5% after a -7.8% fall in August, offering some temporary relief.
RBNZ’s Hawkesby: Slowdown within expectations, not out of the worst yet
RBNZ Governor Christian Hawkesby said the recent deterioration in the country’s labour market was within expectations. Speaking before a parliamentary committee, Hawkesby noted that the rise in unemployment to its highest level since 2016 reflects where the economy stands in the current cycle. “It is hard out there,” he said, adding that the RBNZ expected this period of softness as part of the adjustment following its recent easing moves.
Despite the alignment with forecasts, Hawkesby warned that risks remain elevated, citing a long list of concerns led by global trade fragmentation and intensifying trade wars. He remarked that “we don’t think we’re out of the worst yet,” pointing to persistent global uncertainty that continues to cloud the medium-term outlook.
The Governor also described New Zealand as a multi-speed economy, with regions and industries responding differently to the current slowdown. While some sectors continue to show resilience, others are struggling under higher costs and weaker demand.
BoC’s Macklem sees rate at right level as tariffs reshape Canadian economy structurally
BoC Tiff Macklem told lawmakers overnight that the central bank’s recent policy easing reflects both cyclical weakness and deeper structural challenges facing the Canadian economy. Macklem reiterated that last week’s 25bps rate cut to 2.25% — the second in as many meetings — was aimed at supporting growth amid “contained inflationary pressures.”
Macklem laid out four key messages in his remarks. He said U.S. tariffs and trade uncertainty have significantly weakened Canada’s economy, leading to expectations of “very modest growth” through the rest of 2025, with “some pickup” only by 2026. The trade conflict, he noted, is also producing offsetting inflation dynamics — dampening overall demand but raising input costs for businesses. As a result, these opposing forces should “roughly offset,” keeping inflation near the BoC’s 2% target.
Crucially, Macklem warned that the current slowdown is “more than a cyclical downturn.” He described it as a “structural transition”, arguing that U.S. trade actions have permanently reduced Canada’s productive capacity. The damage from tariffs, he said, has lowered potential growth and limited the central bank’s ability to stimulate demand without reigniting inflation.
“Monetary policy can help the economy adjust as long as inflation is well-controlled,” Macklem emphasized, “but it cannot restore the economy to its pre-tariff path.”
Looking ahead, Macklem suggested that the current policy rate is now “about the right level” to balance inflation control with economic support. The message signals a likely pause in further easing, barring new shocks.
US Private Data Shows Resilience
The US government shutdown officially became the longest in history today — 36 days and counting — yet markets found some relief in stronger-than-expected private data amid the lack of public releases.
The ISM Services PMI hit its highest level since February, and ADP employment came in at 42K vs. 25K expected, underscoring the economy’s resilience despite the political gridlock.
Equities staged a solid rebound after a rough weekly open, but sellers re-emerged late in the session, capping gains and reminding traders that volatility is here to stay.
Adding to the uncertainty, Trump’s tariffs are now being reviewed by the Supreme Court, injecting another layer of tension into an already fragile market mood.
With the December Fed rate cut still about 60% priced in despite Powell's recent hawkish return, elevated volatility looks set to persist.
Cross-Assets Daily Performance
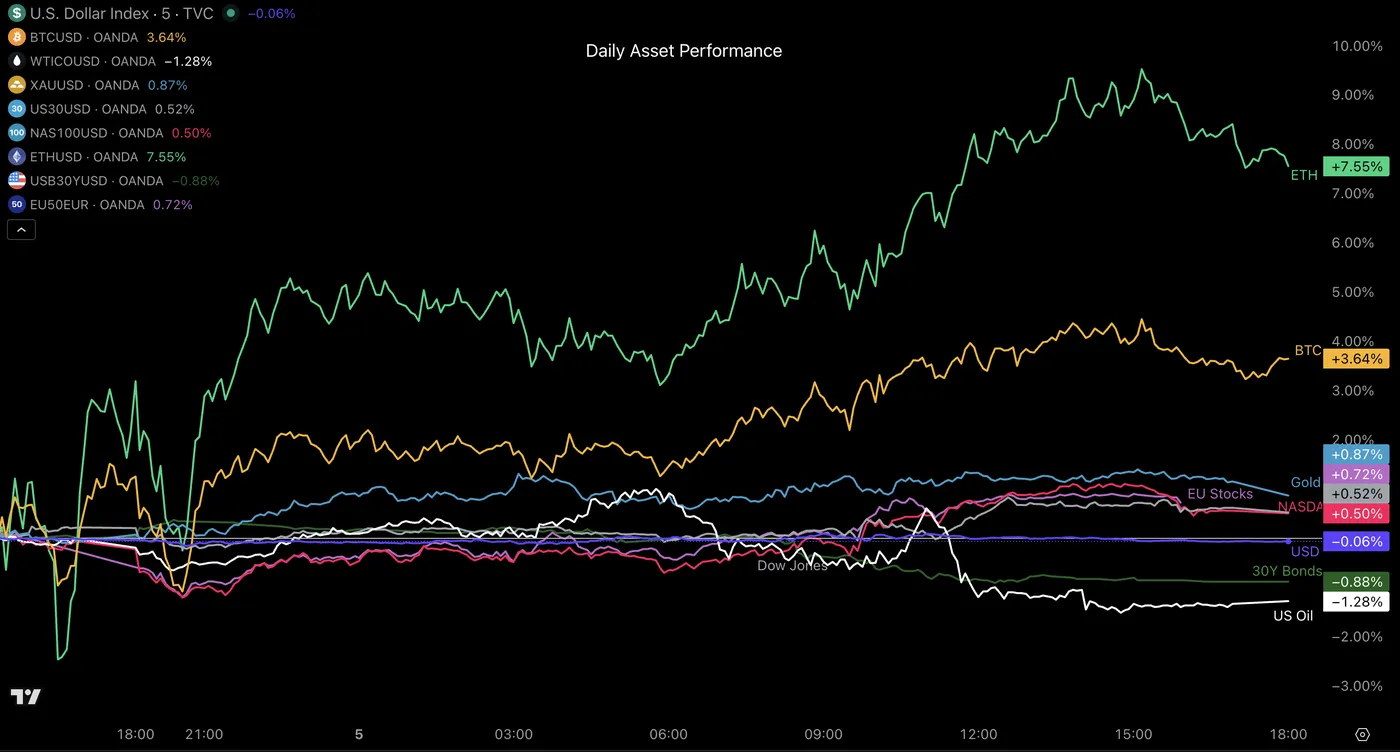
Cross-Asset Daily Performance, November 5, 2025 – Source: TradingView
Today's flows got right back to the 2025 regular flows: Risk-assets rallying among gold (Cryptos largely overperformed) and the losing combo being US Treasuries and Oil.
Despite the better US-China relations and very decent numbers, oversupply from OPEC+ and Russia keep on dragging oil prices lower after every rebound.
A picture of today's performance for major currencies
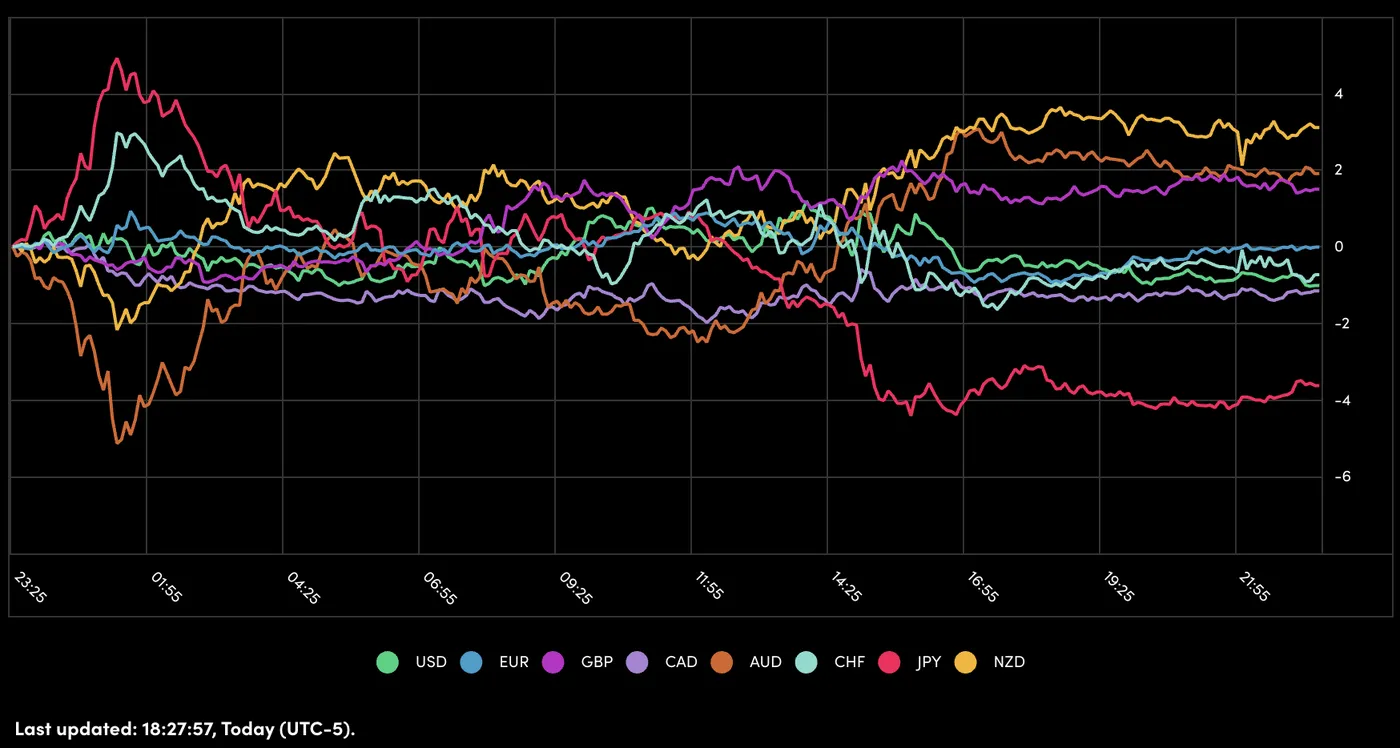
Currency Performance, November 5 – Source: OANDA Labs
Today's trading saw low amplitude in Forex movement. Nonetheless, the US stopped its multi-week ascent (which didn't leave much space for other majors).
The Japanese yen continues to underperform since PM's Takaichi got appointed, with USD/JPY trading in the 154.00 handle, up 4.56% since beginning October.
A look at Economic data releasing through tonight and tomorrow's session
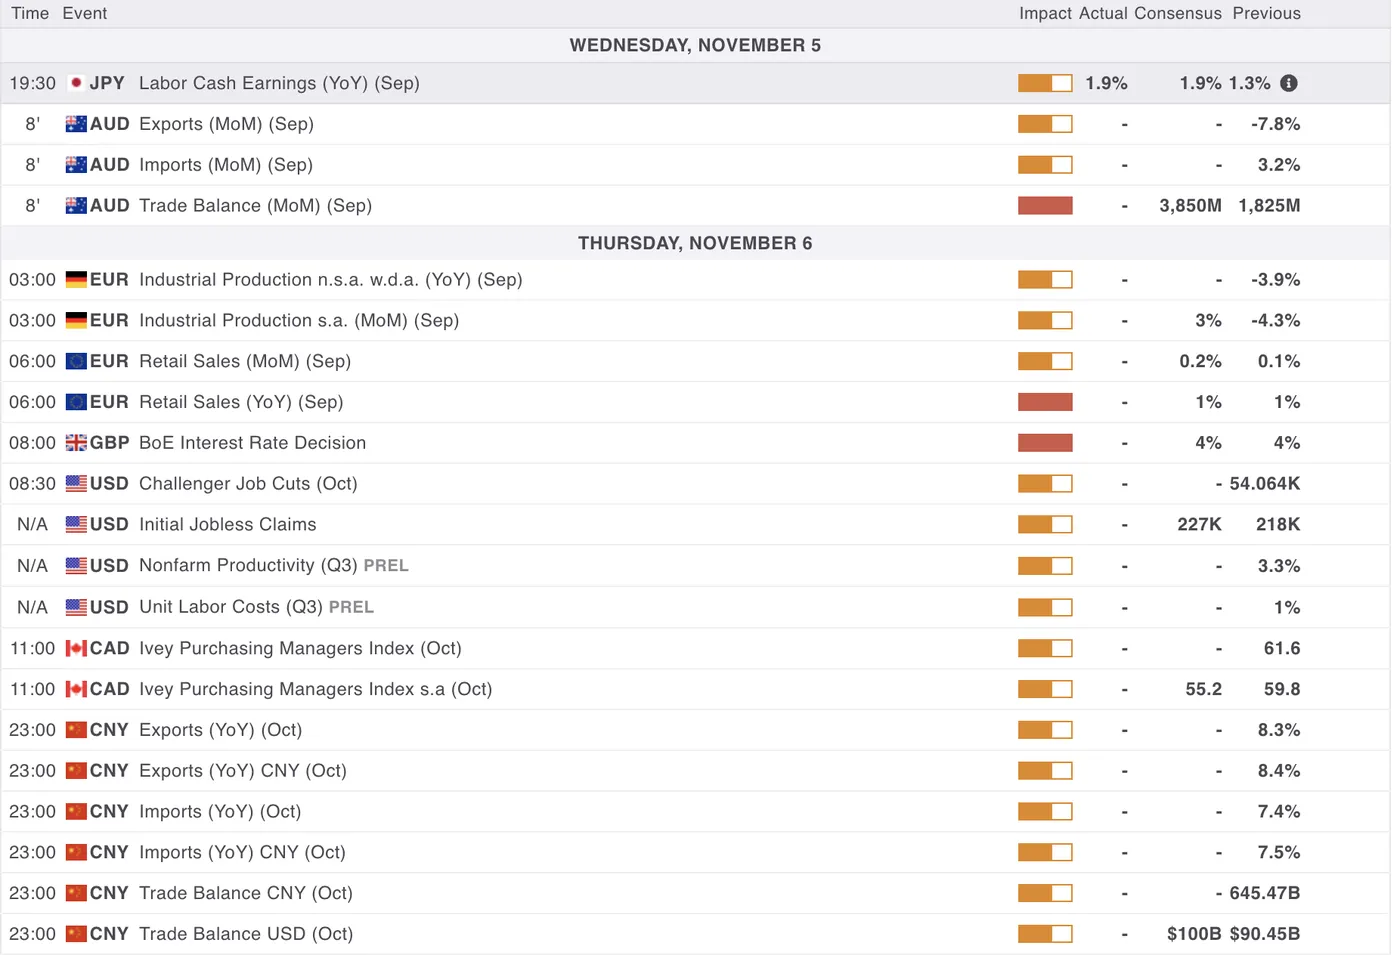
For all market-moving economic releases and events, see the MarketPulse Economic Calendar.
Once again, participants won't be able to access the normally weekly Jobless Claims release (the 6th consecutively not released) amid the ongoing shutdown.
The FX program is expected to be quite filled with Australian trade data releasing tonight, and overnight's EU retail sales data.
The North American session will first welcome the Bank of England Rate decision with the release of the Monetary Policy Report (Very important for the GBP).
Throughout the rest of the session, expect a flurry of speakers from the Bank of England, Bank of Canada, the usual heavy FEDspeak and a few from the ECB.
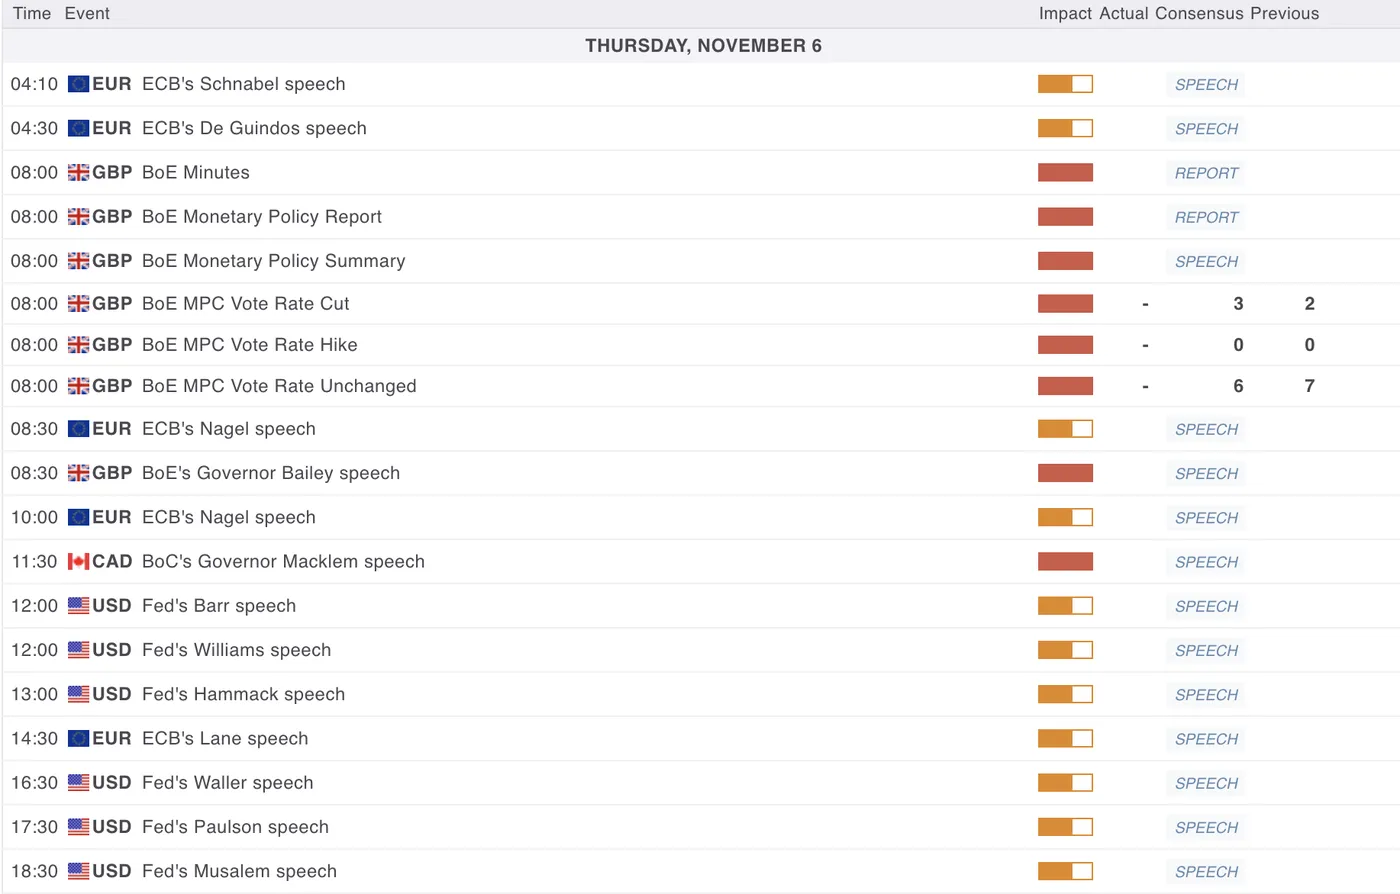
All speeches from Central bank speakers in tomorrow's session
Safe Trades!