Sample Category Title
Dollar Index: Bulls May Take a Breather After Cracking Key Barriers
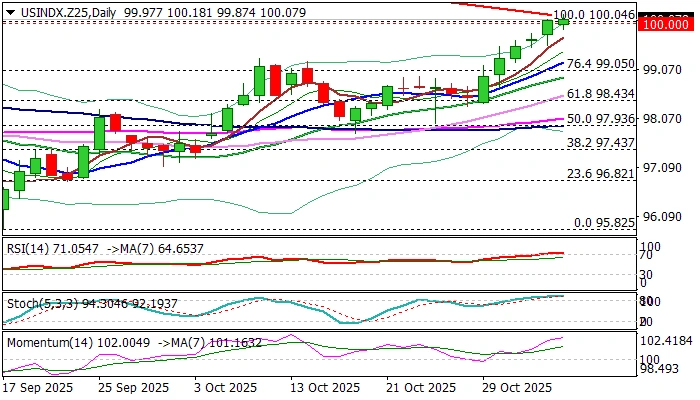
The Dollar index keeps firm tone and riding on the fresh wave of risk aversion, to crack psychological 100 barrier (also former top of Aug 1) and nearby falling 200DMA (100.15) on Wednesday.
The recent more hawkish than expected remarks from Fed chief Powell faded high expectations for another rate cot in December and boosted the greenback.
Absence of key labor data for the second consecutive month, due to US government closure, added to Fed’s argument about more cautious approach to monetary policy that cooled market bets for December rate cut from 92% to 75%.
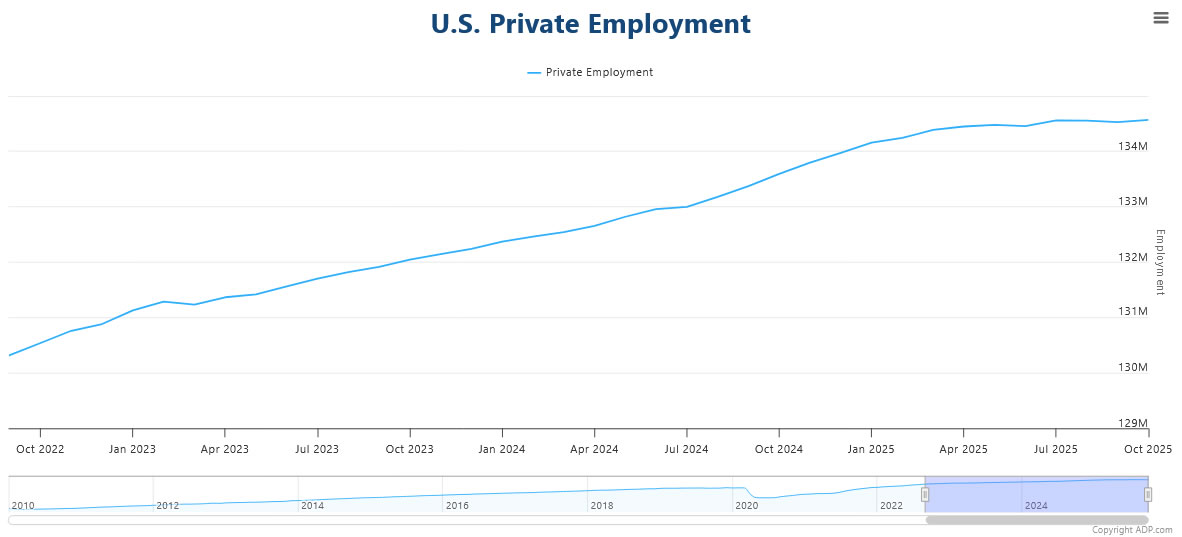
The only available report – ADP private sector payrolls, showed better than expected results in October, bringing a dash of optimism about the condition of the US labor sector that would also contribute to current lowered expectations for December policy meeting.
Sustained break of these barriers would generate fresh bullish signal and further strengthen firm bullish structure on daily chart, however, overbought conditions warn that bulls may face headwinds at this zone and pause for consolidation / limited correction.
Potential dips should find footstep above supports at 99.30/20 zone (former top / 10DMA) to keep bulls intact and offer better levels to re-enter bullish market.
Res: 100.18; 100.40; 100.74; 101.10.
Sup: 99.87; 99.53 99.20; 99.05.
Sunset Market Commentary
Markets
A cautious risk sentiment still dominated (equity) trading today. Macro data probably won’t be a major factor in deciding whether this move has to continue or how far it should go. Still some of today’s data are worth mentioning. Final EMU PMI’s almost by definition are no market movers. Even so, the headline composite PMI improved an already better than expected preliminary release. At 52.5, the index indicates the fastest pace of EMU growth since May 2023, driven by an acceleration in services activity. The report even assesses a ‘breakout from the generally subdued growth trend seen throughout 2025 so far’. On a country level solid data were registered for Spain (56, 10-month high), Germany 53.9 (29-month high) and Italy (53.1, 19-month high). The figure still was dragged down by a poor performance of France (47.7, 8-month low, but less worse than the preliminary reading of 46.8). Even as HCOB comments that ‘keeping up this relatively strong growth momentum in the services sector over the coming months won’t be easy’, PMI’s confirm that he ECB is indeed in a good place to keep its wait-and-see stance well into next year. At the same time, the ECB negotiated wage tracker suggests modest wage growth for next year (2.2% for the headline indicator in Q3 2026). A risk-off correction as such isn’t a direct trigger for a central bank to ease policy and given recent data this a fortiori applies for current ECB stance. In this context EMU yields yesterday and today decline only marginally despite the risk-off. German yields today are changing less than 1 bp. A similar story for US bond markets. After last week’s hawkish Fed cut, US yields in yesterday’s risk sell-off declined less than 3 bps. Today, yields initially declined marginally further, but a slightly stronger than expected ADP private job report (October job growth of 42k from -29k in Sept. and +30k expected) even was enough to push yields into positive territory (2-y +4 bp; 30-y +5 bpn). The US Treasury also published its quarterly refunding statement, keeping auction seizes unchanged. At time the finishing this report, a solid services ISM (52.4 from 50) support the intraday rebound in yields. Returning to risk sentiment, equity markets show some hesitancy (EuroStoxx 50 +0.15%; Nasdaq regains 0.5%). At least there is no aggressive follow-through selling on yesterday’s setback.
On FX, the US dollar, after recent risk driven gains, shifts into a lower gear but the DXY trade-weighted index is still testing the 100.26 early August top. The yen slightly underperforms (USD/JPY 153.95). EUR/USD trades little changed near 1.148. Sterling maintains recent losses going into tomorrow’s BoE policy decision. EUR/GBP broke the 0.877
News & Views
The Riksbank kept its policy rate unchanged at 1.75% today. It said the outlook for inflation and economic activity remains largely unchanged. Prices are still rising at a speed (between 2.7-3.1% depending on the gauge) faster than the central bank’s 2% target but the deceleration has been in line with the September forecast. That strengthens the Riksbank’s view that elevated inflation is transitory. Economic growth meanwhile has come in somewhat stronger than expected and the labour market, though still weak, is showing signs that a turnaround is on its way. The central bank assumes the current policy rate level to remain there for some time to come, in line with the September communication. The krona traded little changed on today’s decision. With EUR/SEK hovering around 11.01, the Swedish currency is about the same level as it was in September and therefore much stronger compared with the beginning of the year. The central bank anticipates some further strengthening going forward and said this too would contribute to dampening inflation.
Czech CPI rose a faster-than-expected 0.5% m/m last month. Core gauges all increased between 0.4% and 0.6% and food prices rallied 1.1%. Annual figures picked up from September as well with the headline number coming in at 2.5%. Underlying series printed well north of 3%, creeping further north of the central bank’s 2% +/-1 ppt target range. Energy prices dropped 0.2% m/m and 3.3% y/y but goods inflation quickened sharply, by 0.7% to 1.3% y/y (from 0.8%). Still-elevated services inflation (0.4% m/m, 4.6% y/y) is one of the key reasons for the ongoing cautious stance by the Czech National Bank. The inflation numbers come on the heels of last week’s much stronger than expected Q3 growth and cement the CNB’s rates status quo at 3.5%. The central bank meets tomorrow. EUR/CZK hovers near 24.37, with the pair trading a tight trading range for the last two months between 24.2 & 24.4.
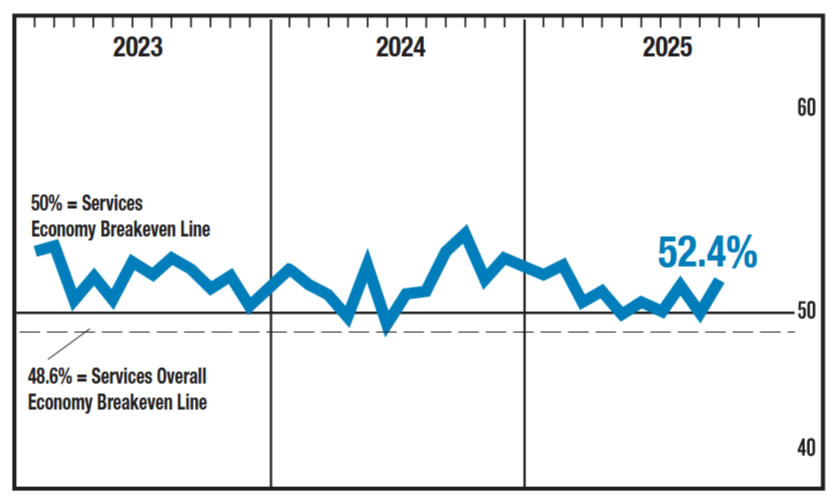
US ISM services jumps to 52.4, prices highest since late 2022
The U.S. services sector expanded at its fastest pace since February, signaling renewed momentum in the largest part of the economy. ISM Services PMI rose to 52.4 in October from 50.0, beating expectations of 50.8.
The report showed broad-based improvement, with business activity up to 54.3 from 49.9 and new orders surging to 56.2 from 50.4 — a clear sign that demand remains resilient. The employment index improved modestly to 48.2 from 47.2 but stayed in contraction, suggesting that service providers remain cautious about hiring.
However, the standout concern came from prices, which rose from 69.4 to 70.0, marking the highest reading since October 2022 and the 11th consecutive month above 60.0. That points to persistent inflationary pressure in the sector.
According to ISM, the October reading corresponds to roughly 1.2% annualized gain in U.S. GDP.
EUR/USD Mid-Day Outlook
Daily Pivots: (S1) 1.1459; (P) 1.1496; (R1) 1.1520; More…
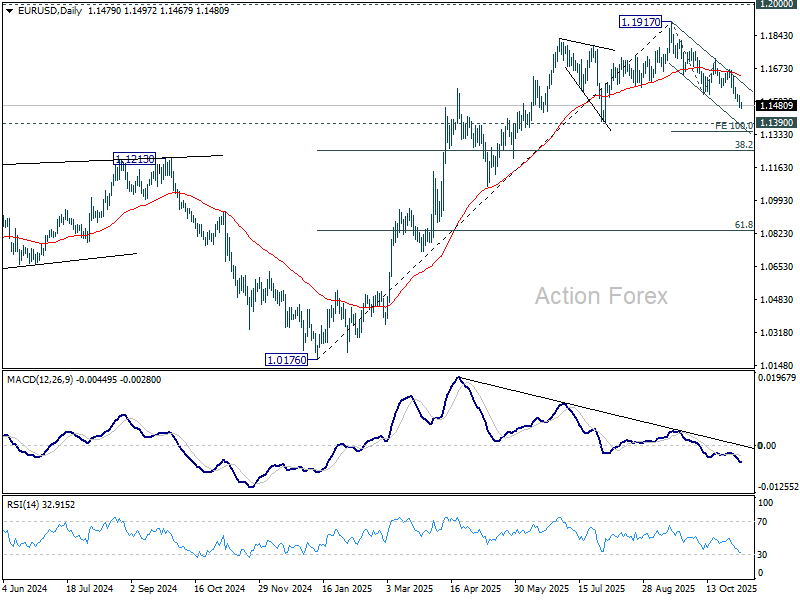
EUR/USD's decline is in progress and intraday bias stays on the downside for 100% projection of 1.1917 to 1.1540 from 1.1727 at 1.1350. Decisive break there would prompt downside acceleration to 38.2% retracement of 1.0176 to 1.1917 at 1.1252. On the upside, above 1.1540 minor resistance will turn bias neutral and bring consolidations first, before staging another fall.
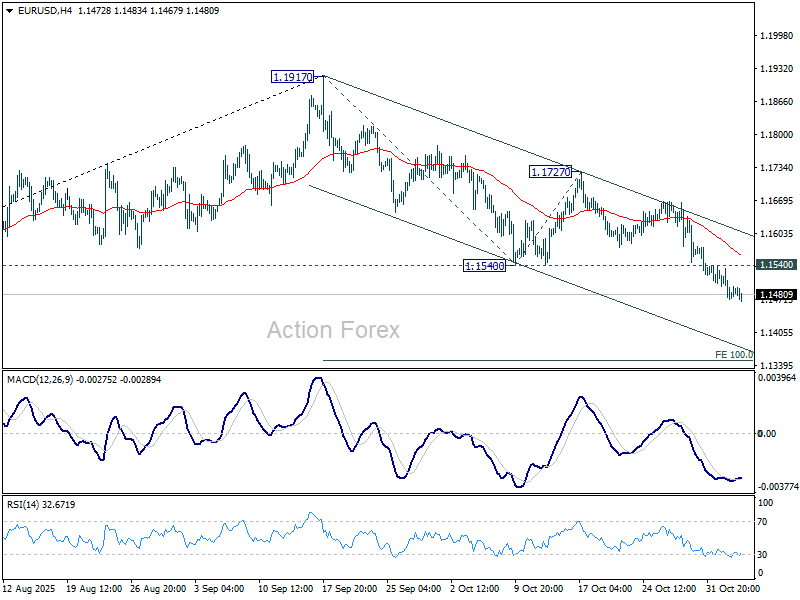
In the bigger picture, considering bearish divergence condition in D MACD, a medium term top is likely in place at 1.1917, just ahead of 1.2 key psychological level. As long as 55 W EMA (now at 1.1306) holds, the up trend from 0.9534 (2022 low) is still expected to continue. Decisive break of 1.2000 will carry larger bullish implications. However, sustained trading below 55 W EMA will argue that rise from 0.9534 has completed as a three wave corrective bounce, and keep outlook bearish.
GBP/USD Mid-Day Outlook
Daily Pivots: (S1) 1.2972; (P) 1.3059; (R1) 1.3108; More...
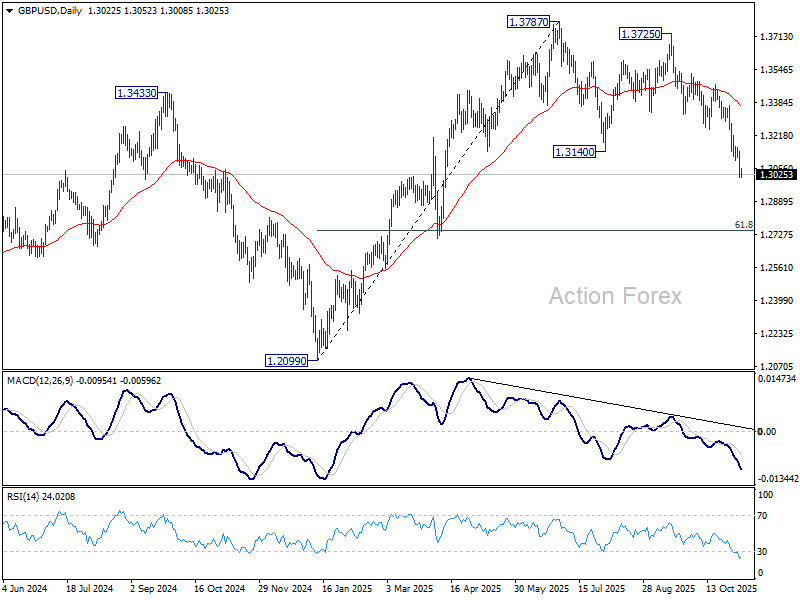
GBP/USD's fall from 1.3787 is in progress and intraday bias stays on the downside for 61.8% retracement of 1.2099 to 1.3787 at 1.2744 next. Sustained break there will pave the way to 1.2099 support next. On the upside, above 1.3095 minor resistance will turn intraday bias neutral first. But risk will stay on the downside as long as 1.3247 support turned resistance holds, in case of recovery.
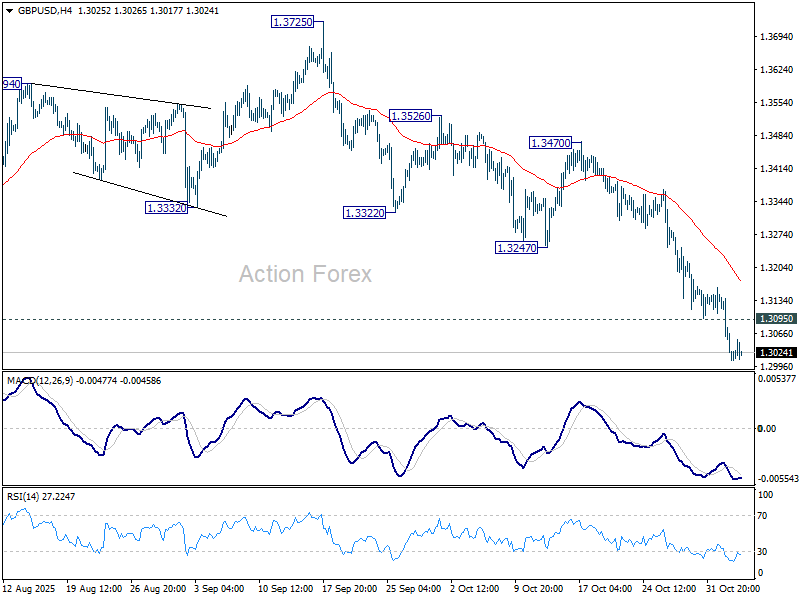
In the bigger picture, the break of 55 W EMA (now at 1.3185) is taken as the first sign that corrective rise from 1.0351 (2022 low) has completed. Further break of 1.2099 support should confirm this bearish case. Meanwhile, in case of another rise, strong resistance should emerge below 1.4248 (2021 high) to cap upside to preserve the long term down trend.
USD/JPY Mid-Day Outlook
Daily Pivots: (S1) 153.99; (P) 154.14; (R1) 154.38; More...
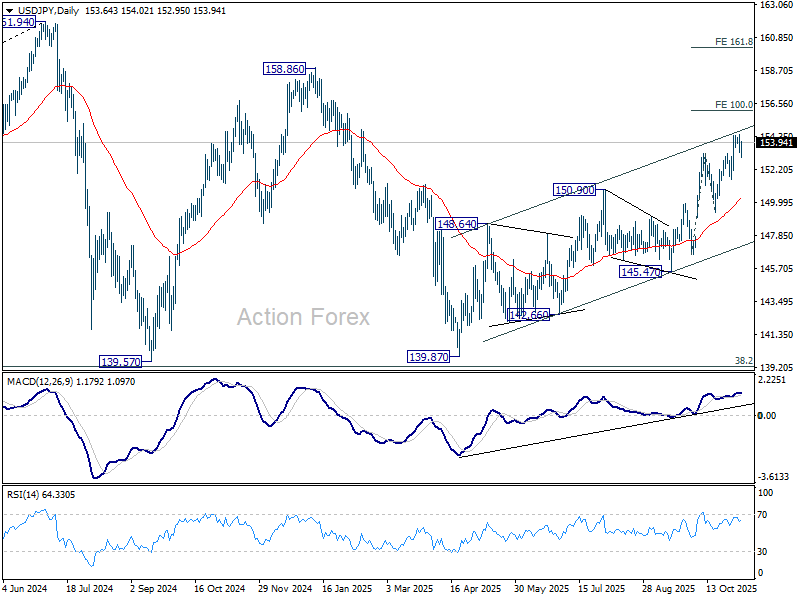
USD/JPY recovered after drawing support from 55 4H EMA, but stays below 154.47 resistance. Intraday bias remains neutral for the moment. Further rally is expected as long as 151.52 support holds. Above 154.47 will resume larger rise from 139.87 to 100% projection of 146.58 to 153.26 from 149.37 at 156.05. Break there will pave the way to 158.85 key structural resistance.
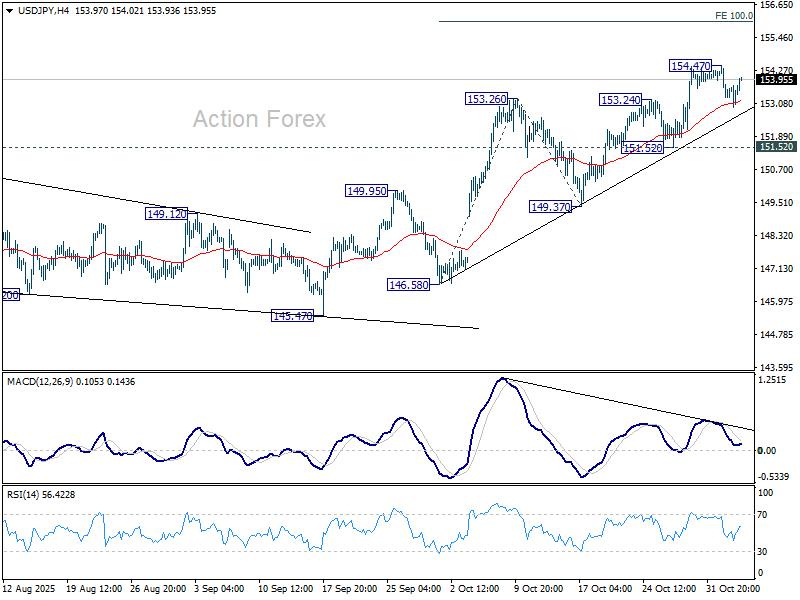
In the bigger picture, current development suggests that corrective pattern from 161.94 (2024 high) has completed with three waves at 139.87. Larger up trend from 102.58 (2021 low) could be ready to resume through 161.94 high. On the downside, break of 145.47 support will dampen this bullish view and extend the corrective pattern with another falling leg.
USD/CHF Mid-Day Outlook
Daily Pivots: (S1) 0.8078; (P) 0.8094; (R1) 0.8120; More…
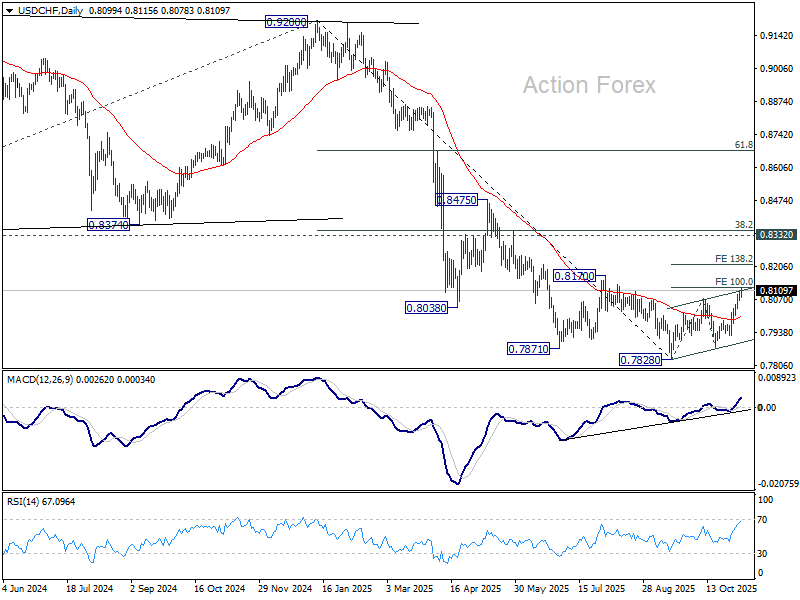
Intraday bias in USD/CHF remains on the upside for 100% projection of 0.7828 to 0.8075 from 0.7872 at 0.8119. Break there will extend the corrective rally from 0.7828 to 138.2% projections at 0.8213. On the downside, break of 0.8066 minor support will suggest that deeper pullback might be underway, and turn bias to the downside for 55 4H EMA (now at 0.8025).
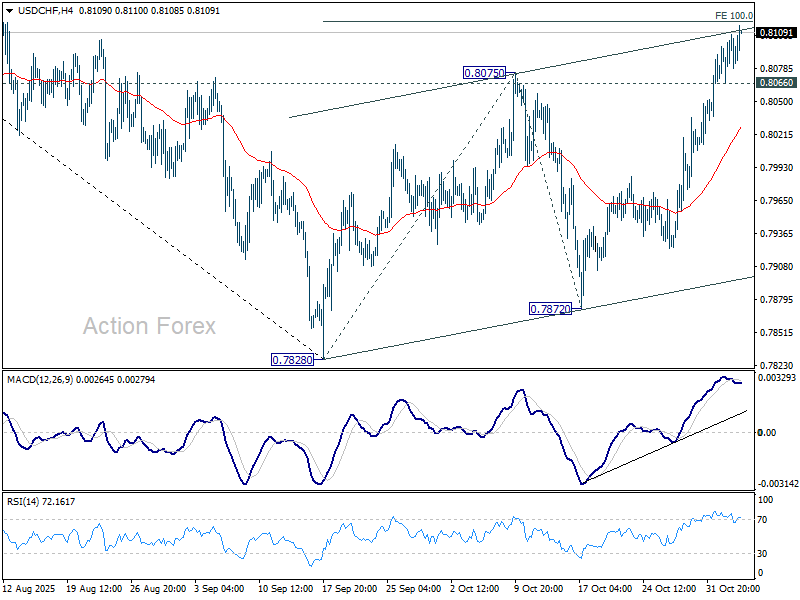
In the bigger picture, long term down trend from 1.0342 (2017 high) is still in progress. Next target is 100% projection of 1.0146 (2022 high) to 0.8332 from 0.9200 at 0.7382. In any case, outlook will stay bearish as long as 0.8332 support turned resistance holds (2023 low).
Muted Market Reaction After ADP; Risk Tone Steadies but Caution Persists
The latest ADP private employment report provided a modest dose of reassurance to the Fed, showing that U.S. job growth may be stabilizing after a period of softness. Following the data, Fed funds futures reflected roughly 70% chance of a December rate cut, up slightly from last week but still leaving room for doubt.
Markets appear cautiously optimistic that policy easing remains on track, but investors are waiting for confirmation from upcoming nonfarm payrolls and inflation releases. For now, the Fed’s “wait-and-see” message continues to anchor expectations.
Broader market reactions, however, were subdued. The mood in risk assets steadied after Tuesday’s sharp tech-led selloff, which erased earlier optimism around AI and growth stocks. U.S. equity futures traded flat, suggesting investors are reluctant to rebuild risk exposure too quickly. While the worst appears to have passed for now, renewed selling in technology shares could return later in the session if rebound attempts fail to gain traction.
In the currency markets, the weekly performance picture is little changed. Yen remains the strongest performer, supported by safe-haven demand, followed by Dollar and Euro. At the weaker end, Kiwi continues to lag, trailed by Aussie and Loonie, while Sterling and the Swiss Franc trade in mid-range.
In Europe, at the time of writing, FTSE is up 0.17%. DAX is down -0.34%. CAC is down -0.04%. UK 10-year yield is up 0.029 at 4.459. Germany 10-year yield is down -0.002 at 2.654. Earlier in Asia, Nikkei fell -2.50%. Hong Kong HSI fell -0.07%. China Shanghai SSE rose 0.23%. Singapore Strait Times fell -0.13%. Japan 10-year JGB yield fell -0.01 to 1.667.
US ADP jobs rise 42K in October, large firms lead modest rebound
U.S. private-sector employment rose modestly in October, with ADP reporting a gain of 42k jobs, slightly above expectations of 32k. It was the first increase since July, suggesting some stabilization in hiring after months of softness. However, the pace of job creation remains well below levels seen earlier in the year, pointing to a labor market that is cooling gradually rather than collapsing.
Sector data showed 33k new service jobs and 9k in goods production. Large firms (+73k) drove most of the gains. Small (-10k) and medium-sized (-21k) companies continued to shed workers. Wage growth remained steady, with job-stayers up 4.5% yoy and job-changers up 6.7% yoy, both unchanged from September.
Overall, the data suggest hiring is stabilizing at lower levels, aligning with the Fed’s goal of cooling the economy without triggering widespread job losses.
Eurozone PPI edges lower, energy costs weigh
Eurozone producer prices dipped slightly in September. PPI fell -0.1% mom and -0.2% yoy, matching market expectations.
The decline was led primarily by softer energy prices, which fell -0.2% on the month, while prices for intermediate and capital goods remained stable. Among consumer categories, durable goods rose 0.3% and non-durable goods edged up 0.1%.
Across the broader European Union, producer prices rose 0.1% mom and 0.1% yoy, suggesting only a mild uptick in cost pressures. The largest monthly declines were seen in Bulgaria and Finland (-0.7%), while Romania (+1.2%), Estonia (+0.7%), and Lithuania (+0.4%) posted the biggest increases.
Eurozone composite PMI hits 29-month high as Germany leads recovery
Eurozone business activity accelerated strongly in October, with HCOB Services PMI finalized at 53.0, the highest in 17 months, up from 51.3 in September. Composite PMI also climbed to 52.5, a 29-month high, signaling the region’s strongest pace of expansion since early 2023. The rebound was broad-based across major economies, though notable divergences remain, with Spain and Germany leading the upturn while France continues to lag.
Among individual countries, Spain topped the rankings with a Composite PMI of 56.0, marking a 10-month high. Germany’s index surged to 53.9, its best in 29 months, followed by Ireland (53.7) and Italy (53.1). In contrast, France slipped further into contraction at 47.7, an eight-month low.
According to Cyrus de la Rubia, Chief Economist at Hamburg Commercial Bank, the services sector’s upswing was supported by the strongest growth in new business since May 2023. Rising orders encouraged firms to hire more staff, providing hope that the expansion could prove sustainable into year-end.
Cost inflation in services has eased slightly, though selling price inflation ticked up, suggesting companies are regaining some pricing power amid firmer demand. For the ECB, the PMI figures pose no immediate inflationary threat.
UK PMI composite finalized at 52.2, firmer growth, easing inflation pressures
The UK services sector showed encouraging signs of recovery in October, with PMI Services finalized at 52.3, up from September's 50.8. Composite PMI also improved to 52.2 from 50.1.
According to Tim Moore, Economics Director at S&P Global Market Intelligence, the latest survey “offered some positive signals,” as both output and new business growth accelerated notably from September’s lows.
Service providers reported stronger client demand and a pickup in new orders, particularly in domestic markets. Many firms cited resilient consumer spending and a turnaround in new client wins as key drivers of October’s improvement. The data also pointed to labour market stabilization, with job cuts slowing sharply and business expectations rising to a 12-month high.
While higher wages were still pushing up costs, the overall pace of input inflation fell to its lowest level since November 2024. Selling prices increased at the slowest pace since June.
BoJ minutes: Hawks urge gradual tightening, others prefer to wait
Minutes from the BoJ’s September policy meeting revealed a deeply divided board, with members debating the pace and timing of future rate hikes. The nine-member board voted to keep the policy rate steady at 0.5%, rejecting calls by two hawkish members who wanted to raise borrowing costs to 0.75%. The discussion centered on balancing the downside risks to growth against persistent inflationary pressures, particularly from elevated food prices.
Some members argued for moving sooner rather than later. One hawkish participant called for raising rates at “somewhat regular intervals”, citing an improving flow of data, including corporate earnings and the Tankan business survey, as valuable indicators to guide normalization. Another member warned that the cost of waiting too long to tighten policy was “gradually increasing,” even if it would allow the BoJ to gain more clarity on the global outlook, especially from the U.S.
However, the majority on agreed it was better to wait for “a little more hard data” before considering another move. They noted that while conditions for tightening were gradually being met, acting now could “surprise the market” and risk destabilizing financial conditions. Some emphasized that as long as inflation expectations remain insufficiently anchored, maintaining accommodative conditions was appropriate to support Japan’s recovery.
Another member highlighted uncertainty surrounding the U.S. slowdown as a key reason to stay cautious, but conceded that, based purely on domestic fundamentals, Japan might soon meet the conditions for another hike.
New Zealand labor market stagnates, unemployment rate rises to 5.3%
New Zealand’s labor market showed further signs of softening in the Q3, with total employment flat at 0.0% qoq, missing expectations for a small 0.1% qoq rise. On an annual basis, employment fell -0.6% yoy.
Unemployment rate ticked up from 5.2% to 5.3%, in line with forecasts, extending a full year of readings above 5%. The last time joblessness reached this level was in late 2016. Labor-force participation rate slipped 0.2 ppt to 70.3%, suggesting some workers are leaving the active job market.
Wage growth also cooled, with all-sector earnings up 0.4% qoq and 2.1% yoy, indicating reduced pressure on labor costs.
China RatingDog PMI Services falls to 52.6, export orders contract
China’s service sector expansion eased slightly in October, with the RatingDog PMI Services slipping from 52.9 to 52.6, in line with expectations. Composite PMI also moderated to 51.8 from 52.5. While domestic demand improved, weakness in overseas orders capped momentum, reflecting the impact of renewed global trade instability on China’s external-facing industries.
RatingDog founder Yao Yu said new export business “fell noticeably into contractionary territory” amid "increased instability in the global trade environment". However, total new orders still expanded as domestic demand strengthened. Business expectations remained high even though confidence edged slightly lower. Employment stayed in contraction, but the pace of job losses eased.
Price pressures were uneven. Input costs rose for an eighth consecutive month, reaching their highest level since October 2024. On the other hand, output prices slipped back into contraction, implying margin compression for service providers.
USD/CHF Mid-Day Outlook
Daily Pivots: (S1) 0.8078; (P) 0.8094; (R1) 0.8120; More…
Intraday bias in USD/CHF remains on the upside for 100% projection of 0.7828 to 0.8075 from 0.7872 at 0.8119. Break there will extend the corrective rally from 0.7828 to 138.2% projections at 0.8213. On the downside, break of 0.8066 minor support will suggest that deeper pullback might be underway, and turn bias to the downside for 55 4H EMA (now at 0.8025).
In the bigger picture, long term down trend from 1.0342 (2017 high) is still in progress. Next target is 100% projection of 1.0146 (2022 high) to 0.8332 from 0.9200 at 0.7382. In any case, outlook will stay bearish as long as 0.8332 support turned resistance holds (2023 low).
US ADP jobs rise 42K in October, large firms lead modest rebound
U.S. private-sector employment rose modestly in October, with ADP reporting a gain of 42k jobs, slightly above expectations of 32k. It was the first increase since July, suggesting some stabilization in hiring after months of softness. However, the pace of job creation remains well below levels seen earlier in the year, pointing to a labor market that is cooling gradually rather than collapsing.
Sector data showed 33k new service jobs and 9k in goods production. Large firms (+73k) drove most of the gains. Small (-10k) and medium-sized (-21k) companies continued to shed workers. Wage growth remained steady, with job-stayers up 4.5% yoy and job-changers up 6.7% yoy, both unchanged from September.
Overall, the data suggest hiring is stabilizing at lower levels, aligning with the Fed’s goal of cooling the economy without triggering widespread job losses.