Sample Category Title
Nikkei 225: Plummeted Towards a Key Inflection Support Zone at 49,370/48,450 for Potential Bullish Reversal
Key takeaways
- Nikkei 225 correction: The index fell 6.6% from its record high of 52,664, testing a key support zone at 49,370/48,450 that may trigger a short-term bullish reversal.
- Macro resilience: Japan’s Citigroup Economic Surprise Index rose to 16.8, indicating continued economic outperformance and reinforcing long-term bullish fundamentals.
- Technical setup: Oversold RSI and a bullish hammer candlestick near the 20-day moving average signal potential bullish momentum.
The Japan 225 CFD Index (a proxy of the Nikkei 225) has staged the expected rally and surpassed the highlighted short-term resistance zone of 50,860/51,030. It printed a new record peak of 52,664 on Tuesday, 5 November 2025, before it tumbled by 6.6% to print a current intraday low of 49,099 on Wednesday, 6 November 2025, at the time of writing.
Bearish animal spirits in the US stock market, driven by stretched valuations in several major US stocks with an Artificial Intelligence (AI) theme, such as Palantir Technologies and Advanced Micro Devices, triggered a negative feedback loop in the Japanese stock market despite sound fundamentals, and an announcement made on Tuesday, 4 November, by Japanese Prime Minister Takaichi that her administration will roll out a new proactive growth strategy by next summer.
Japan’s recent economic data is showing more positive surprises
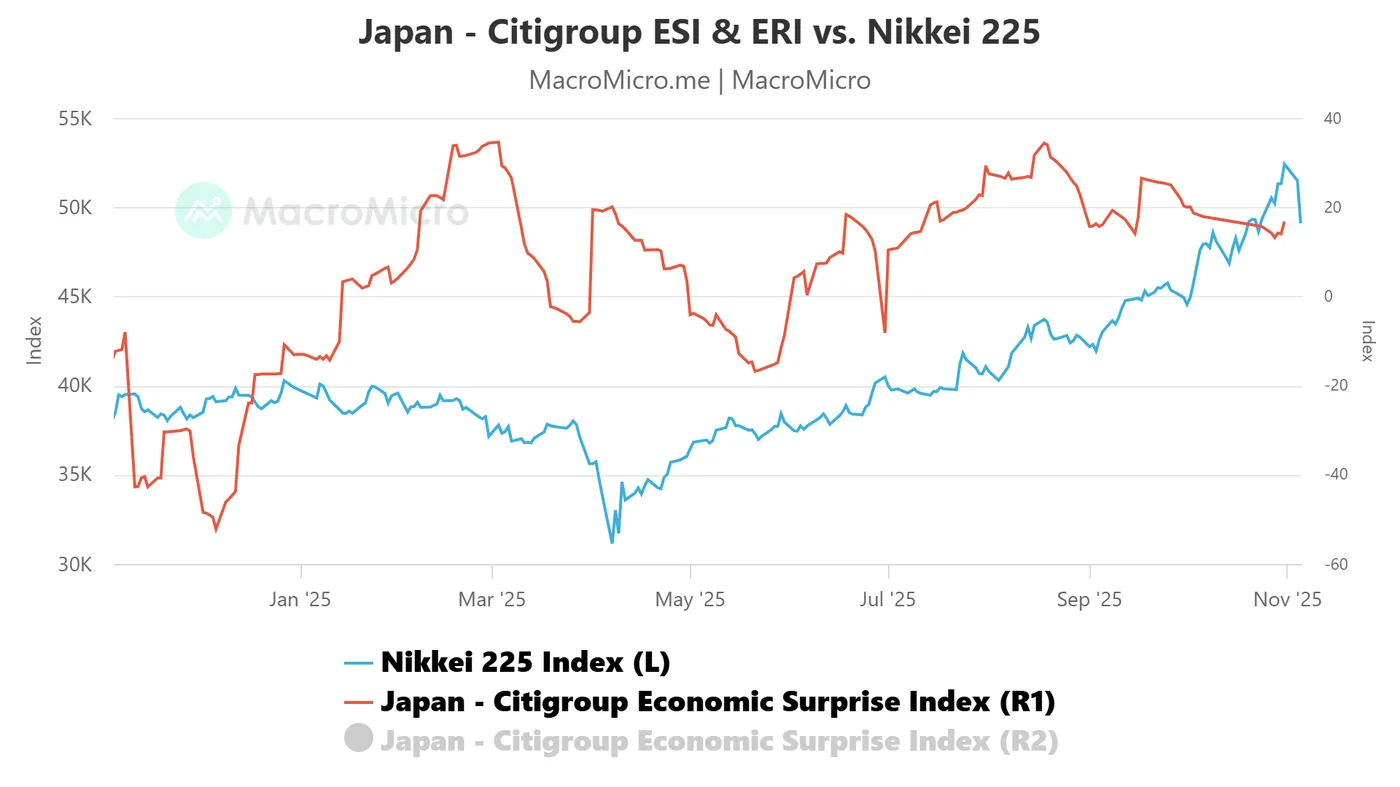
Fig. 1: Japan Citigroup Economic Surprise Index with Nikkei 225 as of 31 Oct 2025 (Source: MacroMicro)
The Citigroup Economic Surprise Index (ESI) for Japan has remained above the zero line since July 2025, indicating that Japan’s economic data continues to outperform market expectations. The ESI measures the gap between actual economic results and consensus forecasts, with positive readings signalling stronger-than-expected performance.
Recently, Japan’s ESI climbed to 16.8 on Friday, 31 October, up from 13.2 on 28 October, a positive trend that reinforces the ongoing medium- and long-term uptrend in the Nikkei 225 (see Fig. 1).
Next up, we will focus on the short-term (1 to 3 days) trajectory, key elements, and key levels to watch on the Japan 225 CFD Index from a technical analysis/momentum perspective.
Preferred trend bias (1-3 days) – Potential bullish reversal at 20-day moving average
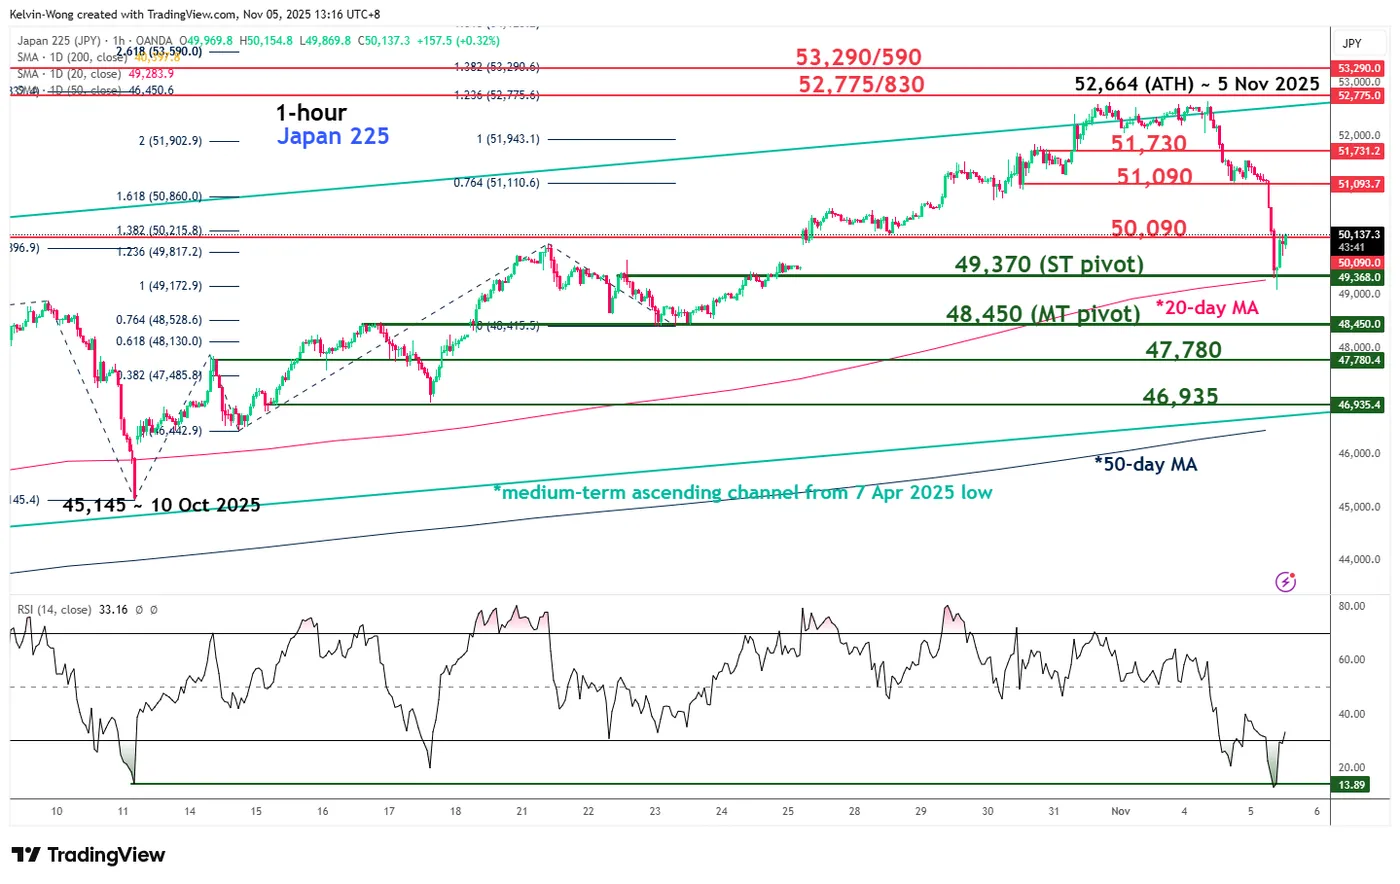
Fig. 2: Japan 225 CFD Index minor trend as of 5 Nov 2025 (Source: TradingView)
Bullish bias with 49,370 as key short-term pivotal support, and a clearance above 50,090 increases the probability of a minor bullish reversal towards the next intermediate resistances at 51,090 and 51,730 in the first step (see Fig. 2).
Key elements
- The price action of the Japan 225 CFD Index (a proxy of the Nikkei 225 futures) has formed an hourly bullish “Hammer” candlestick pattern after a retest on its upward-sloping 20-day moving average.
- The hourly RSI momentum indicator has reached a prior extreme oversold level of 13.9 seen on 10 October 2025, which led to the start of the prior bullish impulsive up move sequence that rallied by 16.6% (high to low) from the 10 October 2025 low to the 4 November 2025 current all-time high of 52,664.
Alternative trend bias (1 to 3 days)
Failure to hold at the 49,370 key short-term support invalidates the bullish reversal scenario on the Japan 225 CFD Index to trigger a deeper corrective decline towards the 48,450 key medium-term pivotal support.
Overheated, Overhyped – But Probably Not Over
Market mood got hammered yesterday — for all the reasons we’ve been citing over and over: overstretched tech valuations, an increasingly narrow rally, and the circularity concerns around Big Tech that are reviving dot-com bubble comparisons. Add to that the fading dovish hopes for a December rate cut from the Federal Reserve (Fed), signs of a weakening US economy, lingering inflation risks and the thickening fog as official US data remains elusive — and you’ve got a recipe for unease.
Yes, but the sour cocktail of all these arguments didn’t prevent major US indices from rallying to uncharted territories since April, and there is no certainty that yesterday’s selloff will be the beginning of a broader correction wiping 10–20% off valuations in the coming weeks. It’s a possibility — one that many investors and large-company CEOs expect — but it’s not a preset course.
Counterarguments exist: earnings are better than expected; the Fed might not cut by another 25bp but could end QT. The latter would bring extra liquidity to markets. Recent data also shows the Fed has been adding liquidity via reverse repo operations and the People’s Bank of China (PBoC) is back to purchasing bonds to support growth. Meanwhile, AI deals keep coming in — Nvidia is reportedly expanding partnerships beyond the US, including a recent one with Deutsche Telekom — and the company hasn’t said its last word this earnings season.
So yes, the latest moves and the bearish reaction to strong Big Tech earnings call for caution. The VIX index is rising, another sign that market stress is ticking higher. The latest 13F filings also showed that “Big Short” investor Michael Burry is betting against AI champions — about 66% of his portfolio is reportedly in Palantir puts and another 13.5% in Nvidia puts. But hopefully, all this doesn’t mean the apocalypse is upon us! Over the past 15 years, the S&P500 rebounded higher after a 10-20% selloff.
Yesterday, the S&P 500 and Nasdaq fell yesterday after Palantir’s record and better-than-expected results failed to attract fresh buyers, triggering fears that valuations may have gone too far — with price-to-sales ratios for buzzy tech names getting stretched. There’s no doubt some of the Magnificent 7 stocks don’t deserve their lofty valuations (I’m looking at you, Tesla). Palantir, for instance, has a P/E ratio near 500, which is insane. Thankfully, that’s not the case for the rest of Big Tech. The others trade at relatively high, but not extreme, multiples — the average P/E for the Magnificent 7 is now above 30, versus around 20 for the S&P 493. Google’s P/E is 32, Microsoft’s 36, and Nvidia’s 60 — but that will likely moderate once it reports earnings. Jensen Huang already hinted that up to $500 billion in revenue could flow in from Blackwell and Rubin chip sales between this year and next. A correction would be healthy given how fast the market has risen in the past three years – and since April, but there might not be a dot-com-style crash when companies are printing such strong growth and profits. Smaller, buzzy names could get hit hard, yes — but the tech behemoths have means to weather a selloff.
Now, coming back to earnings, AMD also faced an unpleasant negative reaction despite strong — and stronger-than-expected — results. Revenue rose 32% to $7.69 bn, beating estimates (~$7.41 bn). The company guided for Q3 sales around $9.9 bn. Nevertheless, the share price fell about 3.7% in after-hours trading. The good news is that Nasdaq futures are sold less severely this morning, suggesting downside pressure could ease. But it may take more than a few earnings beats to bring the bulls back.
In metals and currencies, gold interestingly isn’t picking up the risk-off trades; it’s acting like a risk-on asset, falling in tandem with equities. The yellow metal struggles to hold ground near the $4,000 per ounce mark — it probably rose too far, too fast, to attract risk-averse investors. Bitcoin is also failing to play safe haven, testing the $100K level to the downside.
The US dollar, on the other hand, is strengthening against most majors, acting as a safe haven after months of heavy selling. The EURUSD slipped below 1.15 yesterday, Cable is preparing to test the 1.30 psychological support ahead of Thursday’s Bank of England (BoE) meeting, while the AUDUSD fell back below 0.65 despite the Reserve Bank of Australia’s (RBA) cautious tone this week, as it refrained from cutting rates and flagged lingering inflation risks. None of this is surprising — the dollar had been heavily shorted this year, so the rebound looks healthy and justified.
Among G10 currencies, the Japanese yen stood out as Japan’s Finance Minister said he was not enchanted by the yen’s rapid depreciation — a comment that likely prompted speculative shorts to close positions to avoid getting caught in a reversal. Still, given the dollar’s strong momentum and the dovish shift in BoJ expectations, the USDJPY will likely continue to attract brave dip buyers.
Today, services PMI figures will be in focus, along with earnings from McDonald’s, Qualcomm, and Arm Holdings. Let’s see how they perform — and how investors react!
US ADP Jobs Report Takes Centre Stage amid BLS Delay
In focus today
In the US, the October ADP private sector employment report is due for release this afternoon. The release is likely to get more attention than usual due to the delays to the BLS's monthly jobs report. ADP's early estimate based on weekly employment data until 11 October indicated small, but positive employment gains (+14k) after a negative reading in September (-32k). The ISM Services index for October will also be released. US Treasury will publish additional details of its quarterly refunding announcement (QRA), we expect the Treasury to maintain its forward guidance of unchanged coupon auction sizes 'for the next several quarters'.
In Sweden, the Riksbank will announce its rate decision. We expect the policy rate to stay unchanged at 1.75%, in line with market expectations and the Riksbank's guidance. As the meeting is also a "smaller" one without forecast updates, there are few reasons to expect any shift from the Riksbank.
In the euro area, we will receive the final services and composite PMI for October. The services PMIs surprised strongly on the upside in the flash release to 52.6. We expect the composite PMI to confirm the flash release of 52.2 as the final manufacturing print released on Monday was similar to the flash release of 50.0. Read more in Euro Area Macro Monitor - Better than expected growth, 5 November.
In Poland, the National Bank of Poland (NBP) is set to announce its rate decision. While the consensus view is another cut to 4.25%, we expect the NBP to hold rates steady. Recent communication from the Board has been mixed, with some members calling for a near-term pause in rate adjustments. Over the past years, the NBP has a track record of surprising markets, suggesting that consensus expectations do not necessarily carry much weight in their internal discussions.
In Japan, wage data for September is released overnight. A pick-up in wage growth is a prerequisite for a Bank of Japan hike following a few disappointing revisions lower of the otherwise promising wage data over the summer.
Economic and market news
What happened overnight
In the US, Democrats secured major victories in the first significant elections of Trump's second term, winning governor races in Virginia and New Jersey and the New York City mayoral race. Zohran Mamdani's victory in the New York City mayoral race marks a significant shift in political sentiment, with his campaign focused on addressing affordability concerns resonating strongly with voters. These wins, coupled with California's approval of a Democratic-leaning redistricting plan, offer momentum to the party ahead of next year's mid-term elections.
In US-China relations, China's State Council tariff commission announced the suspension of the additional 24% tariff on US goods for one year, while retaining a 10% levy. Additionally, tariffs of up to 15% on certain US agricultural goods, including soybeans, will be lifted from 10 November. The decision follows the consensus reached in the China-US economic and trade consultations last week.
In Japan, the Bank of Japan's September minutes revealed growing support for resuming rate hikes, as concerns over the potential impact of higher US tariffs on Japan's fragile economy begin to ease. While the board kept rates steady at 0.50% during both its September and October meetings, some members now favour a gradual approach to hiking as domestic economic conditions show signs of improvement.
What happened yesterday
In Denmark, the Danish central bank made no FX interventions in October, as revealed in yesterday's balance sheet statement. This, combined with easing pressure on the DKK, has reduced the risk of a rate hike by the central bank.
Equities: US equities sold off sharply yesterday, driven lower by a retreat in AI-related tech. The S&P 500 fell 1% and the Nasdaq 2%. While it may sound like a major pullback, it merely takes the Nasdaq back to levels seen about a week and a half ago. The selloff was concentrated in tech - primarily hardware and semiconductors - with Micron -7%, Intel -6%, and Nvidia -4%, while hyperscalers fared much better. As a result, we are also seeing significant pullbacks this morning in Asia, the world's key hardware region, with the KOSPI and Nikkei down 3-4%.
The trigger: interestingly, media reports attributed the weakness to "Wall Street CEOs" warning of a correction in the sector due to valuations at a financial summit in Hong Kong. We find that explanation unconvincing. Stretched valuations in tech are hardly new, and yesterday's selloff was more concentrated in lower-valued hardware names than in hyperscalers. Rather, this appears to reflect stretched positioning and a sharp rally during earnings season. It is also worth noting that this was not a macro-driven selloff; banks actually closed higher, and the Dow Jones ended only 0.5% lower.
FI and FX: Amid sour risk sentiment, the JPY and the USD gained yesterday, where especially the Scandies struggled. EUR/USD fell below 1.15. EUR/SEK rose above 11.00 yesterday ahead of the Riksbank meeting today. Bond yields fell slightly across the curve and regions yesterday.
EUR/USD Daily Outlook
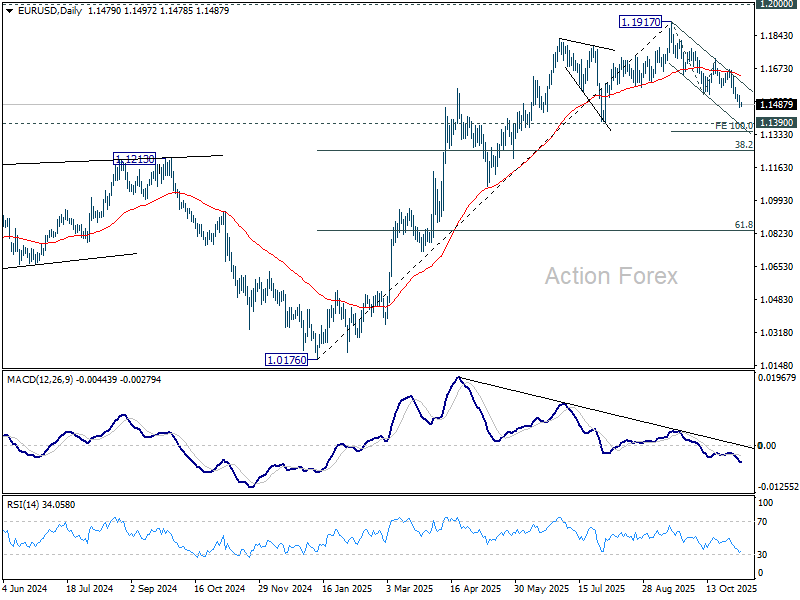
Daily Pivots: (S1) 1.1459; (P) 1.1496; (R1) 1.1520; More…
Intraday bias in EUR/USD remains on the downside for 100% projection of 1.1917 to 1.1540 from 1.1727 at 1.1350. Decisive break there would prompt downside acceleration to 38.2% retracement of 1.0176 to 1.1917 at 1.1252. On the upside, above 1.1540 minor resistance will turn bias neutral and bring consolidations first, before staging another fall.
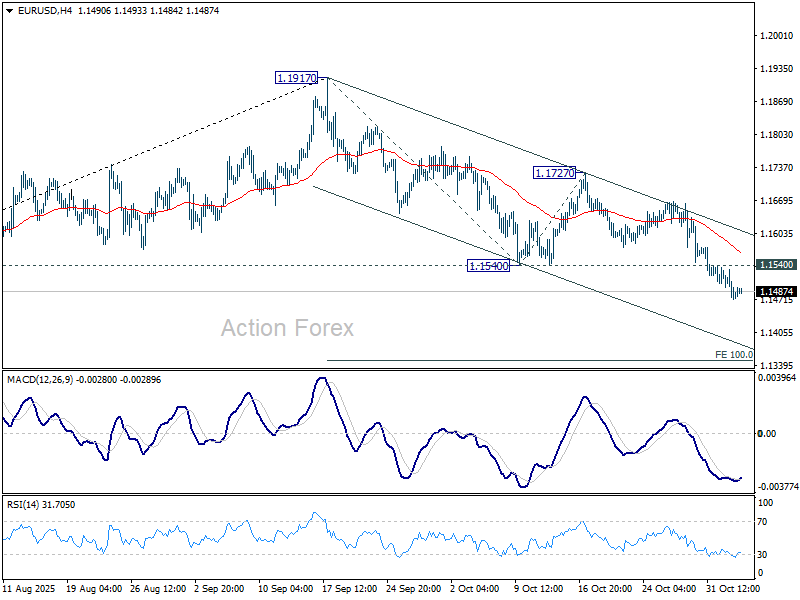
In the bigger picture, considering bearish divergence condition in D MACD, a medium term top is likely in place at 1.1917, just ahead of 1.2 key psychological level. As long as 55 W EMA (now at 1.1306) holds, the up trend from 0.9534 (2022 low) is still expected to continue. Decisive break of 1.2000 will carry larger bullish implications. However, sustained trading below 55 W EMA will argue that rise from 0.9534 has completed as a three wave corrective bounce, and keep outlook bearish.
USD/JPY Daily Outlook
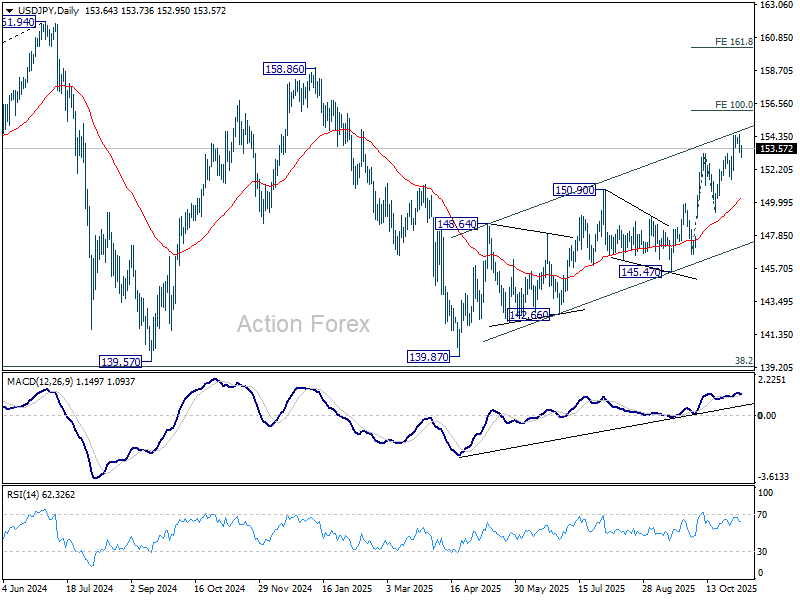
Daily Pivots: (S1) 153.99; (P) 154.14; (R1) 154.38; More...
Intraday bias in USD/JPY stays neutral and more consolidations would be seen below 154.47. Further rally is expected as long as 151.52 support holds. Above 154.47 will resume larger rise from 139.87 to 100% projection of 146.58 to 153.26 from 149.37 at 156.05. Break there will pave the way to 158.85 key structural resistance.
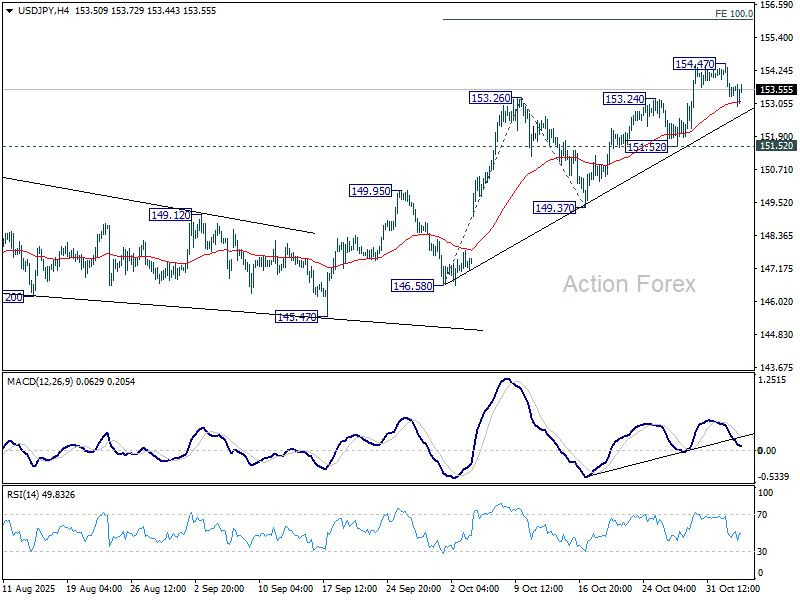
In the bigger picture, current development suggests that corrective pattern from 161.94 (2024 high) has completed with three waves at 139.87. Larger up trend from 102.58 (2021 low) could be ready to resume through 161.94 high. On the downside, break of 145.47 support will dampen this bullish view and extend the corrective pattern with another falling leg.
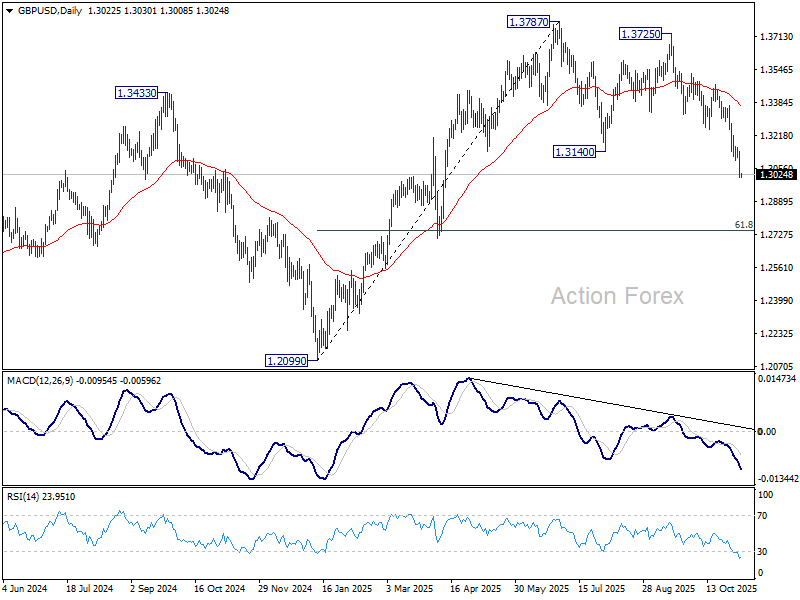
GBP/USD Daily Outlook
Daily Pivots: (S1) 1.2972; (P) 1.3059; (R1) 1.3108; More...
Intraday bias in GBP/USD stays on the downside, and fall from 1.3787 should now target 61.8% retracement of 1.2099 to 1.3787 at 1.2744 next. Sustained break there will pave the way to 1.2099 support next. On the upside, above 1.3095 minor resistance will turn intraday bias neutral first. But risk will stay on the downside as long as 1.3247 support turned resistance holds, in case of recovery.
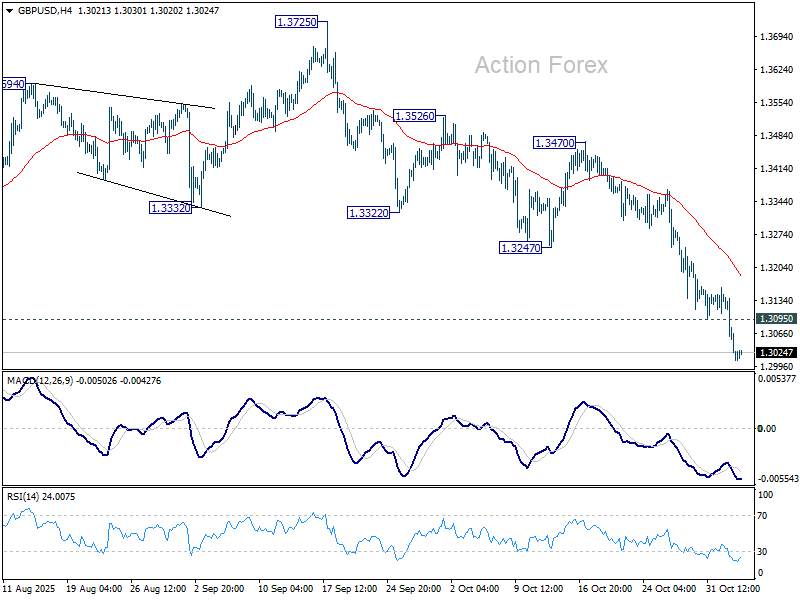
In the bigger picture, the break of 55 W EMA (now at 1.3185) is taken as the first sign that corrective rise from 1.0351 (2022 low) has completed. Further break of 1.2099 support should confirm this bearish case. Meanwhile, in case of another rise, strong resistance should emerge below 1.4248 (2021 high) to cap upside to preserve the long term down trend.
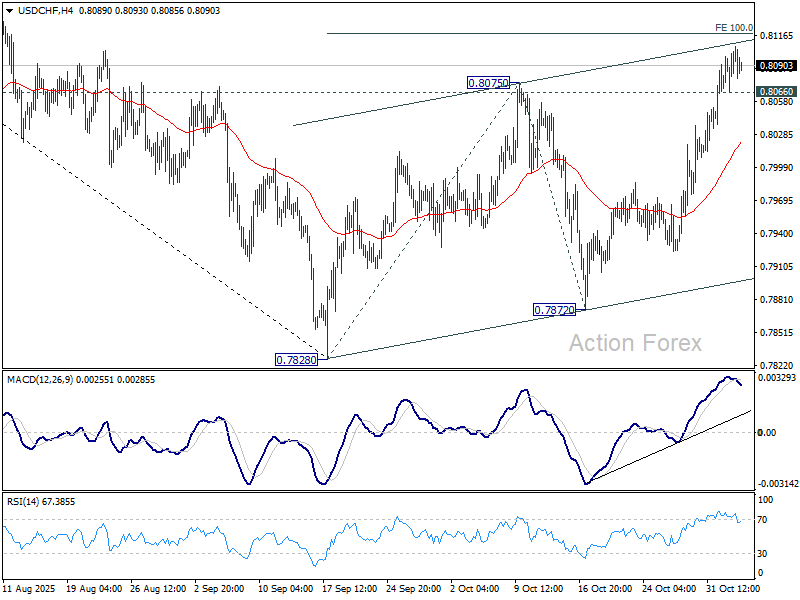
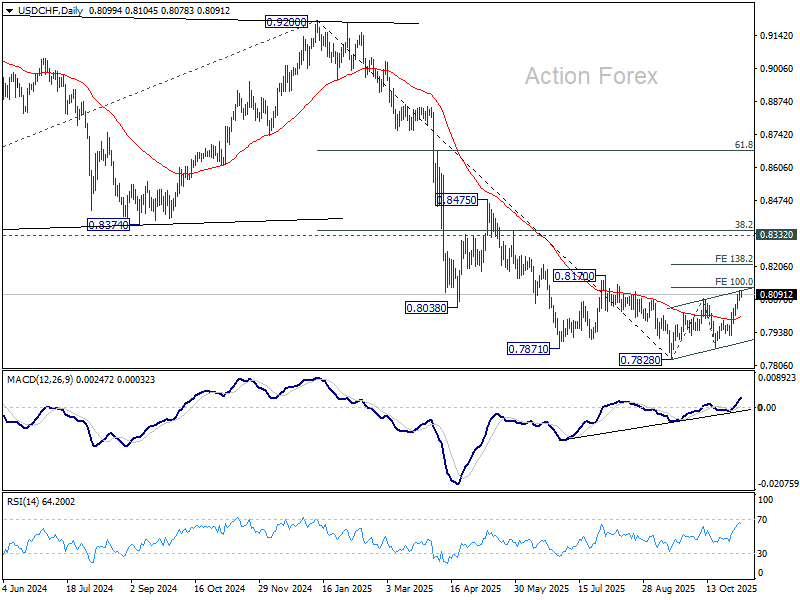
USD/CHF Daily Outlook
Daily Pivots: (S1) 0.8078; (P) 0.8094; (R1) 0.8120; More…
There is no clear sign of topping in USD/CHF yet despite loss of momentum as seen in 4H MACD> Further rise would be seen to 100% projection of 0.7828 to 0.8075 from 0.7872 at 0.8119. Break there will extend the corrective rally from 0.7828 to 138.2% projections at 0.8213. Nevertheless, break of 0.8066 will turn bias to the downside for 55 4H EMA (now at 0.8022).
In the bigger picture, long term down trend from 1.0342 (2017 high) is still in progress. Next target is 100% projection of 1.0146 (2022 high) to 0.8332 from 0.9200 at 0.7382. In any case, outlook will stay bearish as long as 0.8332 support turned resistance holds (2023 low).
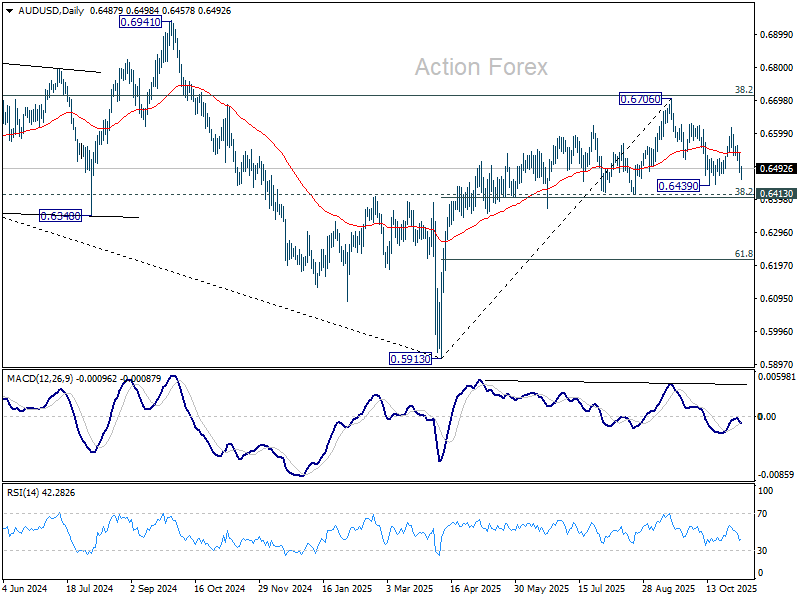
AUD/USD Daily Report
Daily Pivots: (S1) 0.6468; (P) 0.6504; (R1) 0.6528; More...
Intraday bias in AUD/USD remains on the downside. Fall from 0.6616 is the third leg of the pattern from 0.6706, and should target 0.6413 cluster support (38.2% retracement of 0.5913 to 0.6706 at 0.6403). Strong support should be seen from 0.6403/13 to bring rebound to extend range trading. . However, sustained trading below there will carry larger bearish implications. On the upside, above 0.6516 minor resistance will turn bias neutral first.
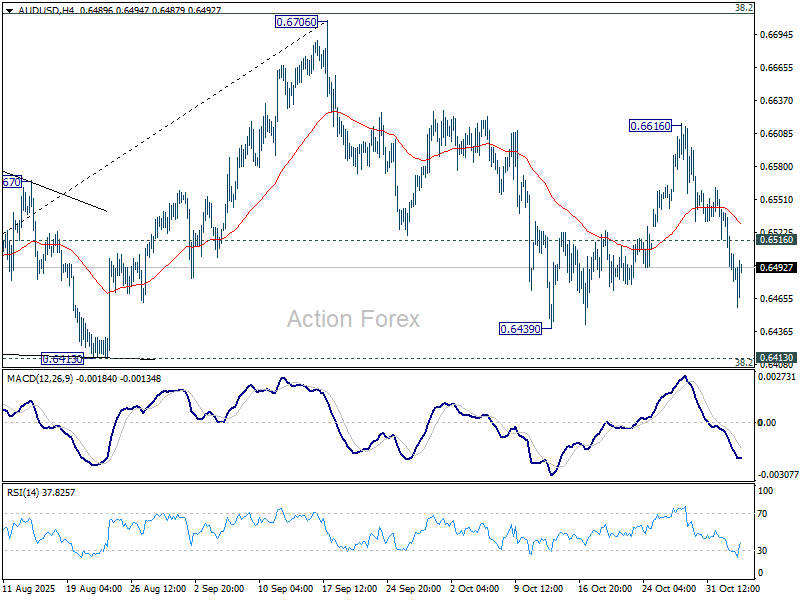
In the bigger picture, there is no clear sign that down trend from 0.8006 (2021 high) has completed. Rebound from 0.5913 is seen as a corrective move. Outlook will remain bearish as long as 38.2% retracement of 0.8006 to 0.5913 at 0.6713 holds. Break of 0.6413 support will suggest rejection by 0.6713 and solidify this bearish case. Nevertheless, considering bullish convergence condition in W MACD, sustained break of 0.6713 will be a strong sign of bullish trend reversal, and pave the way to 0.6941 structural resistance for confirmation.
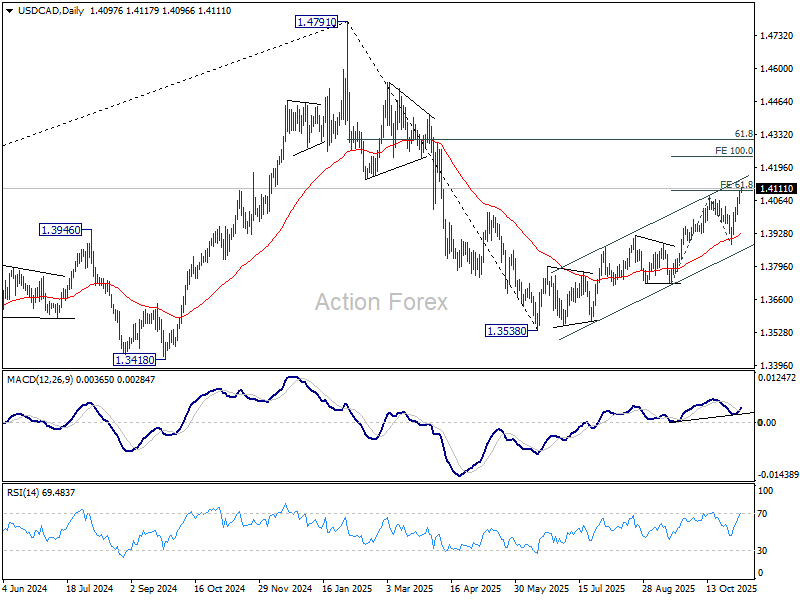
USD/CAD Daily Outlook
Daily Pivots: (S1) 1.4070; (P) 1.4089; (R1) 1.4124; More...
USD/CAD's break of 1.4078 confirms resumption of whole rally from 1.3538. Intraday bias is back on the upside for 100% projection of 1.3725 to 1.4078 from 1.3886 at 1.4239. On the downside, below 1.4052 minor support will turn bias neutral again first. But risk will remain on the upside as long as 1.3887 support holds, in case of retreat.
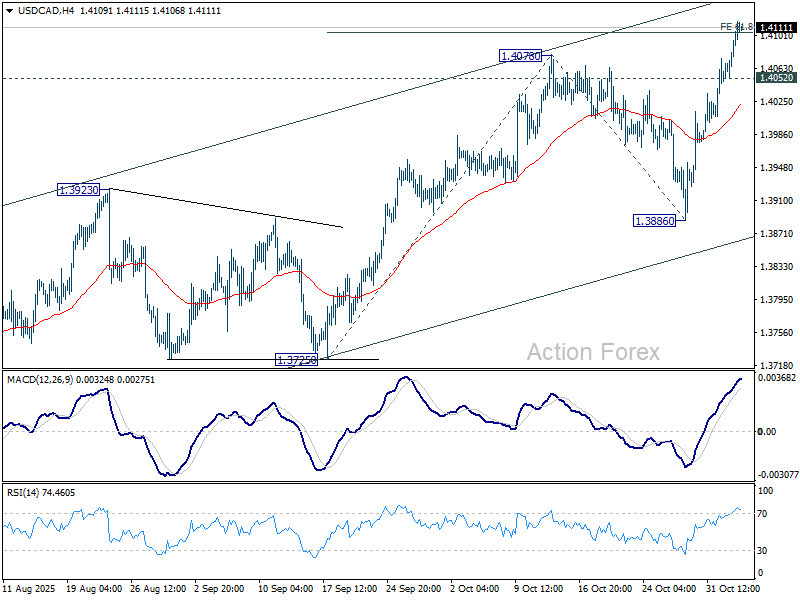
In the bigger picture, price actions from 1.4791 medium term top is likely just unfolding as a correction to up trend from 1.2005 (2021 low). Based on current momentum, rise from 1.3538 is the second leg, and a third leg should follow before up trend resumption. That is, range trading is set to extend for the medium term. For now, this will remain the favored case as long as 1.3725 support holds. However, firm break of 1.3725 will revive the case that fall from 1.4791 is indeed a larger scale correction.
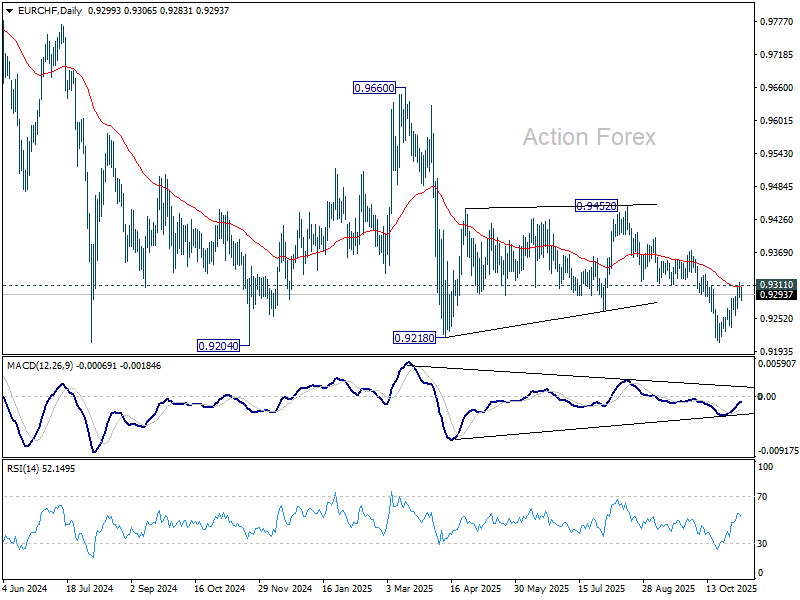
EUR/CHF Daily Outlook
Daily Pivots: (S1) 0.9291; (P) 0.9304; (R1) 0.9318; More....
Intraday bias in EUR/CHF remains neutral for the moment. On the upside, decisive break of 0.9311 support turned resistance and 55 D EMA (now at 0.9307) will suggest that whole fall from 0.9660 has completed as a corrective move. Further rise should then be seen to 0.9452 resistance for confirmation. On the downside, though, below 0.9257 minor support will retain near term bearishness and bring deeper fall to retest 0.9204/8 support zone. Firm break there will resume larger down trend.
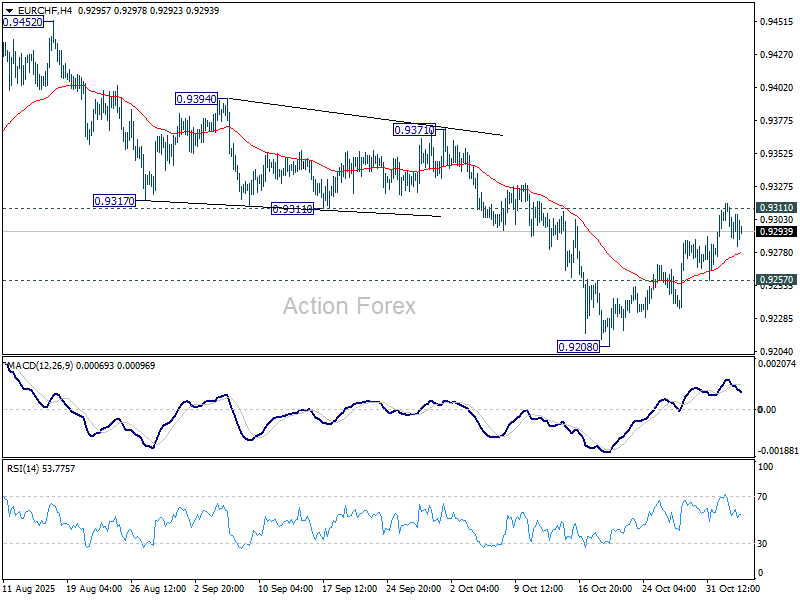
In the bigger picture, outlook remains bearish with EUR/CHF staying well inside long term falling channel after multiple rejection by 55 W EMA (now at 0.9386). Firm break of 0.9204 will resume the whole down trend from 1.2004 (2018 high). Next target is 61.8% projection of 1.1149 to 0.9407 from 0.9928 at 0.8851. Break of 0.9452 resistance is needed to be the first sign of medium term bottoming.