Sample Category Title
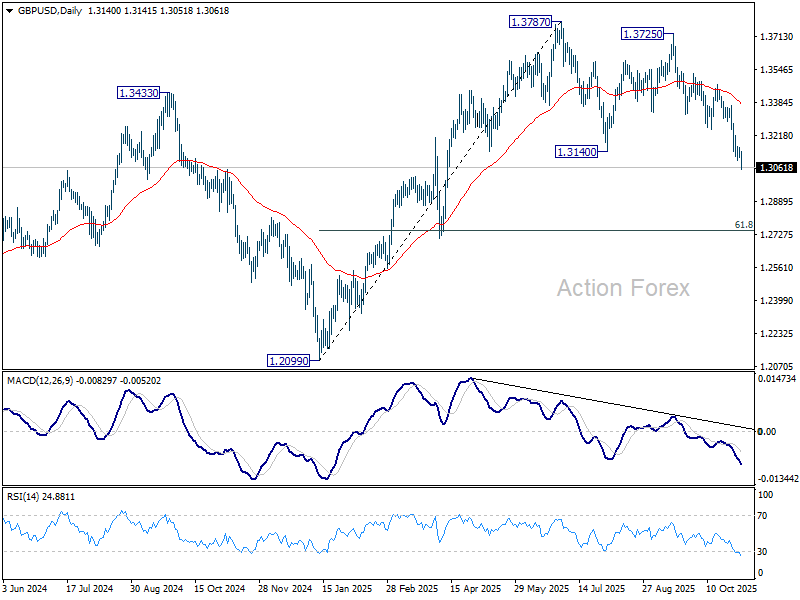
GBP/USD Mid-Day Outlook
Daily Pivots: (S1) 1.3111; (P) 1.3137; (R1) 1.3164; More...
Intraday bias in GBP/USD remains on the downside for the moment. Current fall from 1.3787 should now target 61.8% retracement of 1.2099 to 1.3787 at 1.2744 next. Sustained break there will pave the way to 1.2099 support next. On the upside, above 1.3161 minor resistance will turn intraday bias neutral first. But risk will stay on the downside as long as 1.3247 support turned resistance holds, in case of recovery.
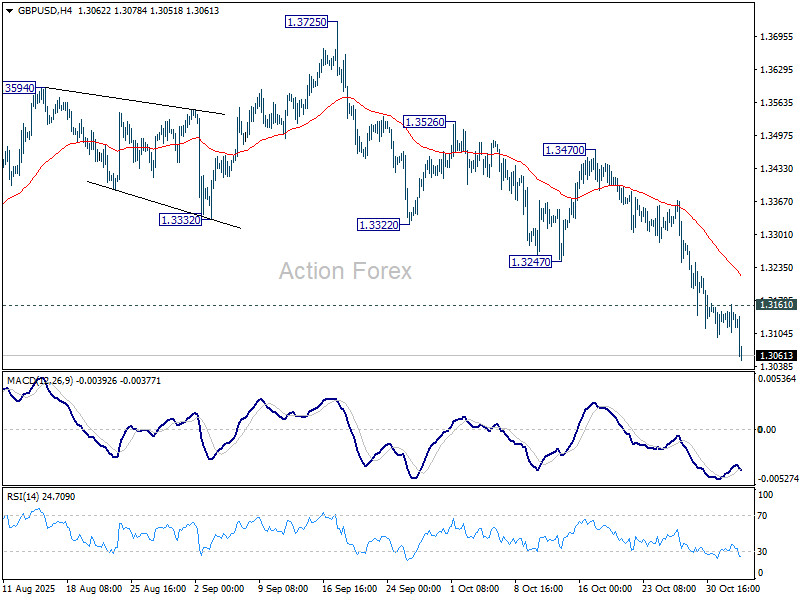
In the bigger picture, rise from 1.0351 (2022 low) is still seen as a corrective move. Sustained trading below 55 W EMA (now at 1.3185) will argue that a medium term top has already formed and bring deeper fall back to 1.2099. Firm break there will confirm bearish reversal. In case of another rise, strong resistance should emerge below 1.4248 (2021 high) to cap upside.
Risk-Off Tone Lifts Yen, Dollar; Kiwi Soft Before Jobs Report
Global markets traded with a mild risk-off tone today as investors favored defensive plays. With no major data releases scheduled, sentiment rather than fundamentals set the tone, pushing the Japanese Yen to the top of the performance board while the Australian and New Zealand Dollars lagged.
Yen’s strength was also supported by another round of verbal intervention from Japanese authorities. Finance Minister Satsuki Katayama reiterated her “strong sense of urgency” over recent currency moves, warning against excessive speculation. Still, USD/JPY’s pullback was modest, as most analysts — including Goldman Sachs and Bank of America — agreed that 155 is not a trigger level for direct action. Tokyo appears focused on smoothing volatility rather than defending any particular line in the sand.
Meanwhile, the Dollar retained its underlying bid as markets continued to scale back expectations for a December Fed rate cut. A string of firm comments from policymakers has kept investors wary of prematurely pricing in easing. That backdrop makes it difficult for Japan to counter Dollar strength through intervention alone — a view echoed by traders who believe officials are more likely to talk than act for now.
In contrast, Aussie and Kiwi remained under pressure amid the softer risk tone. The Kiwi was weaker still, with traders wary ahead of key New Zealand labor data that could validate expectations for another RBNZ rate cut later this month.
Across the week so far, Yen is currently the top performer, followed by Dollar and Euro. Kiwi, Aussie, and Pound are at the bottom. Euro and Franc are mid-pack.
In Europe, at the time of writing, FTSE is down -0.44%. DAX is down -1.21%. CAC is down -1.12%. UK 10-year yield is down -0.019 at 4.423. Germany 10-year yield is down -0.011 at 2.658. Earlier in Asia, Nikkei fell -1.74%. Hong Kong HSI fell -0.79%. China Shanghai SSE fell -0.41%. Singapore Strait Times fell -0.49%. Japan 10-year JGB yield rose 0.018 to 1.676.
SNB's Tschudin: No need for negative rates, comfortable with outlook
The SNB appears comfortable maintaining its stance after board member Petra Tschudin said current interest rates are appropriate given Switzerland’s inflation outlook. In an interview with TeleZueri, she noted that the SNB’s forecasts place inflation between 0% and 2% over the medium term, consistent with its definition of price stability.
“From that perspective, interest rates are where they should be,” she said, adding that the central bank’s stance remains well calibrated to current conditions. Tschudin’s remarks were interpreted as a signal that the SNB will keep its policy rate at 0% for the foreseeable future.
Tschudin acknowledged that global conditions are shifting quickly but said there is no justification for reintroducing negative rates. “The central bank would only deploy negative rates if necessary,” she said, “but with the current inflation forecasts there is no need.”
Elsewhere, Chairman Martin Schlegel reiterated that Swiss inflation should edge slightly higher in the next few quarters, though global growth remains pressured by U.S. tariff actions.
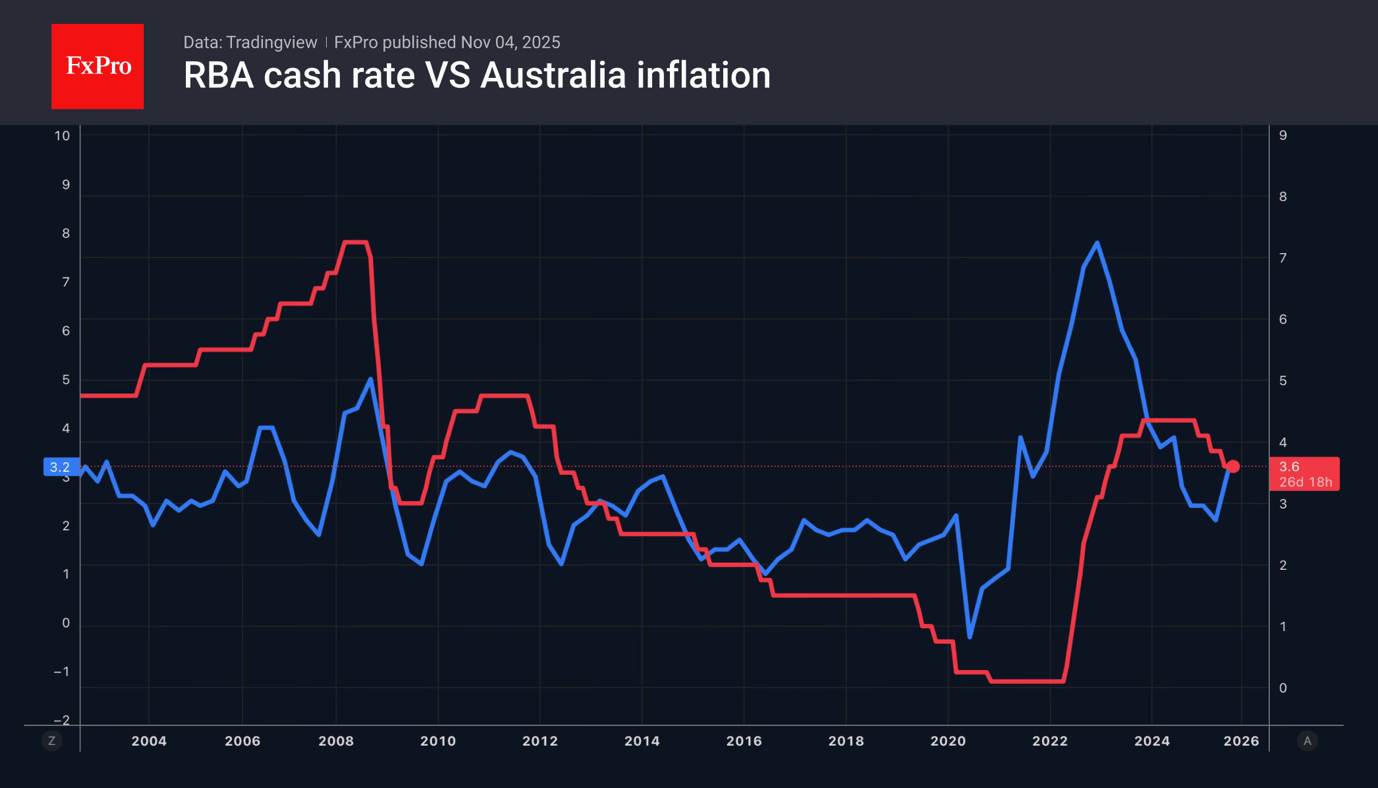
RBA holds at 3.60%, upgrades inflation path, sees only one cut in 2026
The RBA kept the cash rate unchanged at 3.60%, a move widely expected by markets and decided unanimously by the Board. In the statement, policymakers said the decision reflected a balance between inflation risks and economic resilience, noting that Q3 CPI was "materially higher" than expected and that there was “recent evidence of more persistent inflation.” Together with signs of recovering private demand and a labor market that remains “a little tight,” the Bank judged that current settings remain appropriate.
The updated economic projections painted a picture of stickier inflation but slightly better near-term growth. Average GDP growth for 2025 was upgraded from 1.6% to 1.8%, while the 2026 projection was trimmed from 2.1% to 1.9%, and 2027 was kept unchanged at 2.0%.
Headline inflation forecasts were lifted across the board — from 3.0% to 3.3% for the end of 2025, 2.9% to 3.2% for 2026, and 2.5% to 2.6% for 2027 — reflecting persistent price pressures in both goods and services.
Underlying inflation was also revised higher. The trimmed mean CPI forecast jumped from 2.6% to 3.2% by the end of 2025, while the 2026 estimate edged up from 2.6% to 2.7%, and 2027 from 2.5% to 2.6%.
These upward revisions highlight the Bank’s view that inflation will take longer to return sustainably to target.
Meanwhile, policy-rate assumptions in the central scenario indicate no further rate cuts in 2025, followed by just over one reduction next year, lowering the cash rate to around 3.3% by the end of 2026, where it is expected to remain through 2027.
Japan's PMI manufacturing finalized at 48.2, but sentiment shows improvement
Japan’s manufacturing sector contracted again in October, with the final S&P Global PMI edging down to 48.2 from 48.5 in September. According to S&P Global’s Pollyanna De Lima, demand softness — particularly in the automotive and semiconductor sectors — triggered the sharpest fall in new orders since early 2024, while exports to Asia, Europe, and the U.S. continued to decline.
Manufacturers also faced rising cost pressures, as higher input costs squeezed margins even as demand waned. To offset these pressures, many firms lifted selling prices despite intense competition for new business.
Still, sentiment showed some improvement. The decline in production was relatively contained, and many firms expressed greater optimism about future output. Hopes for successful new product launches and expectations that the impact of U.S. tariffs will eventually fade helped boost confidence.
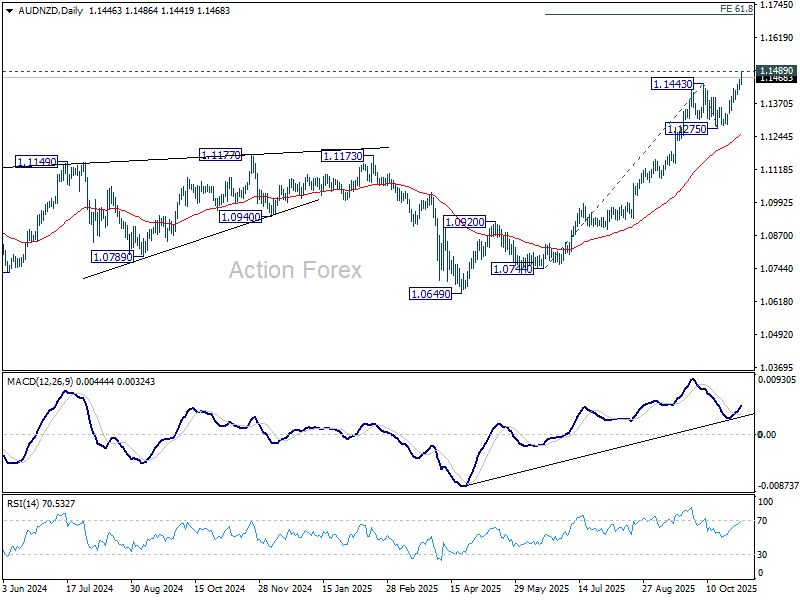
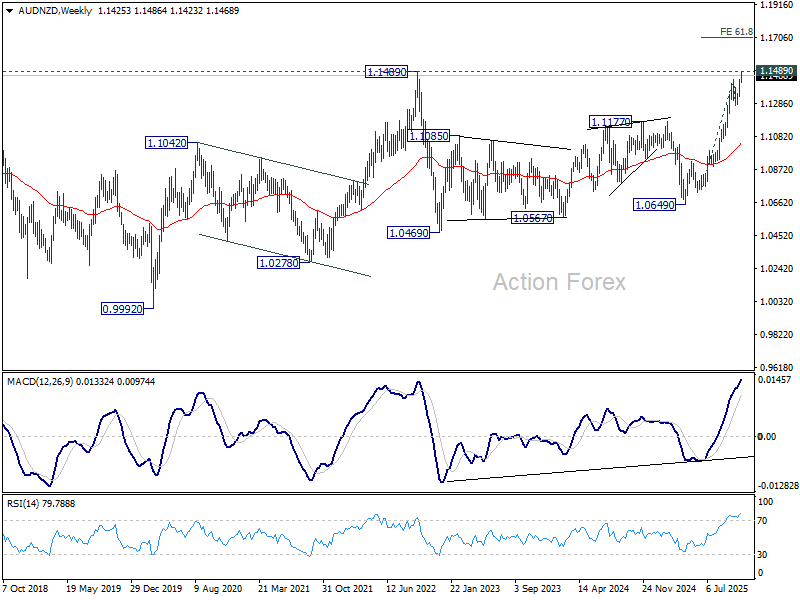
Kiwi slumps ahead of Q3 jobs data, AUD/NZD tests 2022 high
New Zealand Dollar is under broad pressure today, partly as risk sentiment turned mildly sour in Asian trade and extended into the European morning. The move reflected a combination of modest risk aversion and steady cross-selling against Australian Dollar, which found relative support following the RBA’s policy decision earlier in the day.
Even though Aussie was weighed down by the softer risk tone, it held firm against Kiwi after the RBA left the cash rate unchanged and signaled no further rate cuts this year, and likely only one more in 2026. In contrast, the OIS market continues to fully price a 25-basis-point cut by the RBNZ at its next meeting on November 26, with around a 50% chance of one final cut by mid-2026.
This policy divergence makes Wednesday’s New Zealand labor market report a potential flashpoint for further moves. Consensus forecasts point to only 0.1% employment growth in Q3 and an unemployment rate rising to 5.3%. Any downside surprise could tip the economy into two consecutive cycle of job losses, reinforcing, which would solidify the case for additional RBNZ rate cuts next year.
Technically, AUD/NZD is testing the 1.1489 resistance, its highest level since 2022. A decisive break above this zone would confirm bullish continuation and open the way toward the 61.8% projection of 1.0744 to 1.1443 from 1.1275 at 1.1707.
GBP/USD Mid-Day Outlook
Daily Pivots: (S1) 1.3111; (P) 1.3137; (R1) 1.3164; More...
Intraday bias in GBP/USD remains on the downside for the moment. Current fall from 1.3787 should now target 61.8% retracement of 1.2099 to 1.3787 at 1.2744 next. Sustained break there will pave the way to 1.2099 support next. On the upside, above 1.3161 minor resistance will turn intraday bias neutral first. But risk will stay on the downside as long as 1.3247 support turned resistance holds, in case of recovery.
In the bigger picture, rise from 1.0351 (2022 low) is still seen as a corrective move. Sustained trading below 55 W EMA (now at 1.3185) will argue that a medium term top has already formed and bring deeper fall back to 1.2099. Firm break there will confirm bearish reversal. In case of another rise, strong resistance should emerge below 1.4248 (2021 high) to cap upside.
Euro Holds on by a Thread
- The US is poised for a record shutdown.
- Weak PMI data halted the dollar.
- Rumours of intervention strengthened the yen.
- Slowing inflation weakened the franc.
The US dollar remained resilient despite a shutdown and was not deterred by disappointing statistics. The government shutdown is set to become the longest in history. The Polymarket and Kalshi prediction markets give a 52% chance that the executive branch will remain out of action until mid-November. Jerome Powell argued that the shutdown is forcing the Fed to be cautious. The longer it lasts, the lower the chances of a December rate cut, which works in favour of the dollar.
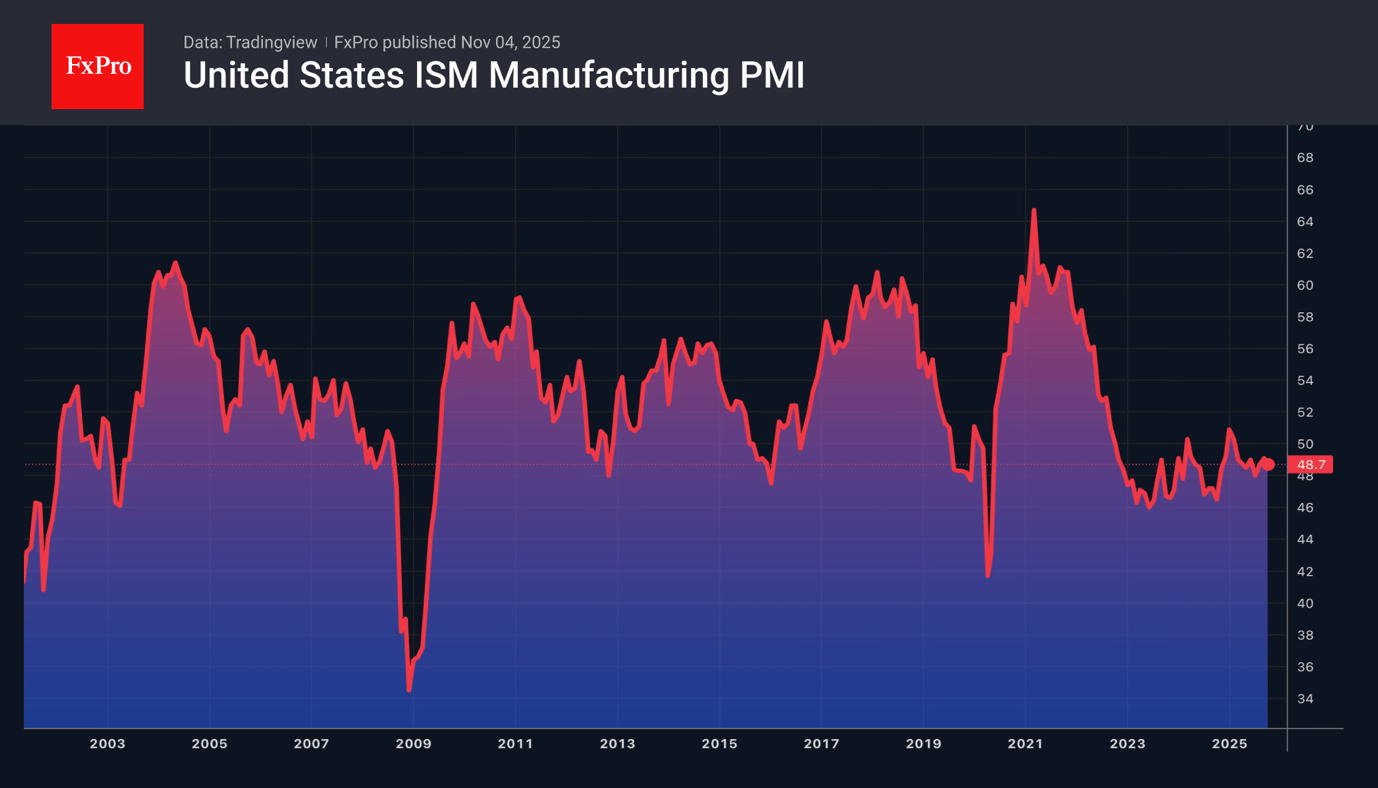
The ISM PMI slowed from 49.1 to 48.7 in October. The indicator has been below 50 for eight months, signalling a decline in the sector. The prices slowed compared to September, while employment has been in a contractionary territory since January. The dynamics of the indicators point to a cooling economy and support the idea of a loosening of the Fed’s monetary policy at the end of the year. As a result, EURUSD has found its footing.
The euro was supported by the intention of the Socialists in France to give the government more time to draw up an acceptable budget. Previously, the party had intended to dismiss the prime minister.
The Reserve Bank of Australia’s decision to leave the key rate at 3.6% did not help the AUD. It was taken unanimously by nine members of the Council, citing the continuing risks of accelerating inflation. At the same time, the phrase about still tight monetary policy sent AUDUSD into shock. Before the RBA’s October meeting, several major banks, including Goldman Sachs and the Commonwealth Bank of Australia, claimed that the cycle of policy easing was over. The futures market expected a cut by May next year. If the central bank does so earlier, the Aussie risks continuing its descent.
As USDJPY approaches the 155 level, investors’ nerves are frayed. They are taking profits on fears of currency intervention. Greed is giving way to fear, causing the pair to retreat. Traders are not encouraged even by statements from Goldman Sachs and Bank of America that the 155 mark is not a red line.
The slowdown in consumer prices in Switzerland to 0.1% has revived rumours of the SNB returning to negative rates and put downward pressure on the franc.
SNB’s Tschudin: No need for negative rates, comfortable with outlook
The SNB appears comfortable maintaining its stance after board member Petra Tschudin said current interest rates are appropriate given Switzerland’s inflation outlook. In an interview with TeleZueri, she noted that the SNB’s forecasts place inflation between 0% and 2% over the medium term, consistent with its definition of price stability.
“From that perspective, interest rates are where they should be,” she said, adding that the central bank’s stance remains well calibrated to current conditions. Tschudin’s remarks were interpreted as a signal that the SNB will keep its policy rate at 0% for the foreseeable future.
Tschudin acknowledged that global conditions are shifting quickly but said there is no justification for reintroducing negative rates. “The central bank would only deploy negative rates if necessary,” she said, “but with the current inflation forecasts there is no need.”
Elsewhere, Chairman Martin Schlegel reiterated that Swiss inflation should edge slightly higher in the next few quarters, though global growth remains pressured by U.S. tariff actions.
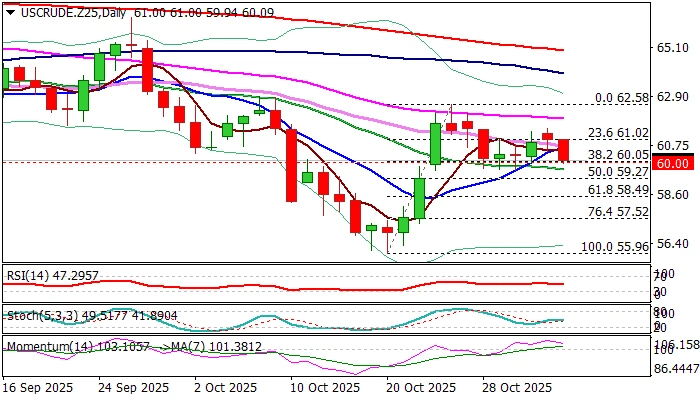
WTI Oil: Bears Regain Control on Demand Concerns, Reaction at Key $60 Support in Focus
WTI oil price remains in red for the second consecutive, weighed by fresh demand concerns following weak manufacturing numbers and OPEC+ decision to pause oil production hikes in early 2026, with strong dollar also contributing to near-term performance.
The price fell nearly 1.5% in early Tuesday trading and attacks again significant $60 support (psychological / Fibo 38.2% of $55.96/$62.58 recovery leg) where several attacks failed recently.
Daily studies lack clearer direction signal (MAs in mixed setup, but daily Tenkan/Kijun-sen have formed bull-cross / fading positive momentum), with reaction at $60 level seen as key for the near-term action.
Firm break lower to generate initial signal that corrective leg from $55.96 (Oct 20 multi-month low) might be coming to its end and shift focus to the downside (targets at $59.27 and $58.49, Fibo 50% and 61.8% respectively).
Conversely, repeated failure at $60 support would add to significance of support and keep the price in extended range, with initial bullish signal expected on break of range top ($61.48).
Res: 60.42; 61.00; 61.95; 62.58.
Sup: 59.70; 59.27; 59.00; 58.49.
Crypto on the Verge of Bear Market
Market Overview
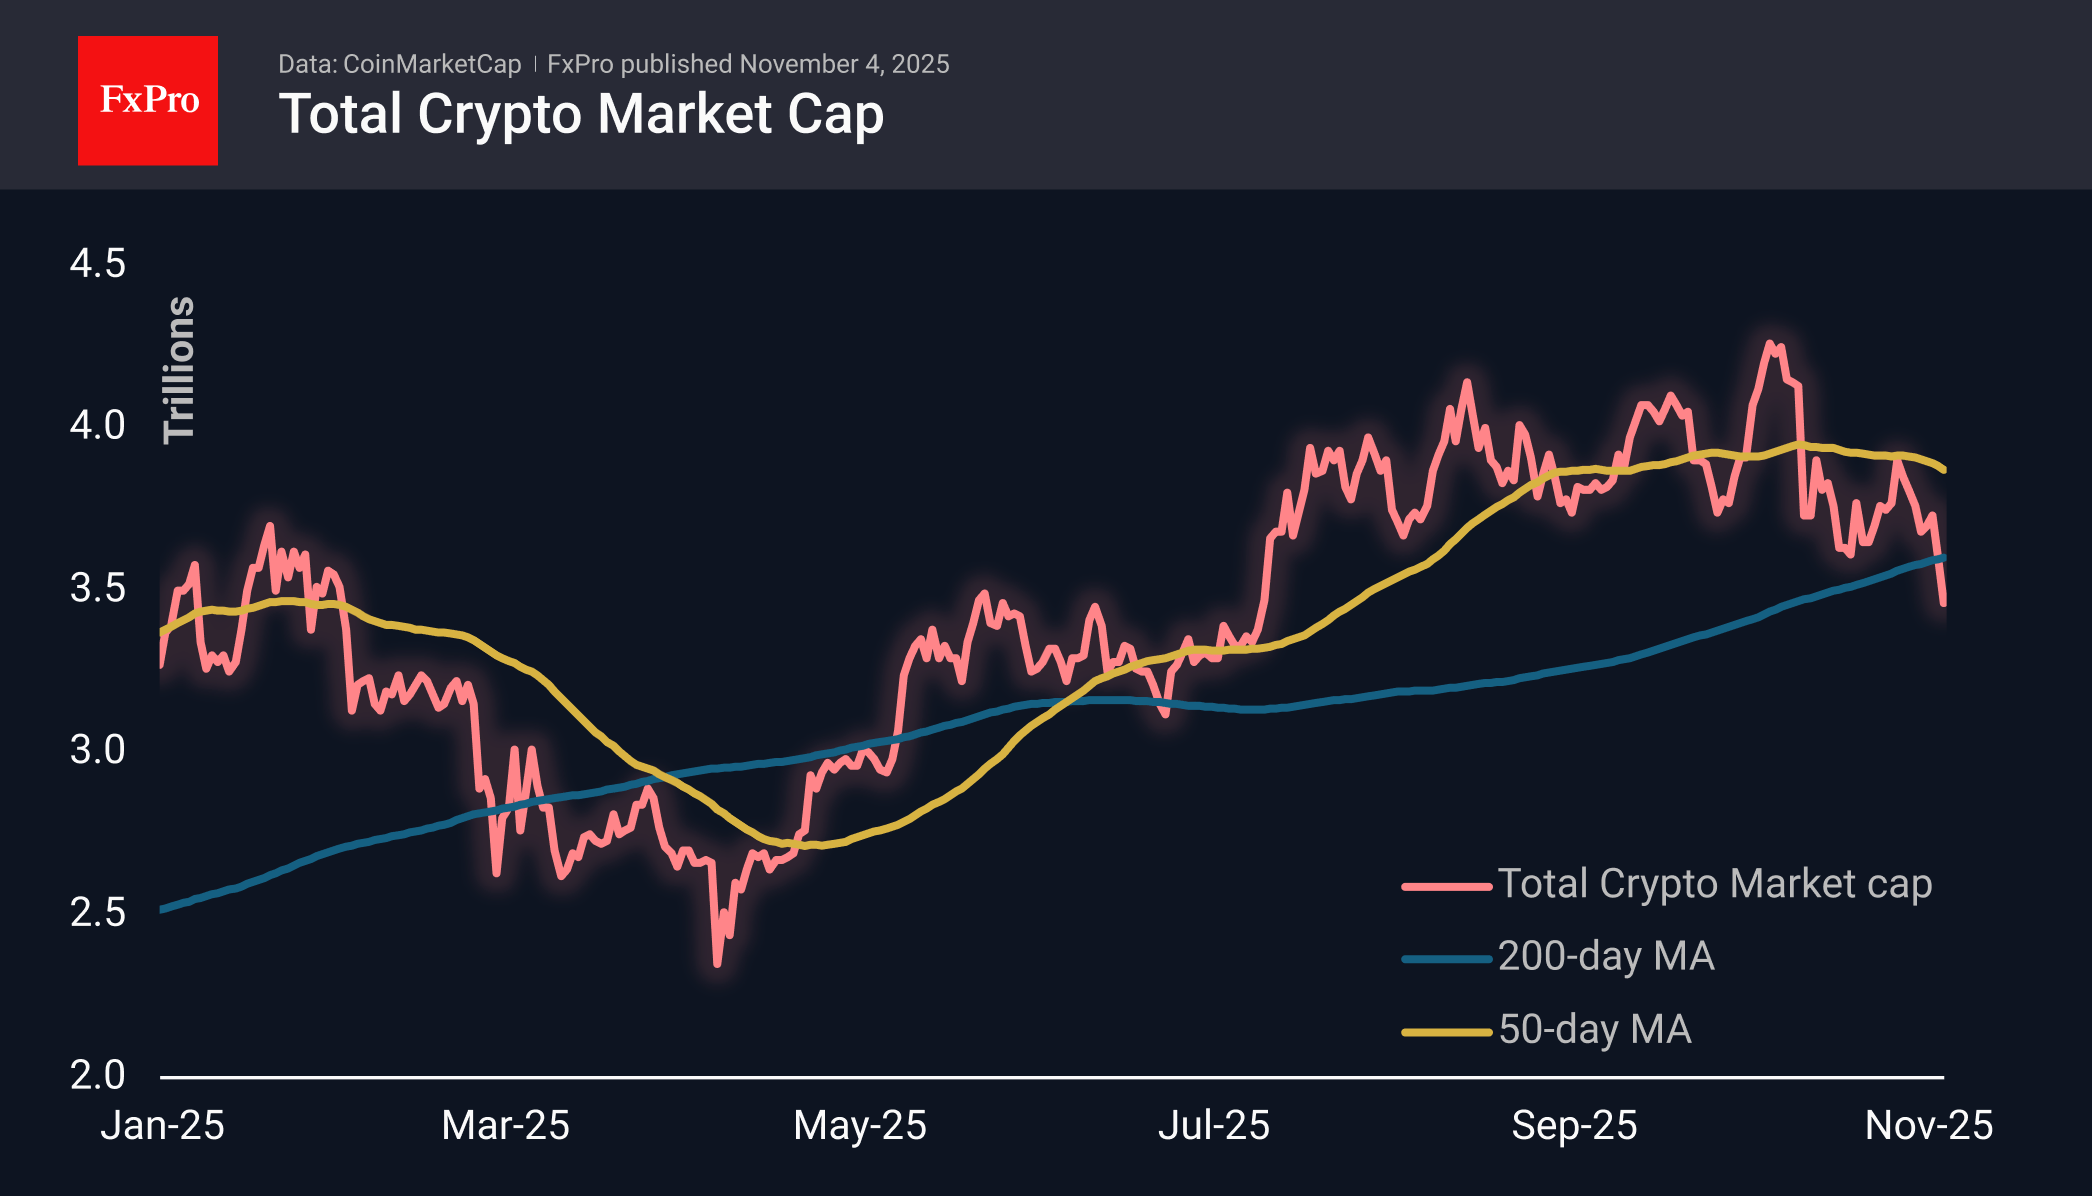
The crypto market cap has fallen to $3.47 trillion. This is 4% lower than the previous day and 19% off from the global peak set just four weeks ago. Sellers are pushing cryptocurrencies into bear market territory (unofficially, this occurs when there is a 20% decline from the peak) in the hope that the sell-off will be self-sustaining near this point. However, we are also seeing signs of a similar accelerated sell-off at the start of the week, following a lull from Friday to Sunday.
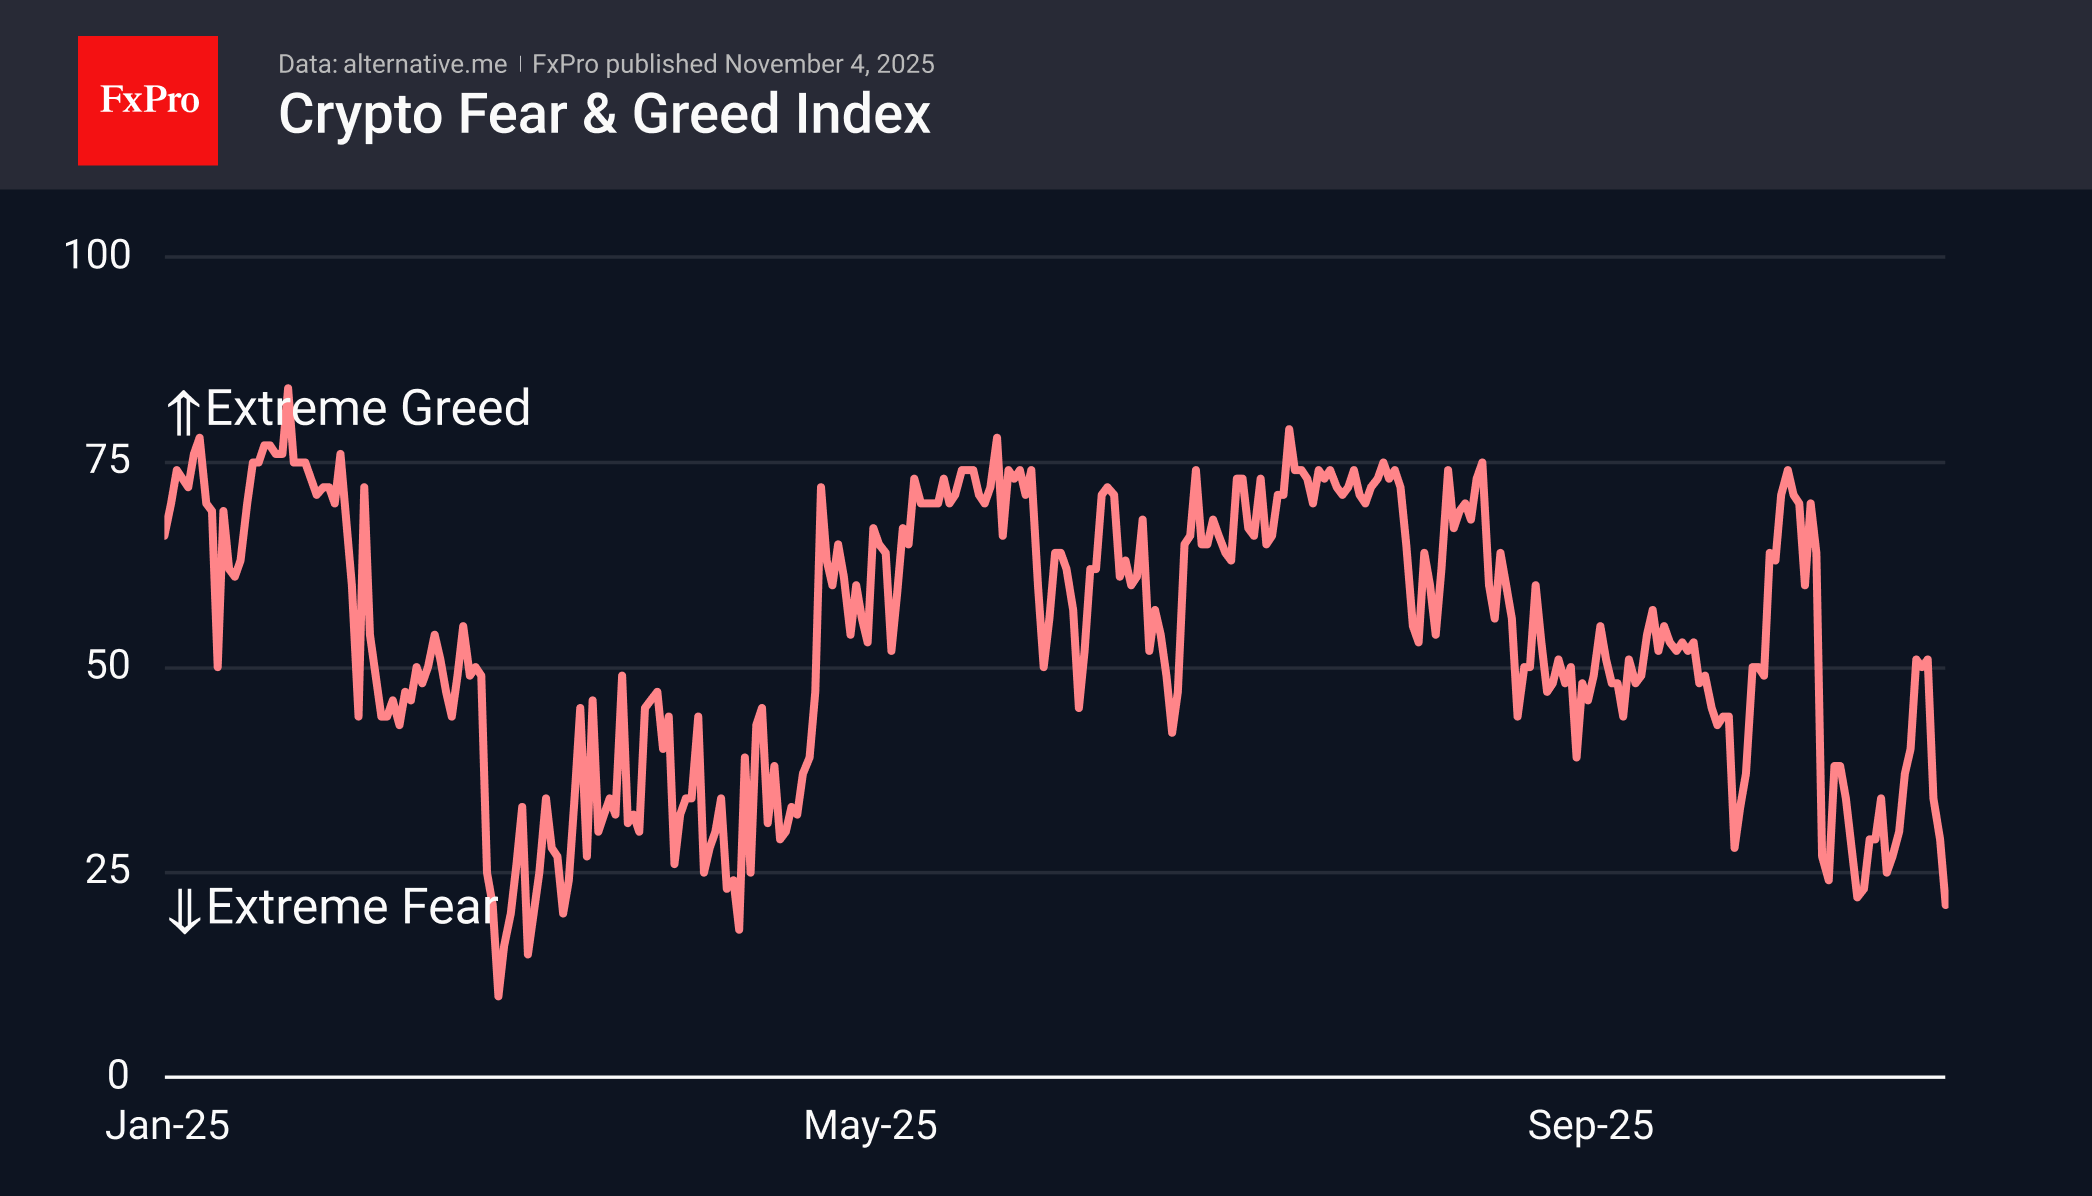
The sentiment index has fallen to 21, the lowest level since 9 April, indicating extreme fear. Last month, entering this territory triggered a rebound, but the market has already fallen below those levels. As we previously suggested, the initial surge of extreme fear levels is only the beginning of a prolonged period of volatility in this territory. This period is also characterised by an even more substantial decline in altcoins compared to the first cryptocurrency.
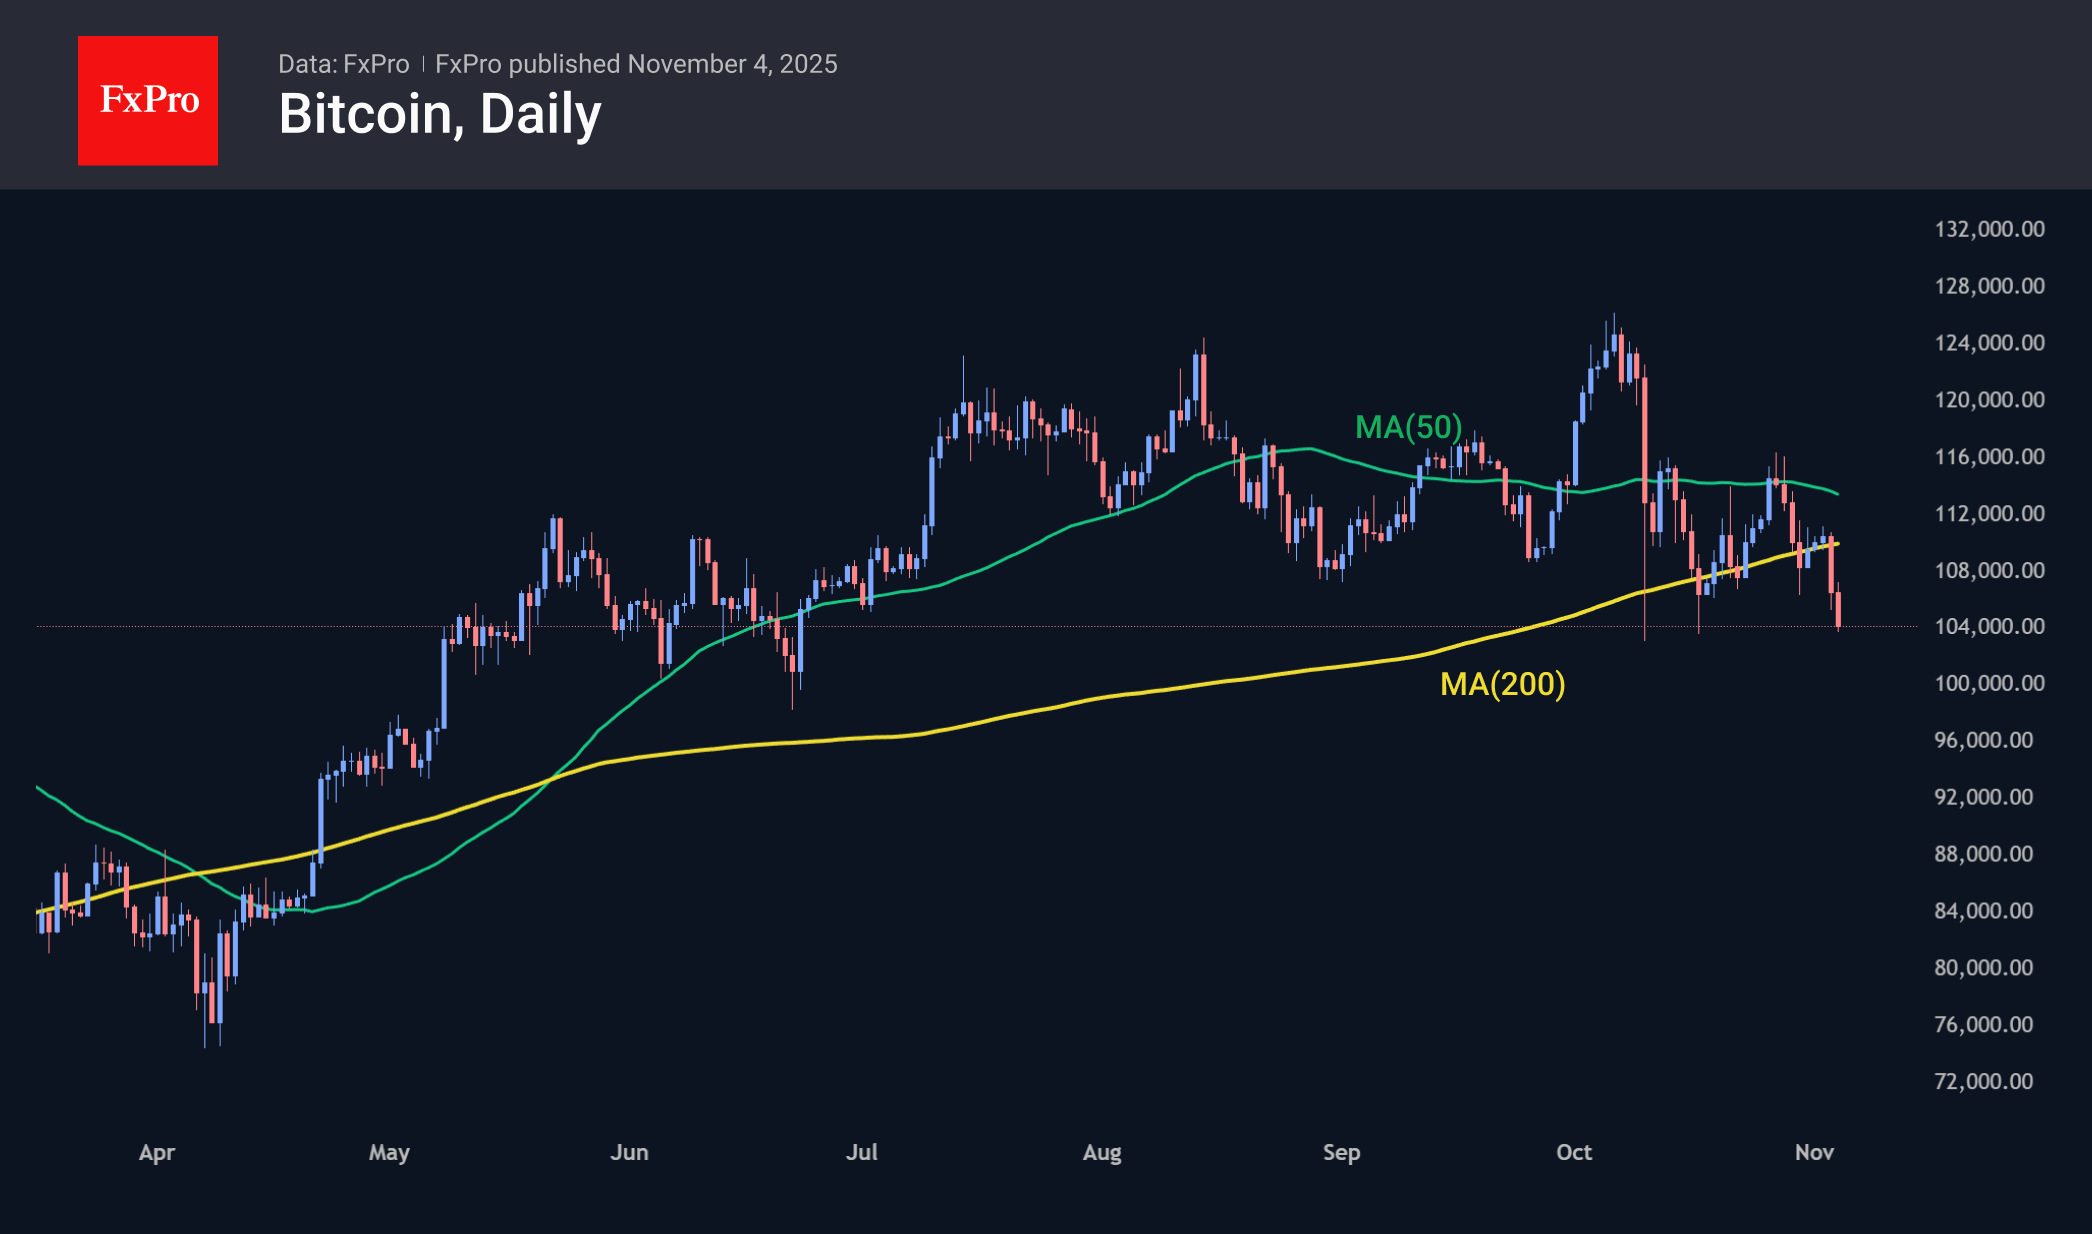
Bitcoin plummeted below $ 105K, shedding nearly 3% in the past 24 hours. Excluding short-term slips last month, BTC has not traded lower since June. By and large, it is now testing levels that served as resistance last December and January.
News Background
According to CoinShares, global investment in crypto funds declined by $360 million last week, following inflows the week before. Only investments in Bitcoin declined, by $946 million. Investments in altcoins increased, with notable gains in Ethereum by $58 million, in Solana by $421 million, in XRP by $43 million, and in Sui by $9 million.
QCP Capital recorded large transfers of Bitcoin to the Kraken exchange by early investors. According to analysts, the current consolidation resembles the period before the breakthrough in 2024. Otherwise, it could signal the beginning of a crypto winter.
Bitcoin is not showing growth as early investors pass the baton to long-term holders. The recovery of the first cryptocurrency is only possible after the ETF and Strategy resume large-scale purchases, according to CryptoQuant.
Strategy bought 397 bitcoins last week at an average price of $114,771. Strategy now owns 641,205 BTC worth $47.49 billion at an average purchase price of $74,057 per coin. The company’s weekly BTC purchase volumes remain close to record lows.
Another record was set in October by the Ethereum network, with stablecoin transactions reaching $2.8 trillion last month. Circle’s USDC was the leader, accounting for $1.6 trillion of the total turnover.
Nasdaq 100 Analysis: Early November Movements Raise Concerns
As the chart shows, the Nasdaq 100 index (US Tech 100 mini on FXOpen) gained around 6% in October, supported by several key factors:
→ The meeting between US President Donald Trump and Chinese leader Xi Jinping, which helped ease tensions in trade relations between the world’s two largest economies.
→ A 0.25% rate cut by the Federal Reserve.
→ Positive earnings from major tech companies, including a strong report from Alphabet (GOOGL).
However, the market’s behaviour in early November is cause for concern — on the morning of 4 November, the stock index fell to its lowest level in a week. Bearish sentiment is being fuelled by:
→ uncertainty over the timing of the end of the government shutdown;
→ a weaker-than-expected ISM Manufacturing PMI report, which may reflect the impact of Trump’s tariffs on US industry.
Technical Analysis of the Nasdaq 100 Chart
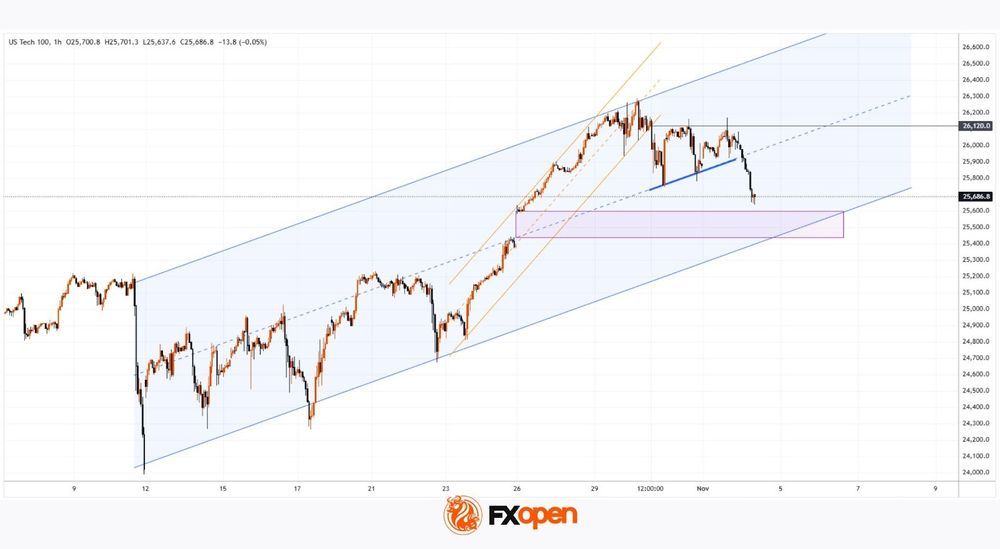
Analysing the hourly chart of the Nasdaq 100 (US Tech 100 mini on FXOpen) on 30 October, we:
→ confirmed the relevance of the upward channel (shown in blue), noting that the upper boundary was showing signs of resistance;
→ drew a steeper trajectory consisting of three orange lines;
→ suggested a profit-taking scenario, in which bears would attempt to push the Nasdaq 100 index down towards the median line of the blue channel.
This scenario has since materialised, as:
→ the median line has repeatedly acted as support (highlighted in blue);
→ the breakout level of the orange lines at 26,120 has turned into a resistance zone.
At present, the Nasdaq 100 index is trading in the lower half of the channel, indicating that the bullish momentum from late October has faded. Bulls might find support near the gap area, reinforced by the lower boundary of the blue channel.
Trade global index CFDs with zero commission and tight spreads. Open your FXOpen account now or learn more about trading index CFDs with FXOpen.
This article represents the opinion of the Companies operating under the FXOpen brand only. It is not to be construed as an offer, solicitation, or recommendation with respect to products and services provided by the Companies operating under the FXOpen brand, nor is it to be considered financial advice.
Kiwi slumps ahead of Q3 jobs data, AUD/NZD tests 2022 high
New Zealand Dollar is under broad pressure today, partly as risk sentiment turned mildly sour in Asian trade and extended into the European morning. The move reflected a combination of modest risk aversion and steady cross-selling against Australian Dollar, which found relative support following the RBA’s policy decision earlier in the day.
Even though Aussie was weighed down by the softer risk tone, it held firm against Kiwi after the RBA left the cash rate unchanged and signaled no further rate cuts this year, and likely only one more in 2026. In contrast, the OIS market continues to fully price a 25-basis-point cut by the RBNZ at its next meeting on November 26, with around a 50% chance of one final cut by mid-2026.
This policy divergence makes Wednesday’s New Zealand labor market report a potential flashpoint for further moves. Consensus forecasts point to only 0.1% employment growth in Q3 and an unemployment rate rising to 5.3%. Any downside surprise could tip the economy into two consecutive cycle of job losses, reinforcing, which would solidify the case for additional RBNZ rate cuts next year.
Technically, AUD/NZD is testing the 1.1489 resistance, its highest level since 2022. A decisive break above this zone would confirm bullish continuation and open the way toward the 61.8% projection of 1.0744 to 1.1443 from 1.1275 at 1.1707.
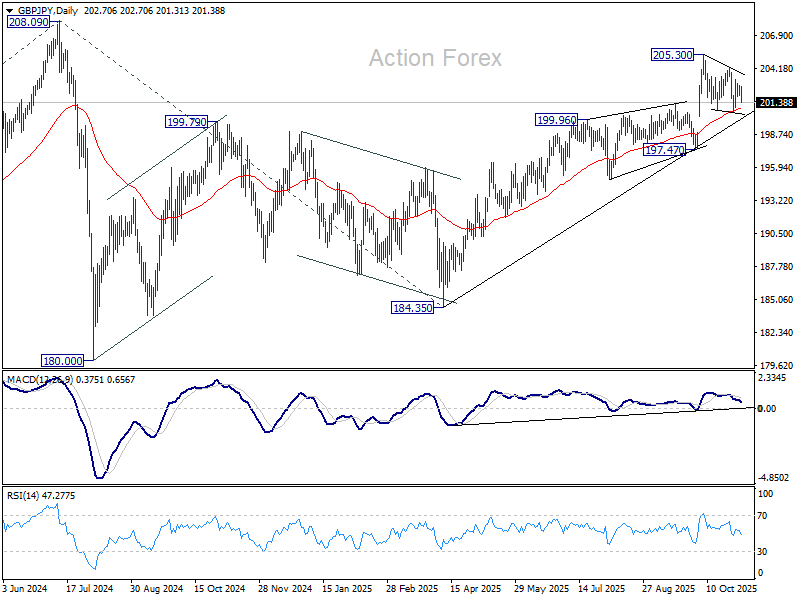
GBP/JPY Daily Outlook
Daily Pivots: (S1) 202.12; (P) 202.46; (R1) 202.99; More...
Intraday bias in GBP/JPY remains neutral and further rise is expected with 200.54 support intact. Break of 204.22 will suggest that rise from 184.35 is resuming through 205.30 towards 208.09 high. However, break of 200.54 will extend the fall from 205.30 to 197.47 key structural support.
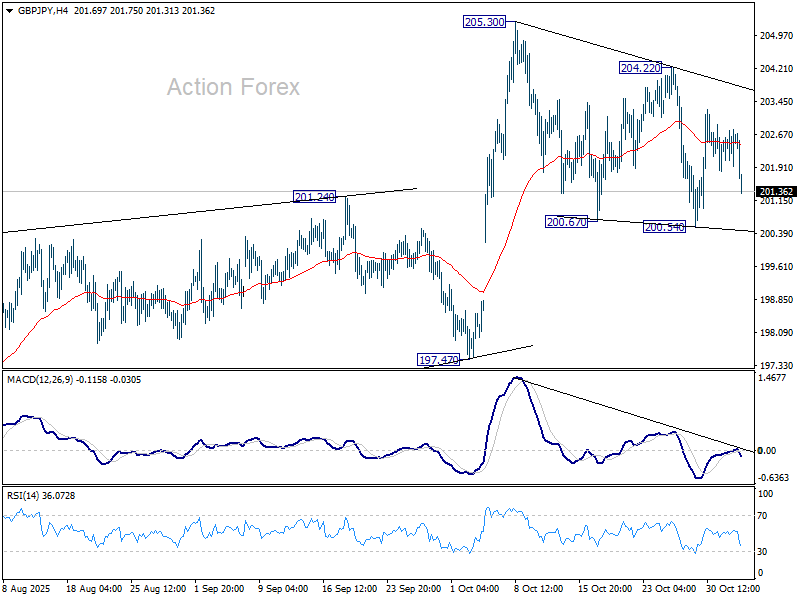
In the bigger picture, price actions from 208.09 (2024 high) are seen as a corrective pattern which might have completed at 184.35. Firm break of 208.09 high will resume the up trend from 123.94 (2020 low). Next target is 61.8% projection of 148.93 to 208.09 from 184.35 at 220.90. However, decisive break of 197.47 support will dampen this view and extend the corrective pattern with another fall.
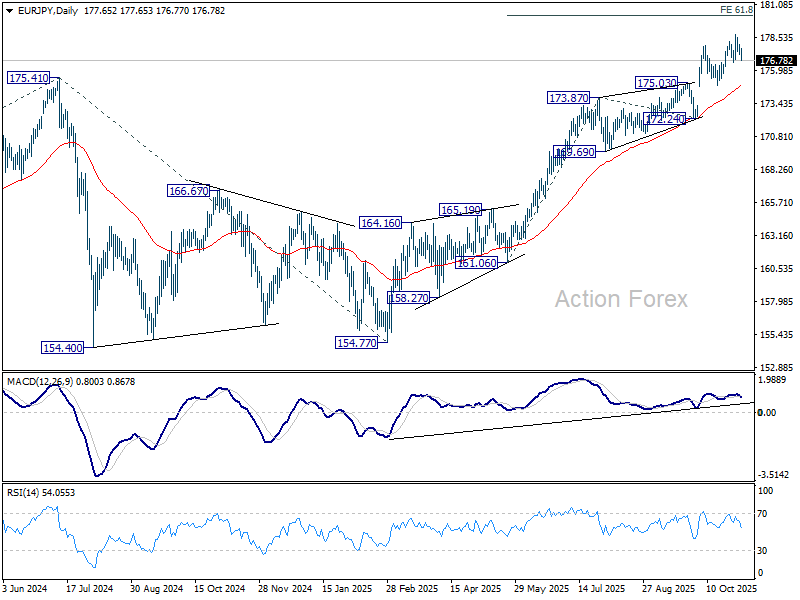
EUR/JPY Daily Outlook
Daily Pivots: (S1) 177.27; (P) 177.63; (R1) 178.01; More...
Intraday bias in EUR/JPY remains neutral and further rise is expected with 174.80 support intact. On the upside, break of 178.80 will extend the up trend to 61.8% projection of 161.06 to 173.87 from 172.24 at 180.15 next. However, considering bearish divergence condition in 4H MACD, firm break of 176.60 will confirm short term topping, and bring deeper correction to 174.80 support instead.
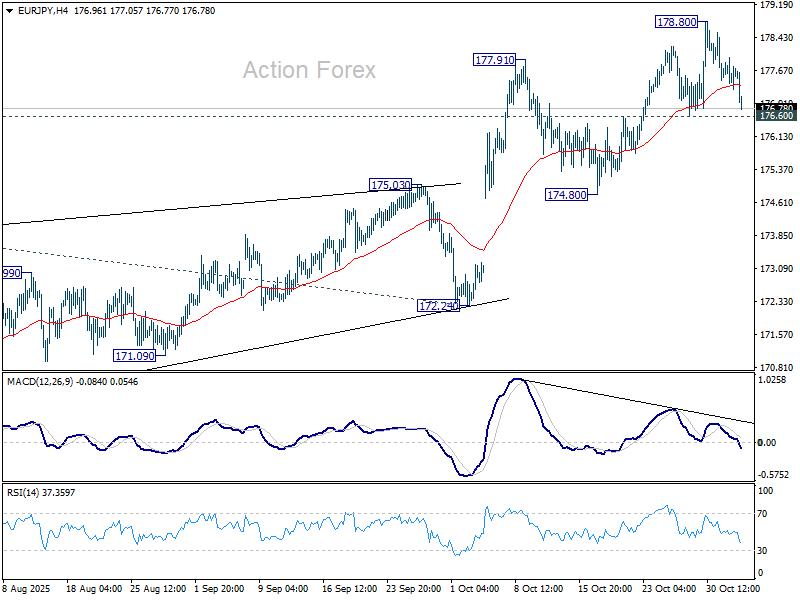
In the bigger picture, up trend from 114.42 (2020 low) is in progress and should target 61.8% projection of 124.37 to 175.41 from 154.77 at 186.31. Firm break of 172.24 support will suggests that it has turned into consolidations again. But still, outlook will continue to stay bullish as long as 55 W EMA (now at 167.87) holds, even in case of deep pullback.