Sample Category Title
AUD/USD Daily Report
Daily Pivots: (S1) 0.6516; (P) 0.6540; (R1) 0.6561; More...
AUD/USD's break of 0.6524 resistance turned support suggests that rebound from 0.6439 has completed at 0.6616. Intraday bias is back on the downside for deeper fall to 0.6349, or even further to 0.6413 cluster support (38.2% retracement of 0.5913 to 0.6706 at 0.6403). Strong support should be seen from 0.6403/13 to bring rebound to extend range trading. However, sustained trading below there will carry larger bearish implications.
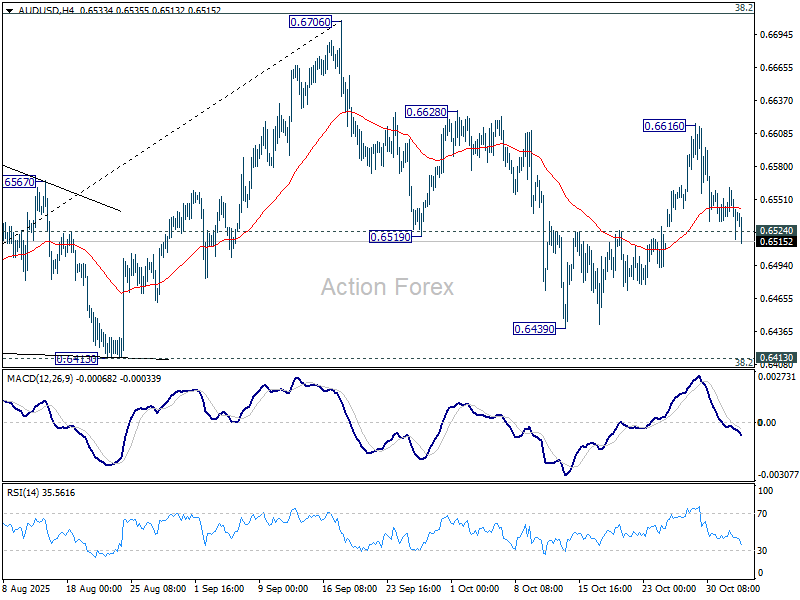
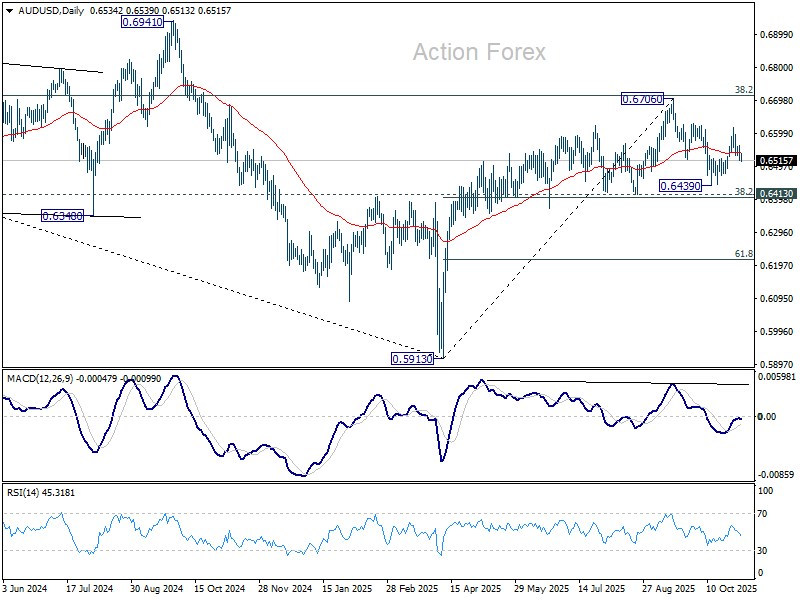
In the bigger picture, there is no clear sign that down trend from 0.8006 (2021 high) has completed. Rebound from 0.5913 is seen as a corrective move. Outlook will remain bearish as long as 38.2% retracement of 0.8006 to 0.5913 at 0.6713 holds. Break of 0.6413 support will suggest rejection by 0.6713 and solidify this bearish case. Nevertheless, considering bullish convergence condition in W MACD, sustained break of 0.6713 will be a strong sign of bullish trend reversal, and pave the way to 0.6941 structural resistance for confirmation.
Aussie Mildly Lower After RBA Hold; Yen Firms on Fresh Verbal Intervention
Australian Dollar traded mildly lower after the RBA left its cash rate unchanged at 3.60%, a move fully expected by markets. The policy hold came with few surprises, and the key takeaway was that the RBA’s updated forecasts signal no further rate cuts this year, reflecting a sharper upward revision in near-term inflation. The decision and tone were broadly in line with expectations, explaining the relatively muted market response following the announcement.
Governor Michele Bullock reinforced this message at the post-meeting press conference, saying the Board “did not consider cutting today.” She added that while it’s “possible there are no more rate cuts, it’s possible there are some more”. Bullock described the risks as “fairly evenly balanced to the upside and the downside,” emphasizing flexibility: “We are not wedded religiously to a particular path.” Her remarks suggest the RBA sees inflation risks and growth headwinds as roughly offsetting, with policy firmly on pause until more clarity emerges from upcoming data, particularly the Q4 CPI due January.
Elsewhere in currency markets, Japanese Yen strengthened on renewed verbal intervention from officials Finance Minister Satsuki Katayama issued another sharp warning, saying she was observing “one-sided and rapid moves” in the currency market and that authorities would monitor developments with a “high sense of urgency.” The remarks revived speculation that Tokyo could step in to curb excessive Yen weakness if volatility persists.
Katayama’s statement effectively overshadowed comments from Prime Minister Sanae Takaichi, who reiterated that Japan has yet to achieve the BoJ’s 2% inflation target on a sustained basis alongside wage growth — implying that she favors maintaining loose monetary policy.
In the broader market, Yen is currently the strongest performer of the day, followed by the Dollar and Loonie. Kiwi is the weakest, trailed by Swiss Franc and Sterling. Aussie and Euro trade in the middle of the pack.
In Asia, at the time of writing, Nikkei is down -0.72%. Hong Kong HSI is down -0.20%. China Shanghai SSE is down -0.39%. Singapore Strait Times is down -0.21%. Japan 10-year JGB yield is up 0.02 at 1.679. Overnight, DOW fell -0.48%. S&P 500 rose 0.17%. NASDAQ rose 0.46%. 10-year yield rose 0.005 to 4.106.
RBA holds at 3.60%, upgrades inflation path, sees only one cut in 2026
The RBA kept the cash rate unchanged at 3.60%, a move widely expected by markets and decided unanimously by the Board. In the statement, policymakers said the decision reflected a balance between inflation risks and economic resilience, noting that Q3 CPI was "materially higher" than expected and that there was “recent evidence of more persistent inflation.” Together with signs of recovering private demand and a labor market that remains “a little tight,” the Bank judged that current settings remain appropriate.
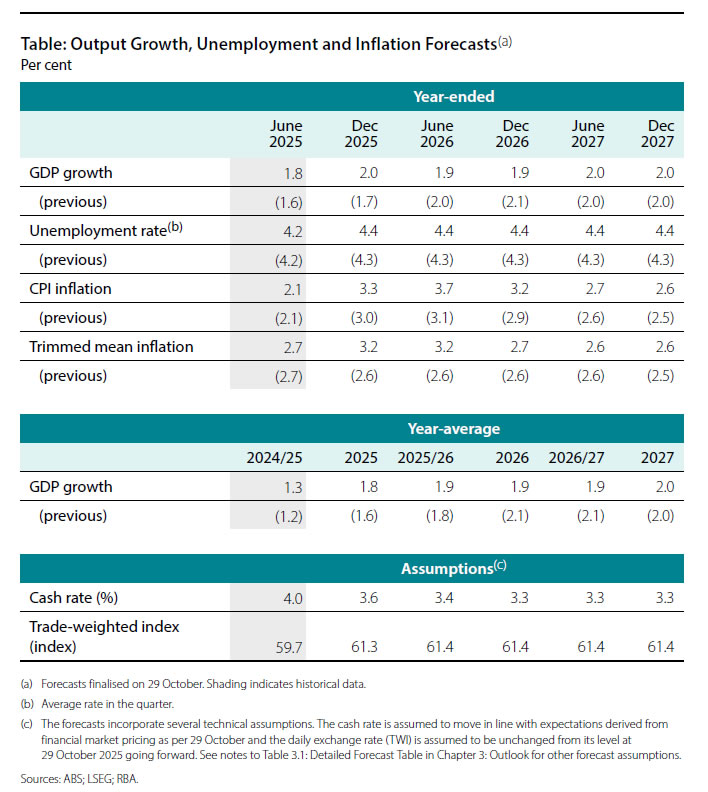
The updated economic projections painted a picture of stickier inflation but slightly better near-term growth. Average GDP growth for 2025 was upgraded from 1.6% to 1.8%, while the 2026 projection was trimmed from 2.1% to 1.9%, and 2027 was kept unchanged at 2.0%.
Headline inflation forecasts were lifted across the board — from 3.0% to 3.3% for the end of 2025, 2.9% to 3.2% for 2026, and 2.5% to 2.6% for 2027 — reflecting persistent price pressures in both goods and services.
Underlying inflation was also revised higher. The trimmed mean CPI forecast jumped from 2.6% to 3.2% by the end of 2025, while the 2026 estimate edged up from 2.6% to 2.7%, and 2027 from 2.5% to 2.6%.
These upward revisions highlight the Bank’s view that inflation will take longer to return sustainably to target.
Meanwhile, policy-rate assumptions in the central scenario indicate no further rate cuts in 2025, followed by just over one reduction next year, lowering the cash rate to around 3.3% by the end of 2026, where it is expected to remain through 2027.
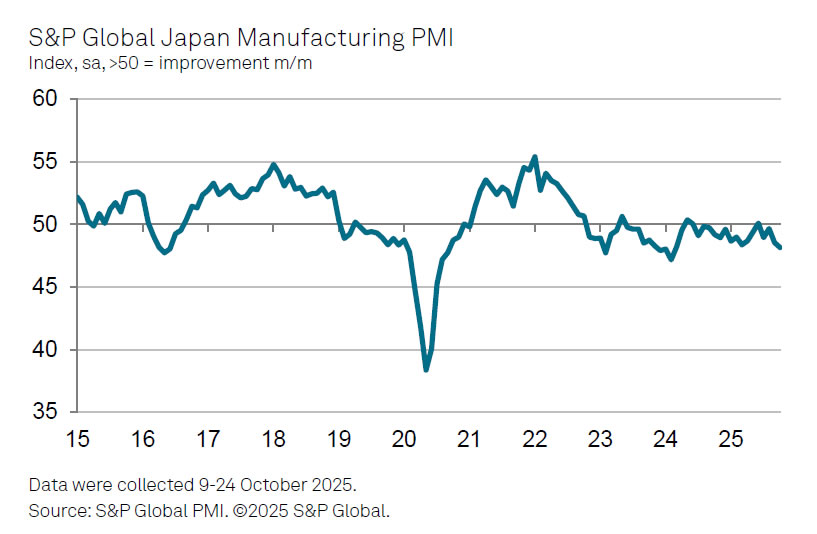
Japan's PMI manufacturing finalized at 48.2, but sentiment shows improvement
Japan’s manufacturing sector contracted again in October, with the final S&P Global PMI edging down to 48.2 from 48.5 in September. According to S&P Global’s Pollyanna De Lima, demand softness — particularly in the automotive and semiconductor sectors — triggered the sharpest fall in new orders since early 2024, while exports to Asia, Europe, and the U.S. continued to decline.
Manufacturers also faced rising cost pressures, as higher input costs squeezed margins even as demand waned. To offset these pressures, many firms lifted selling prices despite intense competition for new business.
Still, sentiment showed some improvement. The decline in production was relatively contained, and many firms expressed greater optimism about future output. Hopes for successful new product launches and expectations that the impact of U.S. tariffs will eventually fade helped boost confidence.
Fed’s Cook: Every meeting is live, December included
Fed Governor Lisa Cook said she supported last week’s quarter-point rate cut, describing it as “another gradual step toward normalization.” Cook noted that she views current policy as “modestly restrictive,” which remains appropriate given that inflation is still above target. At the same time, she argued that “downside risks to employment are greater than the upside risks to inflation,” suggesting a tilt toward caution on the growth side of the Fed’s dual mandate.
Cook emphasized that monetary policy is “not on a predetermined path”. She said the economy is at a moment when risks to both sides of the mandate are elevated: keeping rates too high could cause a sharp labor-market deterioration, while cutting too aggressively could risk unanchoring inflation expectations. .
Looking ahead, Cook stressed that each meeting remains a “live meeting,” including December’s. She will base her decision on incoming data and shifts in the economic outlook, particularly regarding labor conditions and inflation persistence.
Fed’s Daly keeps open mind on December, sees labor market still stable
San Francisco Fed President Mary Daly said she supported last week’s rate cut and will approach the December meeting with “an open mind”. She believed it was “appropriate to take another bit off the policy rate,” while emphasizing that the central bank must now gauge whether the 50 basis points of easing delivered this year are sufficient to guard against further weakness in hiring.
She noted that incoming data, including state-level jobless claims, suggest the labor market is not on a “precipice,” with conditions still stable despite slower momentum. Inflation, she said, is running near 3%, indicating progress but not yet a full return to target.
Daly added that FOMC participants often hold diverse views ahead of meetings, but consensus tends to emerge as new data clarify the outlook.
AUD/USD Daily Report
Daily Pivots: (S1) 0.6516; (P) 0.6540; (R1) 0.6561; More...
AUD/USD's break of 0.6524 resistance turned support suggests that rebound from 0.6439 has completed at 0.6616. Intraday bias is back on the downside for deeper fall to 0.6349, or even further to 0.6413 cluster support (38.2% retracement of 0.5913 to 0.6706 at 0.6403). Strong support should be seen from 0.6403/13 to bring rebound to extend range trading. However, sustained trading below there will carry larger bearish implications.
In the bigger picture, there is no clear sign that down trend from 0.8006 (2021 high) has completed. Rebound from 0.5913 is seen as a corrective move. Outlook will remain bearish as long as 38.2% retracement of 0.8006 to 0.5913 at 0.6713 holds. Break of 0.6413 support will suggest rejection by 0.6713 and solidify this bearish case. Nevertheless, considering bullish convergence condition in W MACD, sustained break of 0.6713 will be a strong sign of bullish trend reversal, and pave the way to 0.6941 structural resistance for confirmation.
RBA holds at 3.60%, upgrades inflation path, sees only one cut in 2026
The RBA kept the cash rate unchanged at 3.60%, a move widely expected by markets and decided unanimously by the Board. In the statement, policymakers said the decision reflected a balance between inflation risks and economic resilience, noting that Q3 CPI was "materially higher" than expected and that there was “recent evidence of more persistent inflation.” Together with signs of recovering private demand and a labor market that remains “a little tight,” the Bank judged that current settings remain appropriate.
The updated economic projections painted a picture of stickier inflation but slightly better near-term growth. Average GDP growth for 2025 was upgraded from 1.6% to 1.8%, while the 2026 projection was trimmed from 2.1% to 1.9%, and 2027 was kept unchanged at 2.0%.
Headline inflation forecasts were lifted across the board — from 3.0% to 3.3% for the end of 2025, 2.9% to 3.2% for 2026, and 2.5% to 2.6% for 2027 — reflecting persistent price pressures in both goods and services.
Underlying inflation was also revised higher. The trimmed mean CPI forecast jumped from 2.6% to 3.2% by the end of 2025, while the 2026 estimate edged up from 2.6% to 2.7%, and 2027 from 2.5% to 2.6%.
These upward revisions highlight the Bank’s view that inflation will take longer to return sustainably to target.
Meanwhile, policy-rate assumptions in the central scenario indicate no further rate cuts in 2025, followed by just over one reduction next year, lowering the cash rate to around 3.3% by the end of 2026, where it is expected to remain through 2027.
(RBA) Statement by the Reserve Bank Board: Monetary Policy Decisions
At its meeting today, the Board decided to leave the cash rate unchanged at 3.60 per cent.
Inflation has recently picked up.
Inflation has fallen substantially since the peak in 2022, as higher interest rates have been working to bring aggregate demand and potential supply closer towards balance. More recently, however, inflation has picked up. Trimmed mean inflation was 1.0 per cent in the September quarter and 3.0 per cent over the year, up from 2.7 per cent over the year in the June quarter. This was materially higher than expected at the time of the August Statement on Monetary Policy. Headline inflation rose sharply to 3.2 per cent over the year in the September quarter, a large part of which was expected given the cessation of electricity rebates in a number of states.
The Board’s judgement is that some of the increase in underlying inflation in the September quarter was due to temporary factors. The central forecast in the November Statement on Monetary Policy, which is based on a technical assumption of one more rate cut in 2026, has underlying inflation rising above 3 per cent in coming quarters before settling at 2.6 per cent in 2027.
Domestic economic activity is recovering but the outlook remains uncertain.
Data on consumption suggest that the pick-up in private demand evident in the June quarter is ongoing. The housing market is continuing to strengthen, a sign that recent interest rate reductions are having an effect. Housing prices are rising and dwelling construction costs have also started to increase again after a period of weak growth. Credit is readily available to both households and businesses.
Various indicators suggest that labour market conditions remain a little tight, notwithstanding a recent easing. Growth in employment has slowed by slightly more than expected and the unemployment rate rose to 4.5 per cent in September from 4.3 per cent in August. But measures of labour underutilisation remain at low rates, job vacancies are still at a high level and business surveys and liaison continue to suggest that a significant share of firms are experiencing difficulty sourcing labour. Looking through quarterly volatility, wages growth has eased from its peak, but productivity growth has been weak and growth in unit labour costs remains high.
There are uncertainties about the outlook for domestic economic activity and inflation stemming from both domestic and international developments. On the domestic side, if the pick-up in private demand continues to exceed expectations, this could increase the demand for labour, add to capacity pressures and make it easier for businesses to pass on cost increases. Alternatively, the improvement in private demand might not persist.
Uncertainty in the global economy remains elevated but so far there has been minimal impact on overall growth and trade, and many forecasters have revised up their near-term expectations for world growth. Trade policy developments are still expected to have an adverse effect on world growth over time. Beyond tariffs, a broader range of geopolitical risks remain a threat to the global economy. This could all weigh on growth in aggregate demand and lead to weaker labour market conditions in the domestic economy.
There are also uncertainties regarding the assessment that monetary policy remains a little restrictive, the lags in the effect of recent monetary easing, the balance between aggregate demand and potential supply for goods and services, conditions in the labour market and the outlook for productivity growth. These uncertainties present risks in both directions to the inflation and employment outlook.
Maintaining price stability and full employment is the priority.
The recent data on inflation suggest that some inflationary pressure may remain in the economy. With private demand recovering and labour market conditions still appearing a little tight, the Board decided that it was appropriate to maintain the cash rate at its current level at this meeting. Financial conditions have eased since the beginning of the year, but it will take some time to see the full effects of earlier cash rate reductions. Given this, and the recent evidence of more persistent inflation, the Board judged that it was appropriate to remain cautious, updating its view of the outlook as the data evolve. The Board remains alert to the heightened level of uncertainty about the outlook in both directions.
The Board will be attentive to the data and the evolving assessment of the outlook and risks to guide its decisions. In doing so, it will pay close attention to developments in the global economy and financial markets, trends in domestic demand, and the outlook for inflation and the labour market. The Board is focused on its mandate to deliver price stability and full employment and will do what it considers necessary to achieve that outcome.
Decision
Today’s policy decision was unanimous.
Gold Consolidates After Correction As Traders Await Fresh Catalysts
Key Highlights
- Gold started a consolidation phase after a dip to $3,885.
- A contracting triangle is forming with support at $3,970 on the 4-hour chart.
- WTI Crude Oil prices could struggle to recover above $62.20.
- EUR/USD is again moving lower and could drop to 1.1450.
Gold Price Technical Analysis
Gold prices corrected some gains and traded below $4,000 against the US Dollar. It even tested $3,885 before starting a consolidation phase.
The 4-hour chart of XAU/USD indicates that the price settled below the 100 Simple Moving Average (red, 4 hours) but stayed above the 200 Simple Moving Average (green, 4 hours).
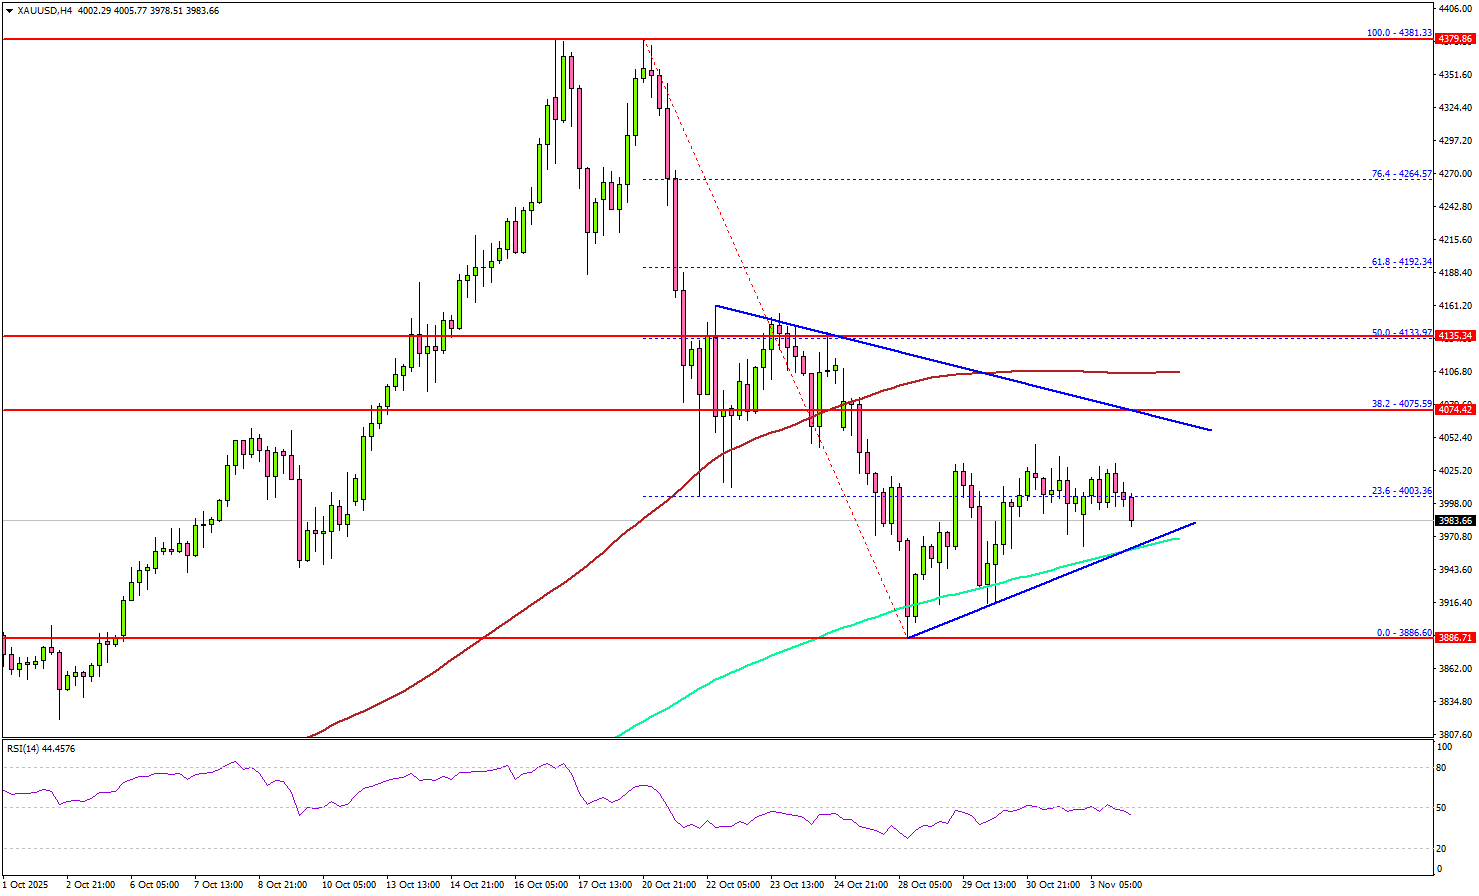
Recently, there was a move above the 23.6% Fib retracement level of the downward move from the $4,381 swing high to the $3,886 low. On the upside, immediate resistance is near the $4,070 level. The next major resistance sits near the $4,100 level.
A clear move above $4,100 could open the doors for more upside. In the stated case, the bulls could aim for a move toward $4,135 and the 50% Fib retracement level of the downward move from the $4,381 swing high to the $3,886 low.
On the downside, initial support is near the $3,970 level. There is also a contracting triangle forming with support at $3,970. The first key support is $3,945. The next major support is near the $3,885 level. A downside break below $3,885 might call for more downsides. The next key zone to watch could be $3,800.
Looking at WTI Crude Oil, the price attempted a decent recovery wave, but the bears remained active below the $62.50 level.
Economic Releases to Watch Today
- ECB's President Lagarde speech.
- Fed's Bowman speech.
- BoE's Breeden speech.
Japan’s PMI manufacturing finalized at 48.2, but sentiment shows improvement
Japan’s manufacturing sector contracted again in October, with the final S&P Global PMI edging down to 48.2 from 48.5 in September. According to S&P Global’s Pollyanna De Lima, demand softness — particularly in the automotive and semiconductor sectors — triggered the sharpest fall in new orders since early 2024, while exports to Asia, Europe, and the U.S. continued to decline.
Manufacturers also faced rising cost pressures, as higher input costs squeezed margins even as demand waned. To offset these pressures, many firms lifted selling prices despite intense competition for new business.
Still, sentiment showed some improvement. The decline in production was relatively contained, and many firms expressed greater optimism about future output. Hopes for successful new product launches and expectations that the impact of U.S. tariffs will eventually fade helped boost confidence.
Fed’s Cook: Every meeting is live, December included
Fed Governor Lisa Cook said she supported last week’s quarter-point rate cut, describing it as “another gradual step toward normalization.” Cook noted that she views current policy as “modestly restrictive,” which remains appropriate given that inflation is still above target. At the same time, she argued that “downside risks to employment are greater than the upside risks to inflation,” suggesting a tilt toward caution on the growth side of the Fed’s dual mandate.
Cook emphasized that monetary policy is “not on a predetermined path”. She said the economy is at a moment when risks to both sides of the mandate are elevated: keeping rates too high could cause a sharp labor-market deterioration, while cutting too aggressively could risk unanchoring inflation expectations. .
Looking ahead, Cook stressed that each meeting remains a “live meeting,” including December’s. She will base her decision on incoming data and shifts in the economic outlook, particularly regarding labor conditions and inflation persistence.
Fed’s Daly keeps open mind on December, sees labor market still stable
San Francisco Fed President Mary Daly said she supported last week’s rate cut and will approach the December meeting with “an open mind”. She believed it was “appropriate to take another bit off the policy rate,” while emphasizing that the central bank must now gauge whether the 50 basis points of easing delivered this year are sufficient to guard against further weakness in hiring.
She noted that incoming data, including state-level jobless claims, suggest the labor market is not on a “precipice,” with conditions still stable despite slower momentum. Inflation, she said, is running near 3%, indicating progress but not yet a full return to target.
Daly added that FOMC participants often hold diverse views ahead of meetings, but consensus tends to emerge as new data clarify the outlook.
Gold (XAU/USD) Price Forecast: Bullion Buoyant Above $4,000, Now Looks for Support Ahead of ADP Payrolls
Trading at $4,008 well into the US session, up +0.14% in today’s trading, gold bullion continues to look for support at the key psychological level of $4,000.
With the US government shutdown still ongoing, US data releases remain sparse.
Eyes now turn to the private release of ADP payrolls this Wednesday, which will likely offer some insight into how the Fed will continue its easing cycle.
Join me as I attempt to answer the $4,008 dollar question:
How will gold (XAU/USD) fare in this week’s trading?
Gold (XAU/USD): Key takeaways 03/11/2025
- Cooling after a period of significant upside, gold bullion has found some support at the key psychological level of $4,000, with Thursday’s price action showing a persistent level of bullish interest
- Priced in for some time, last week’s rate cut by the FOMC offered a hawkish tilt, with Chair Powell making some suggestion that this could be the final rate cut of the year, which, in theory, would be negative for gold pricing
- With the dollar continuing to fresh highs in today’s session, gold has not only become more expensive for international buyers, but the associated rise in short-term bond yields is increasing the opportunity cost of holding gold bullion, hurting pricing
Gold (XAU/USD): Safe at $4,000
Although I don’t wish to speak too soon, gold pricing is looking relatively stable above $4,000.
Despite the recent downside, which, by most metrics, was entirely inevitable after the explosive rally, gold remains on a firm fundamental and technical footing, with the current consolidation necessary if the yellow metal is to move higher.
With that said, this is market commentary, as in, what’s happening now, so allow me to explain some of the key macroeconomic headwinds currently at play in the precious metal markets.
Let’s discuss.
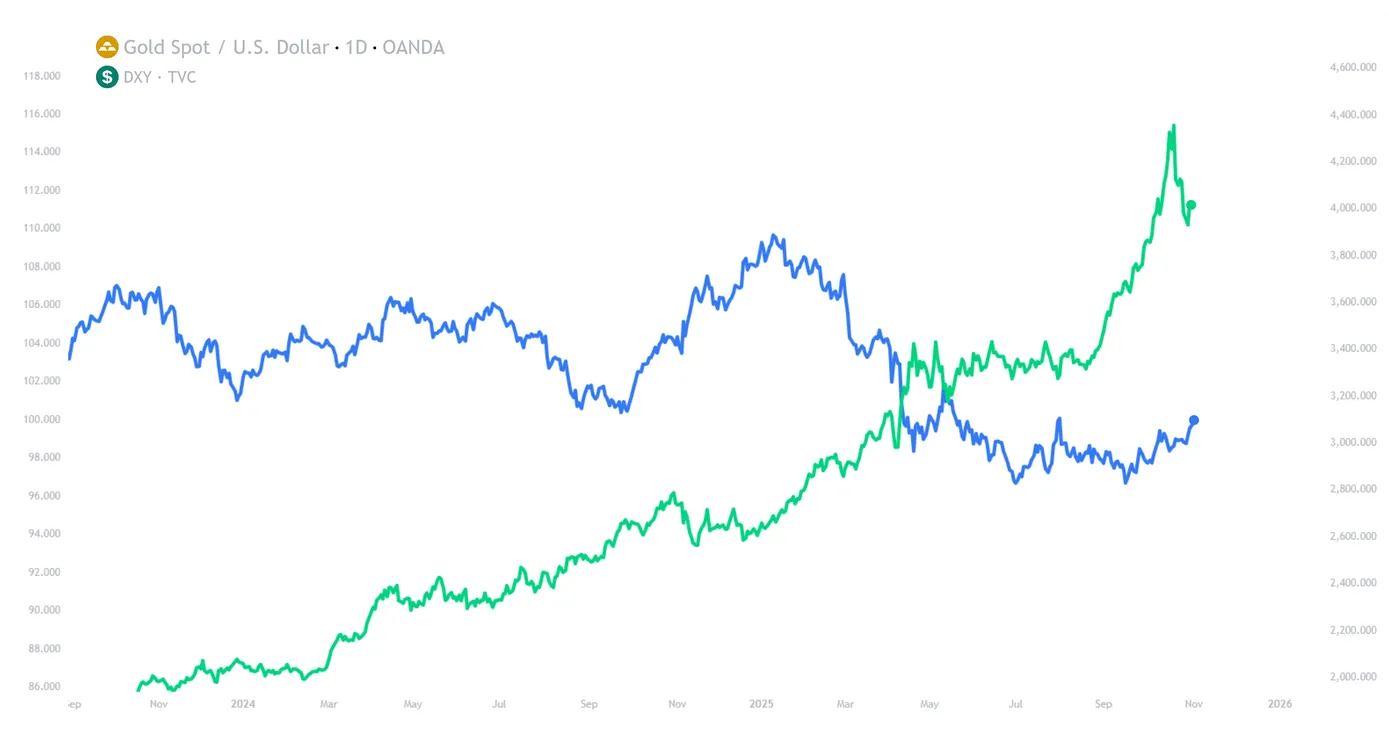
Gold (XAU/USD) vs Dollar Strength Index (DXY), D1, OANDA & TVC, TradingView,
Gold (XAU/USD): Fundamental Analysis 03/11/2025
Hawkish commentary from Fed Chair Powell: Starting with the most significant of the three themes, last week’s interest cut of 25 basis points by the Federal Reserve was met with hawkish commentary from Jerome Powell, citing a need for “data-driven caution”.
These comments come at an interesting time, within the context of a full US government lockdown, where data that the Fed would otherwise rely on to guide its decisions, such as PCE, CPI, and NFP, is entirely unavailable.
The ongoing government shutdown is now only two days shy of being the longest in history, currently at 34 days.
Therefore, considering Powell’s comments, markets have somewhat repriced the probability of a December rate cut from approximately 90% down to 70%, with some surprised at the Fed Chair’s hawkish undertones.
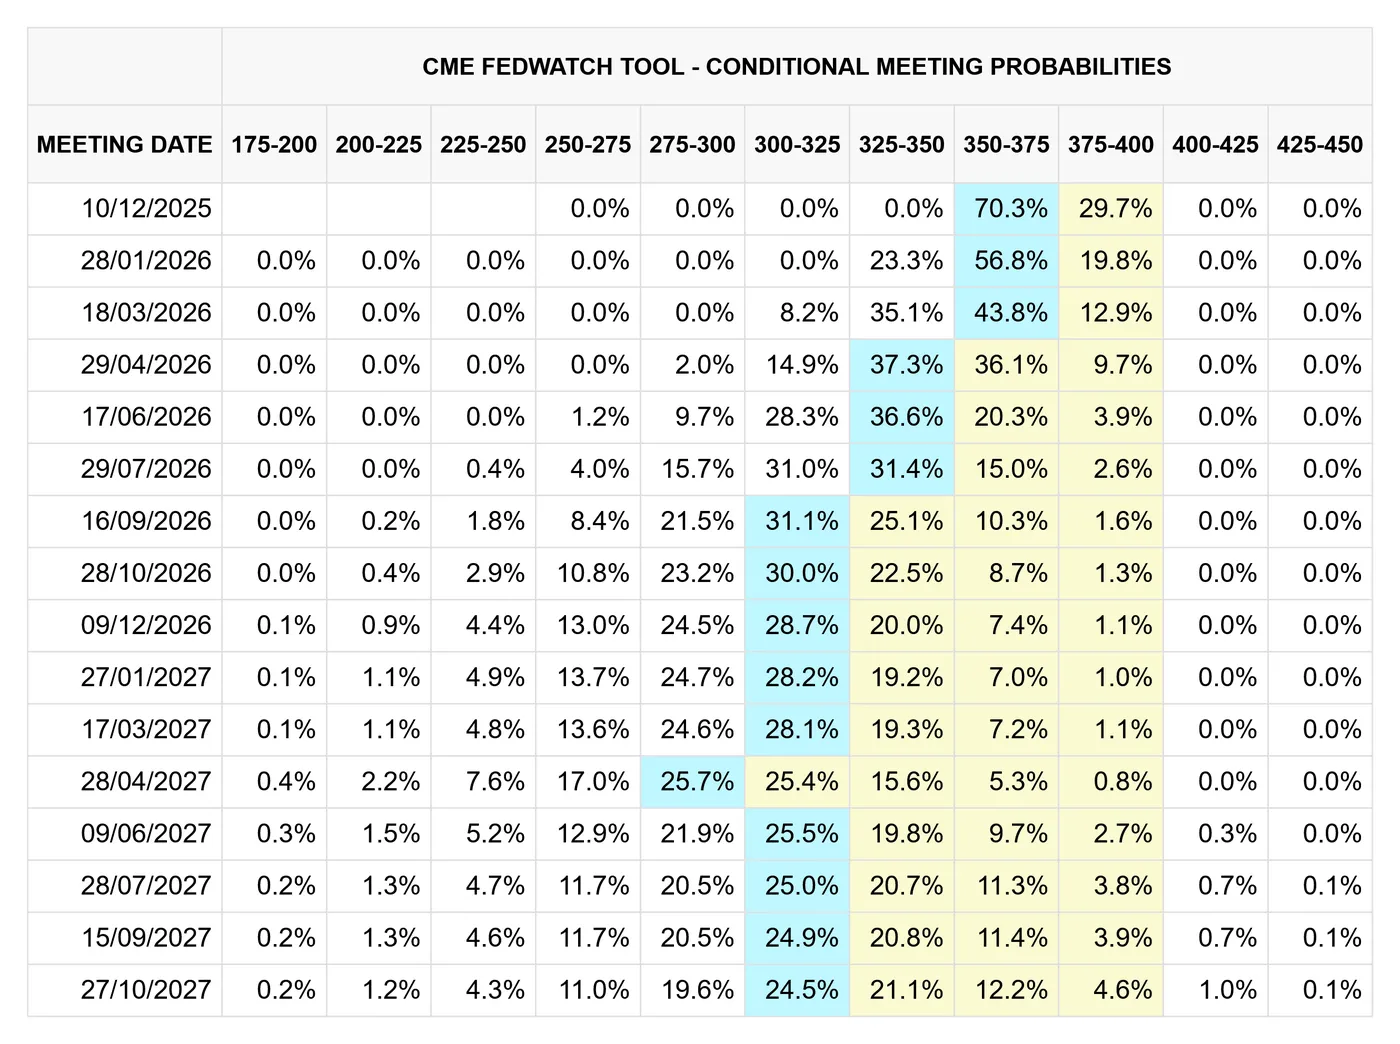
CME FedWatch, 03/11/2025
Although markets still overwhelmingly predict rates will be cut in the Fed’s final decision of 2025, the notion that the Federal Reserve is becoming more hawkish directly challenges the current gold rally, with lower interest rates favouring higher bullion prices.
With Stephen Mirran speaking earlier today, notably more dovish amongst his fellow policymakers, markets will continue to refine expectations ahead of December 10th.
Rising dollar and increasing bond yields: Now I’ve set up the premise of a more hawkish Fed than once thought, a further two knock-on effects have been the following:
- A rally in dollar pricing, which now trades at 3-month highs
While it is possible for metals to rally alongside a strengthening dollar, rising USD value makes gold more expensive to buy with non-dollar currencies, hurting international investment.
- Rising short-term bond yields, with the 10YR rising to 4.11%, its highest level since early October
This increases the attractiveness of holding government debt when compared to precious metals, hurting bullion pricing
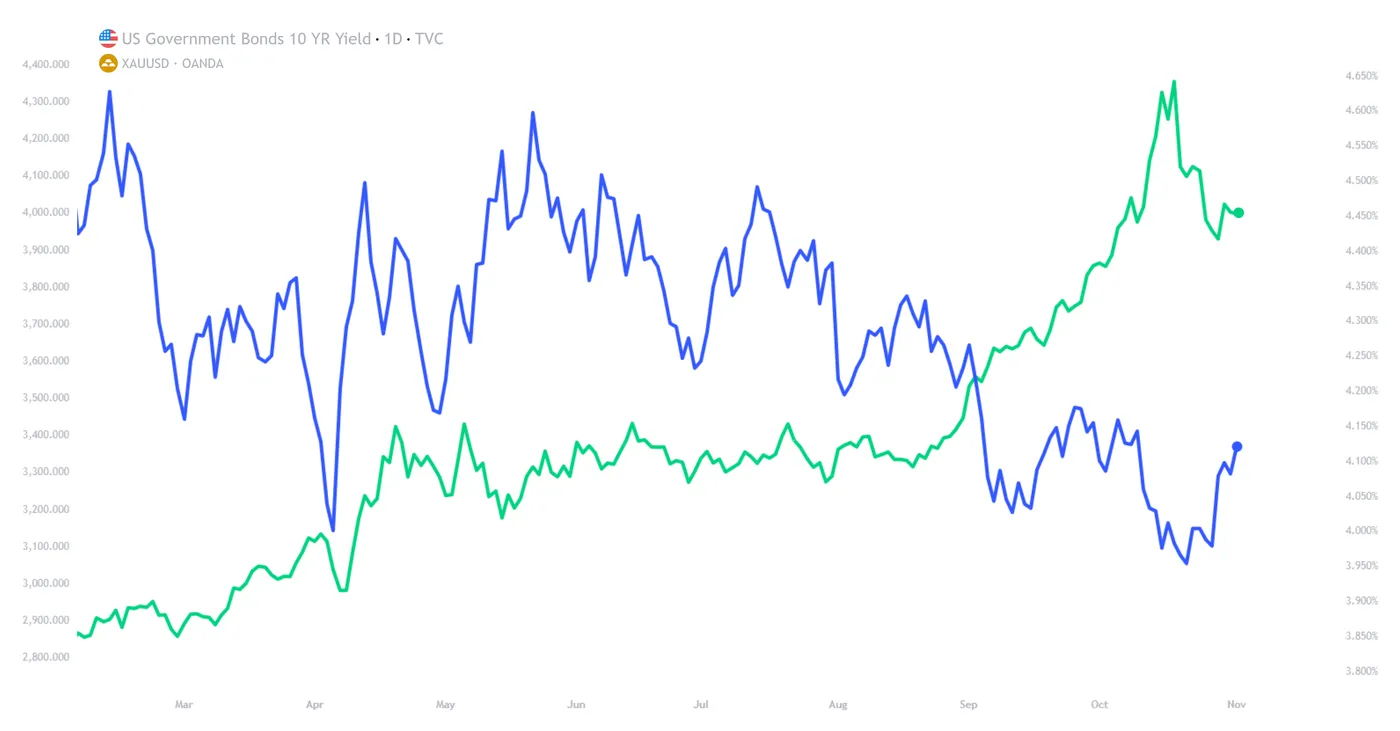
Gold (XAU/USD) vs US 10-Year Bond Yield (US10Y), D1, OANDA & TVC, TradingView, 03/11/2025
Put simply, a more hawkish Fed often means higher interest rates, which is inherently bad for gold pricing.
Easing of US-China tensions: To conclude our fundamental analysis for today, it would be remiss not to mention how easing tensions between President Xi and President Trump has effectively removed a significant headwind that was otherwise offering upside to gold pricing.
Following the recent agreement on a tariff truce, the risk premium priced into gold has been significantly reduced, resulting in lower pricing.
Gold (XAU/USD): Technical Analysis 03/11/2025
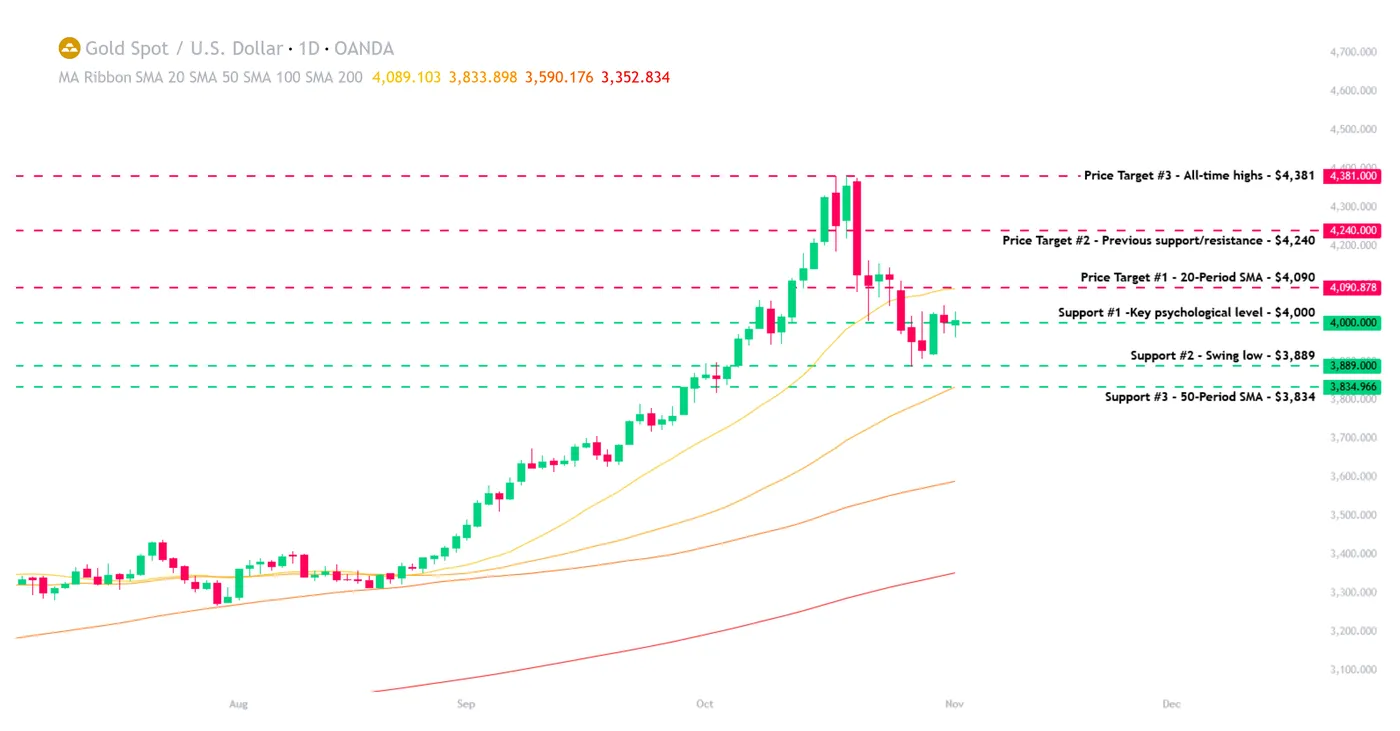
XAUUSD, D1, OANDA, TradingView, 03/11/2025
As stipulated in my commentary a couple of weeks ago, gold did breach the key psychological level of $4,000 and continued lower to the first resistance level of approximately ~$3,889.
What’s happened since, however, is more a following of the first scenario:
Gold price action will form a base, consolidate, and stage another leg higher, aiming to overcome resistance held at ~$4,240
Technically, gold remains well supported at both $4,000 and $3,889, although a move below the latter could spell trouble for gold pricing, with the next stop being at the 50-period SMA.
To the upside, which bulls will be keen to hear, we can expect our next reasonable price target to be at the 20-period moving average, roughly at $4,090.
Otherwise, our secondary target would be at the previous support-turned-resistance level at $4,240, and then aim to surpass the all-time high of $4,381.
Price targets and support/resistance levels:
- Price target #1 - 50-period SMA - $4,090
- Price target #2 - Previous support turned resistance - $4,240
- Price target #3 - All-time highs - $4,381
- Support #1 - Key psychological level - $4,000
- Support #2 - Swing low - $3,889
- Support #3 - 50-period SMA - $3,834
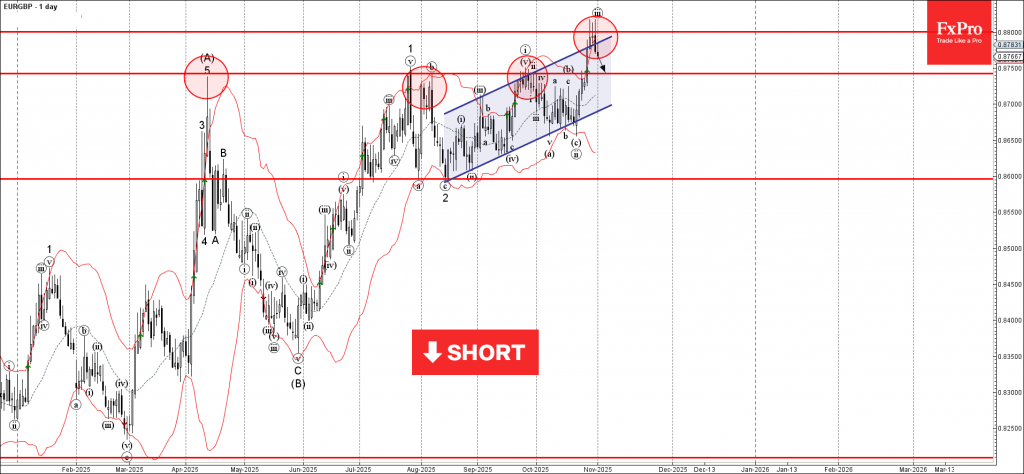
EURGBP Wave Analysis
EURGBP: ⬇️ Sell
- EURGBP reversed from resistance zone
- Likely to fall to support level 0.8750
EURGBP currency pair recently reversed from the resistance zone between the resistance level 0.8800, resistance trendline of the daily up channel from September and the upper daily Bollinger Band.
The downward reversal from resistance level 0.8800 created the daily Japanese candlesticks reversal pattern Evening Star Doji – with the middle candle being Shooting Star.
Given the strength of the resistance level 0.8800, EURGBP currency pair can be expected to fall to the next support level 0.8750, former strong resistance from April, July, August and September.