
Sample Category Title
Fed’s Miran warns policy too tight amid credit market stress
Fed Governor Stephen Miran cautioned that U.S. monetary policy may already be too restrictive, arguing that the neutral rate sits “quite a ways” below the current stance. Speaking with Bloomberg TV, Miran said his relatively sanguine view on inflation suggests there is “no reason for keeping policy as restrictive” .
Miran also highlighted emerging strains in credit markets as a warning sign that policy may have overshot. He noted that “a series of seemingly uncorrelated credit problems” surfacing across sectors indicates financial stress that was previously masked by strong headline data.
“The longer you keep policy restrictive, the more you run the risk that monetary policy itself causes a downturn,” Miran warned.
Dollar Regaining Authority
- Market fears did not materialise
- The shutdown helps the US dollar
- The yen became October’s outsider
- The Bank of England may cut rates
October was the second-best month of the year for the US dollar. The weakness of its main competitors, the hawkish rhetoric of the Fed, the continuing rally in stock indices and the confident US economy allowed the dollar index to record its strongest performance since July. The main outsiders among the G10 currencies on Forex were the Japanese yen and the British pound.
In the first half of the year, the US dollar lost about 10%. Investors believed that tariffs would accelerate inflation and slow economic growth. Coupled with Donald Trump’s pressure on the Fed, this would lead to an aggressive cut in the federal funds rate and capital flight from the US stock market. All these gloomy forecasts are slow to materialise. This allows investors to return to the greenback.
According to Jerome Powell, the Fed will not rush to cut rates. The shutdown is forcing the central bank to be cautious. The government shutdown could be the longest in history. The longer it lasts, the less likely it is that rates will be cut in December, which is better for the dollar.
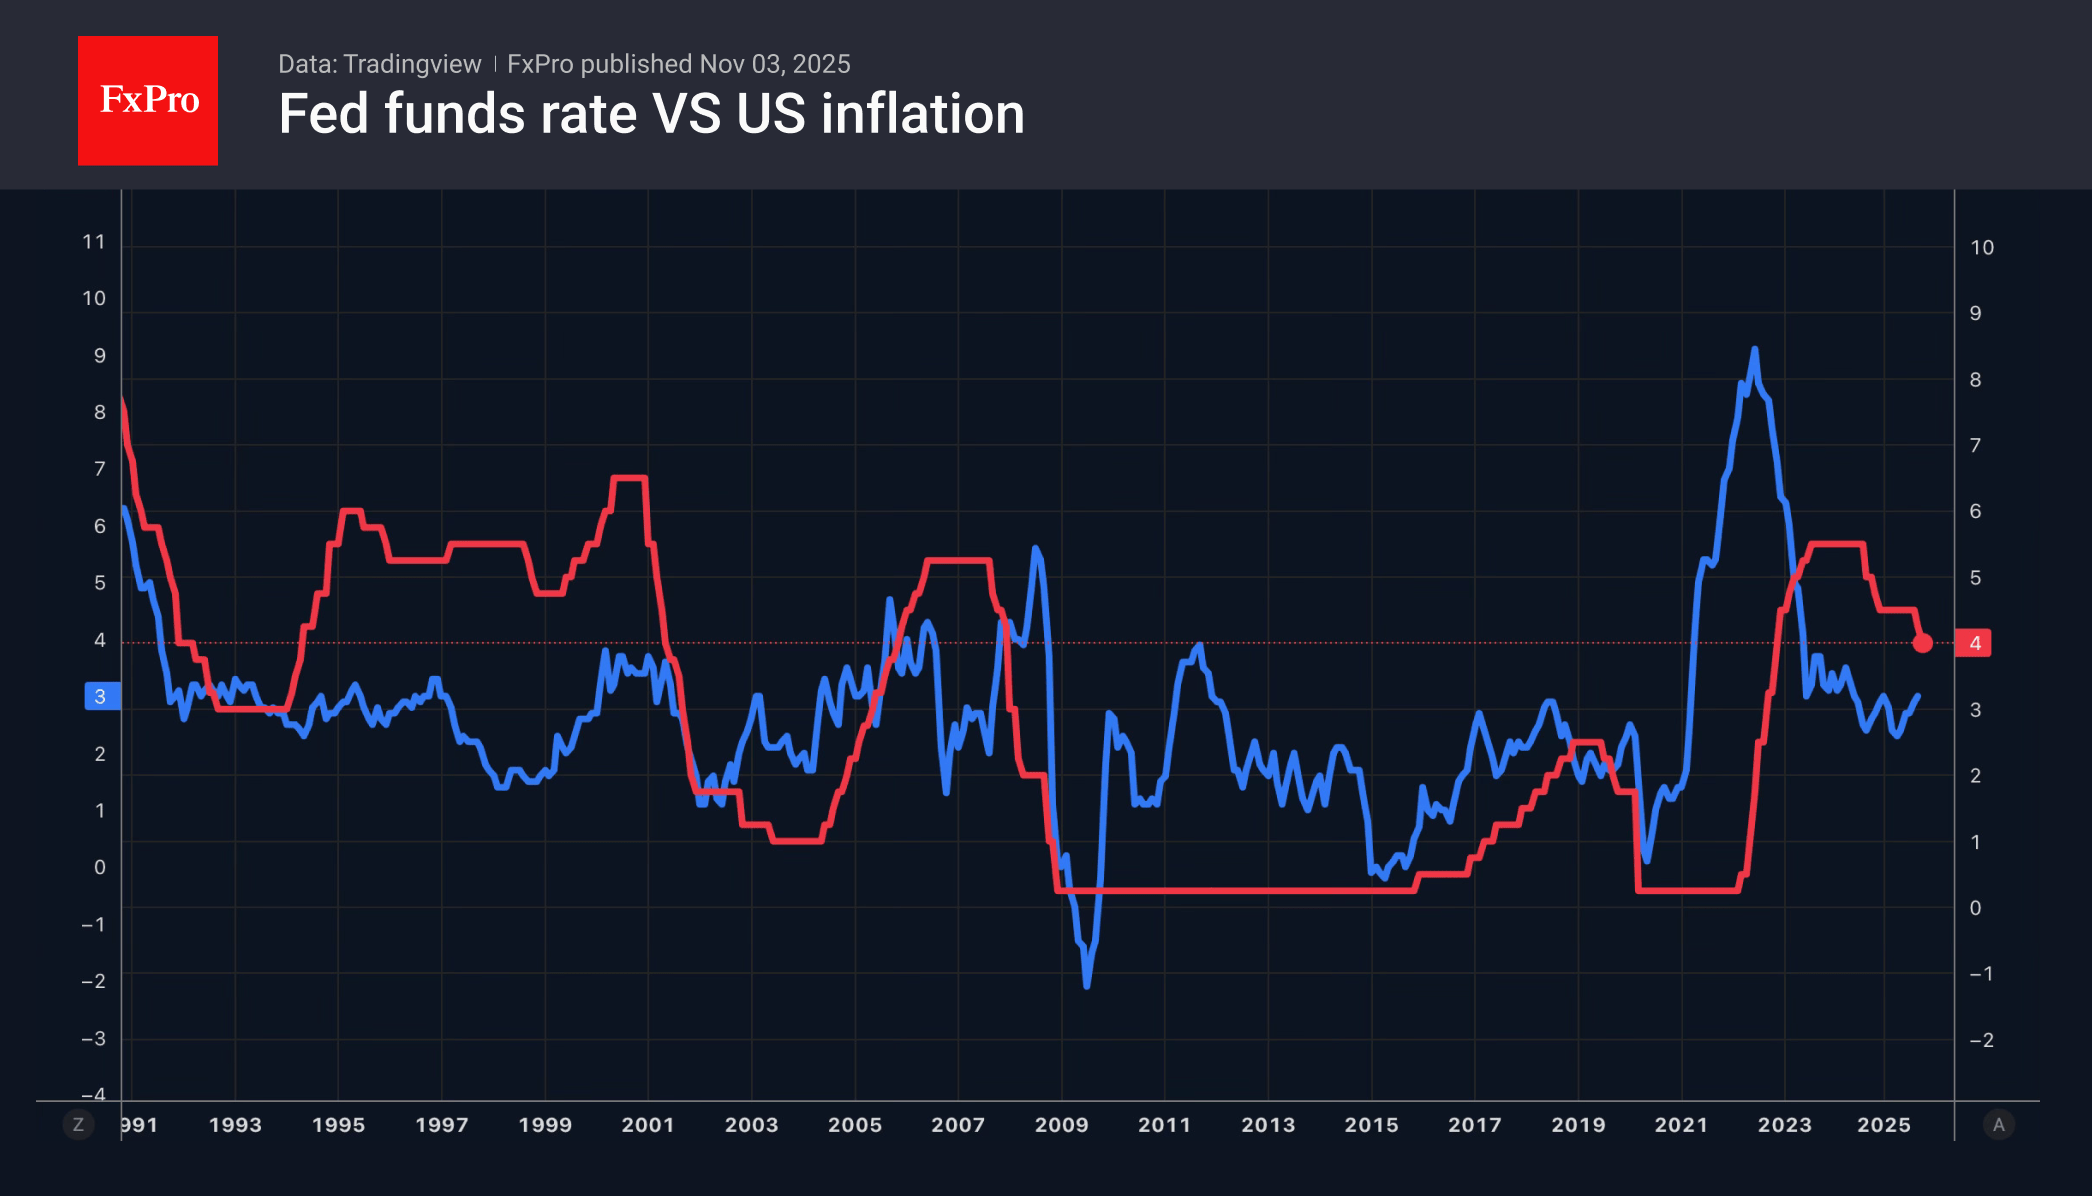
Pantheon Macroeconomics believes that the reasons for the resilience of the US economy lie in lower tariffs. Nominally, the average rate exceeds 17%. In fact, companies pay about 12.5%. Currently, tariffs generate approximately $34 billion per month, or around $400 billion per year, for the American budget. Scott Bessent previously stated a figure of between $500 billion and $1 trillion.
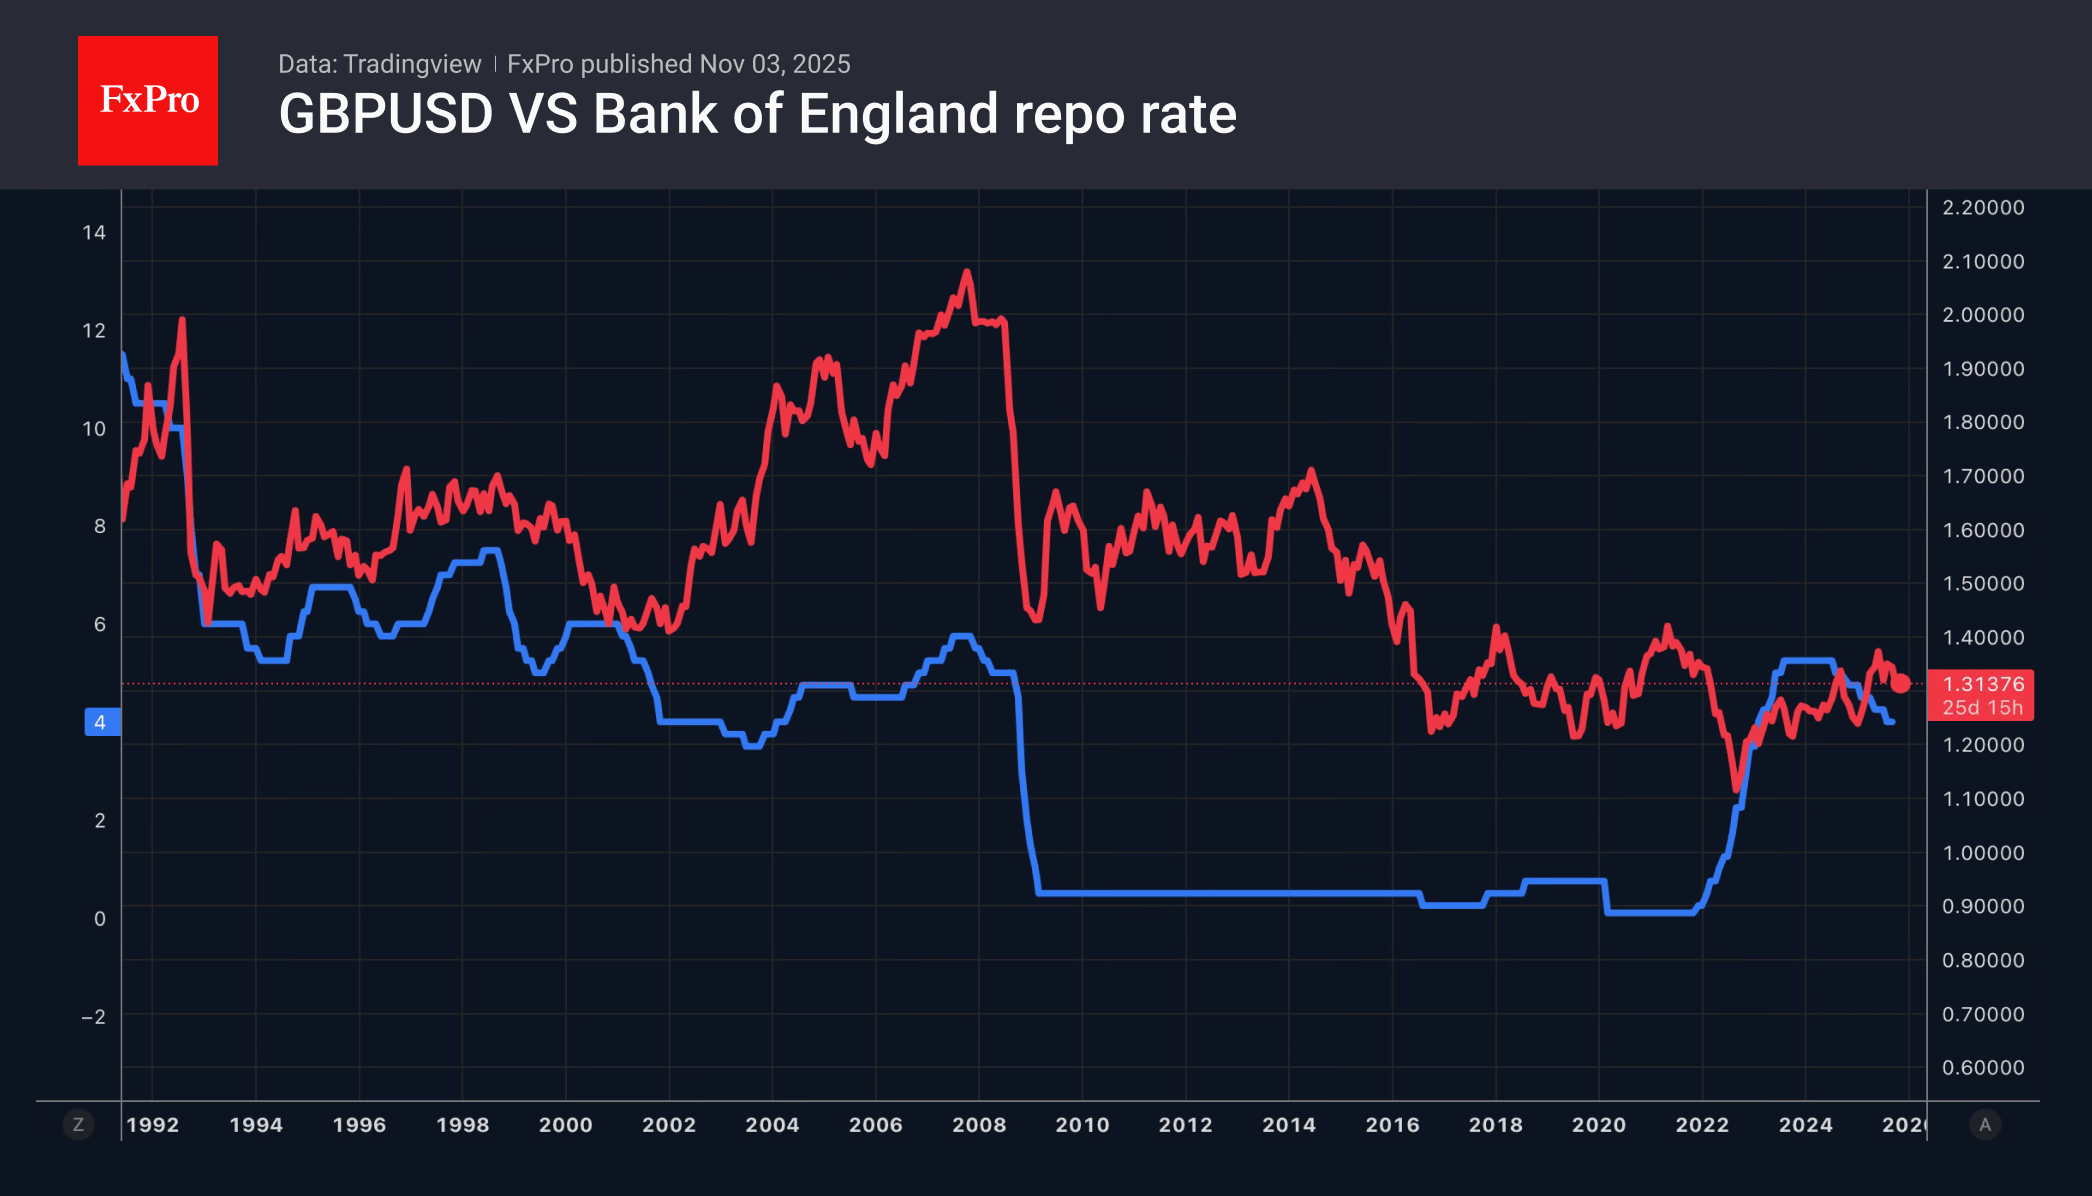
The yen weakened due to the Bank of Japan’s reluctance to raise rates. Investors fear that this is happening under pressure from the new government. The pound is losing ground due to fears of imminent tax increases and government spending cuts. The Treasury needs to plug a £35-40 billion hole in the budget. In fact, it may turn out to be even bigger. As a result, GDP growth will slow down, and the Bank of England will be forced to ease its monetary policy.
Goldman Sachs is calling on the BoE to cut rates at its meeting on 6 November. The futures market estimates the chances of this outcome at 1 in 3. At the same time, the split in the MPC signals that the central bank may indeed return to cutting rates. As a result, GBPUSD fell below 1.31 at the end of the week, its lowest level since April.
EUR/USD: Consolidation Likely to Precede Push Through Important 1.1500 Support Zone
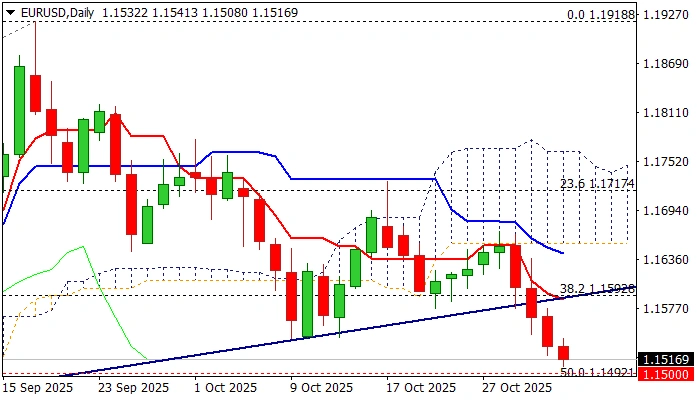
The Euro continues to trend lower and pressures 1.1500 support zone (round-figure / 50% retracement of 1.1065/1.1918 rally) in early Monday’s trading.
The bear-leg that emerged from a double bull-trap at the base of thick daily cloud, extends into fourth consecutive day.
Break below former higher base (1.1542) completed bearish failure swing pattern on daily chart that adds to bearish near-term outlook.
The notion is supported by strengthening bearish momentum and diverging daily Tenkan / Kijun-sen in bearish setup and converging 55/100DMA’s in attempt to create a bear-cross.
Break of 1.1500 zone to spark further weakness and expose 1.1400 support zone (Fibo 61.8% / higher base of July 30 / Aug 1).
Meanwhile, bears may face headwinds at 1.1500 zone due to oversold conditions and position for fresh push lower, with extended upticks to be capped under 1.1590 zone (broken trendline support / broken Fibo 61.8% / falling 10DMA).
Stronger dollar on the recent Fed’s hawkish cut, which eased bets for December rate cut, continue to pressure Euro, as the US central bank is likely to miss again key report from the labor sector due to prolonged government closure.
This may keep the Fed on hold until getting clearer picture of the situation in the sector, as the already expressed concerns about inflation which still hold well above the target.
Res: 1.1542; 1.1590; 1.1611; 1.1640.
Sup: 1.1500; 1.1446; 1.1391; 1.1322.
Crypto Market Attempting to Break Through Local Bottom
Market Overview
The crypto market cap has fallen by 7.7% over the last seven days to $3.6 trillion. The market’s return to Thursday’s local lows indicates that the bulls lack significant strength, which may encourage the bears at the start of the week. Cap has now fallen back to its 200-day moving average. Its last touch at the end of June triggered a growth impulse, pushing it to new highs. However, we are now more inclined to see a repeat of the spring scenario with a decline below this level, possibly by 15-20%.
Bitcoin started the week and month with another attempt to dip below the 200-day moving average, falling back to $107K. The ongoing testing of support since the second half of October is a significant reason for our caution regarding the market in the near term. The most pessimistic scenario would be realised in the event of simultaneous pressure on the stock markets and a strengthening of the dollar. But optimists may also note the sequence of higher lows at the peaks of the sell-off.
Bitcoin fell 4.5% in October to $109.5K, defying the seasonal trends of one of the best months of the year. BTC failed to grow this month for the first time since 2018. From a seasonal perspective, November is considered a relatively bullish month for BTC. Over the past 14 years, Bitcoin has ended this month with growth in nine out of 12 cases. The average increase was 24%, and the average decline was 16.8%.
News Background
During the month, $0.57 billion (+4.1%) was invested in spot Ethereum ETFs in the US, but ETH fell 8% in October.
The inflow into the newly launched Solana ETFs in the US continued for four consecutive days. According to SoSoValue, the net inflow into SOL ETFs amounted to $199.2 million for the week. There are only two players in the segment so far — the new BSOL from Bitwise and the converted GSOL from Grayscale.
Technical analyst Peter Brandt has opened sales on Bitcoin futures. In his opinion, a ‘megaphone’ pattern has formed on the BTC chart, which usually heralds a price drop.
Bitcoin is expected to continue experiencing cyclical fluctuations, and over the next two years, its price could decline by 65–70%, according to Sigma Capital. However, in 10 years, the value of digital gold is expected to exceed $1 million.
Long-term XRP holders have been increasing their sales of the token in recent months. Since the beginning of August, the daily sales volume of XRP by hodlers has grown by 580% to $260 million, according to Glassnode. A similar trend can be observed among short-term holders. At the same time, large addresses have begun to accumulate the asset.
Tether has made more than $10 billion in profits since the beginning of the year, the company said. Investments in US Treasury bonds reached a historic high of $135 billion.
XAG/USD Analysis: Price Stabilises Below the Psychological Level
October proved exceptionally volatile for the silver market — the price broke past a historical record, climbing above $50. However, after widespread profit-taking, the market reversed downward.
XAG/USD is currently influenced by several factors:
→ prospects for Federal Reserve policy;
→ the easing of trade tensions between the United States and China;
→ the potential government shutdown and related news.
As indicated by the ATR indicator, volatility is declining — suggesting that supply and demand forces may be finding a balance.
Technical Analysis of the XAG/USD Chart
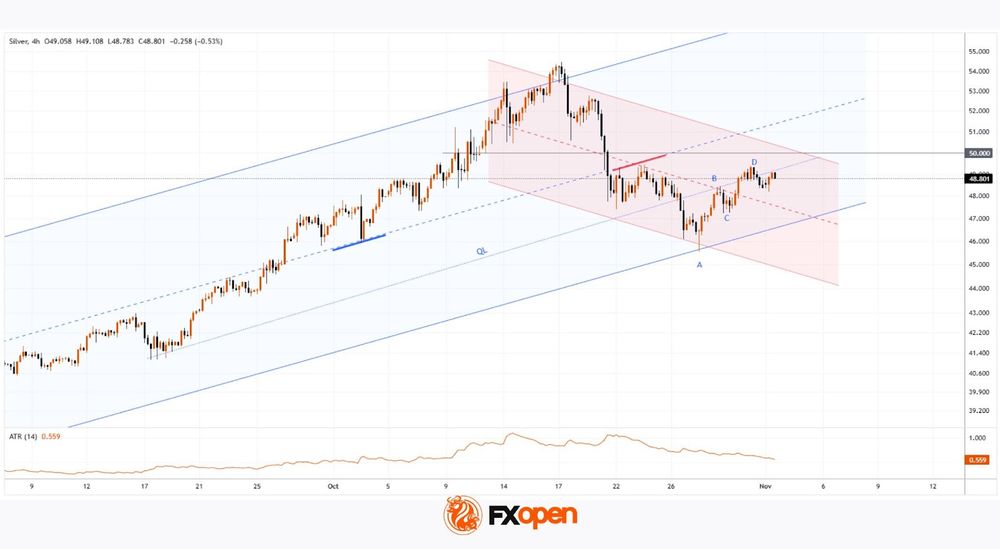
The broad upward channel remains intact, though it is worth noting that its median line has shifted from acting as support to serving as resistance.
From a bullish perspective:
→ the lower boundary of the channel acts as strong support;
→ the bullish A-B-C-D structure indicates that demand is recovering.
From a bearish perspective: if the silver price continues to rise, it will face resistance at:
→ the psychological $50 mark;
→ the 21 October drop zone, where selling pressure previously dominated.
Given the above, it is reasonable to assume that:
→ in the near term, the price may consolidate around the QL line;
→ if bearish momentum resumes, the alternative downward channel (shown in red) will gain relevance.
Start trading commodity CFDs with tight spreads. Open your trading account now or learn more about trading commodity CFDs with FXOpen.
This article represents the opinion of the Companies operating under the FXOpen brand only. It is not to be construed as an offer, solicitation, or recommendation with respect to products and services provided by the Companies operating under the FXOpen brand, nor is it to be considered financial advice.
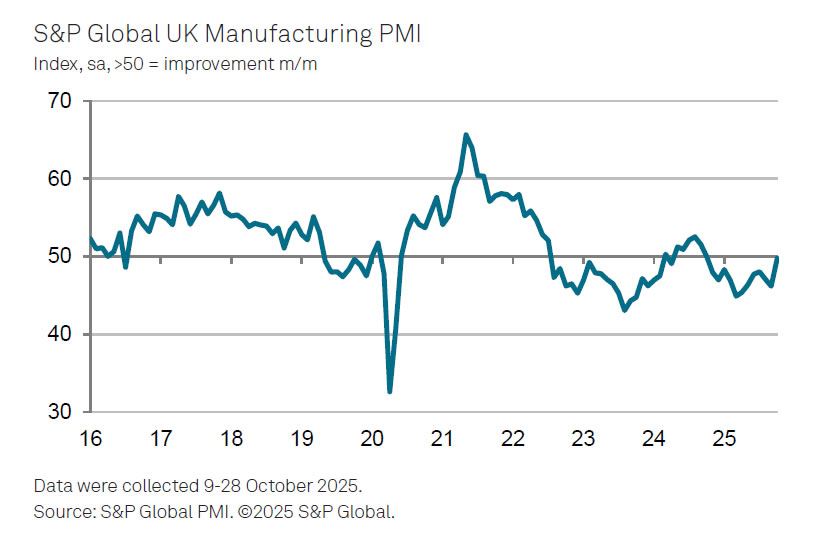
UK PMI manufacturing finalized at 49.7, Budget may deepen structural strain
UK manufacturing showed tentative signs of life in October, with the final S&P Global PMI rising to 49.7 from September’s 46.2. However, the improvement remains fragile as sluggish demand and stock adjustments drove much of the uptick rather than a sustained pickup in new orders.
Rob Dobson, Director at S&P Global Market Intelligence, said the October survey was encouraging but cautioned that the rebound “could prove short-lived.” Output growth largely stemmed from manufacturers working through backlogs and allowing inventories to build amid weak demand at home and abroad.
Dobson added that upcoming fiscal developments could complicate the outlook further. Many firms worry that the forthcoming Budget may aggravate structural challenges left by last year’s policy tightening, weighing on confidence even as activity improves. Business optimism rose to an eight-month high but remains below its long-run average.
EUR/USD Under Sustained Pressure as Markets Await Key Data
The EUR/USD pair is declining for a fourth consecutive session, edging closer to the 1.1532 level. Investor sentiment remains cautious as markets digest recent trade developments and await a slew of high-impact economic data.
Over the weekend, the White House announced a de-escalation in trade tensions with China. Beijing has agreed to suspend additional export restrictions on rare earth metals and end investigations into US semiconductor companies. In return, the US will freeze certain existing tariffs and cancel a planned 100% tariff hike on Chinese exports. This decision follows last week's summit between Donald Trump and Xi Jinping, which aimed to stabilise bilateral relations.
Meanwhile, the protracted US government shutdown continues to delay the release of official key statistics, notably employment data. In their absence, market participants will seek guidance from private-sector indicators due in the coming days, including the ADP employment report, the ISM Services PMI, and the University of Michigan Consumer Sentiment Index.
This comes after the Federal Reserve's expected 25-basis-point rate cut last week. Chair Jerome Powell maintained a cautious stance, emphasising that a follow-up cut in December is not a foregone conclusion – a message that has provided underlying support for the US dollar.
Technical Analysis: EUR/USD
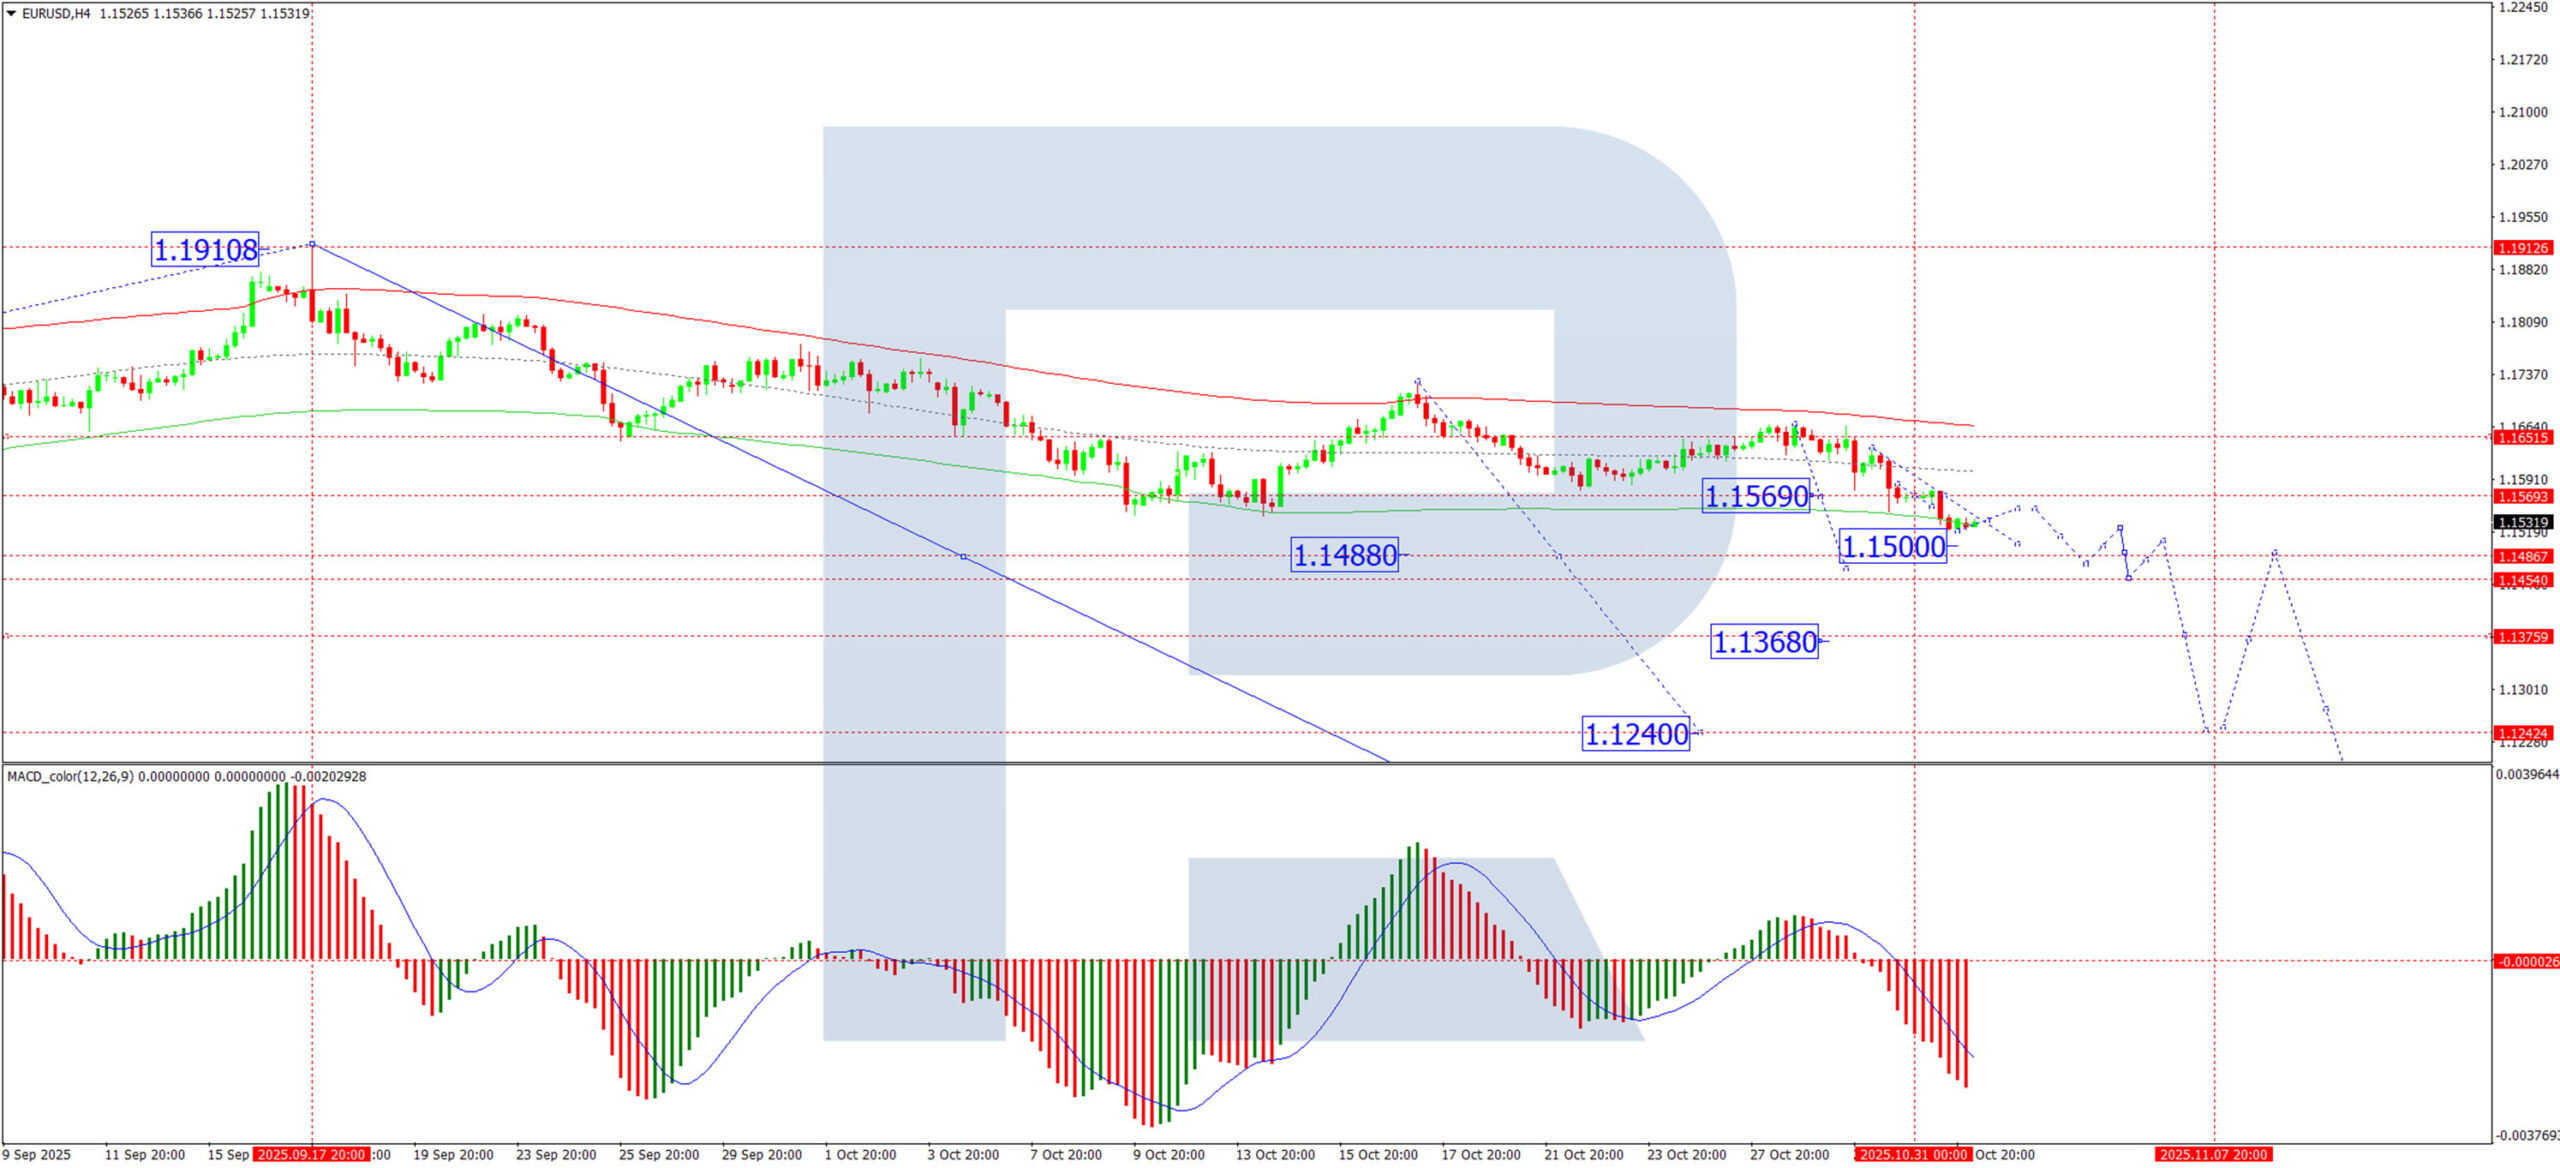
H4 Chart:
On the H4 chart, EUR/USD formed a tight consolidation range around 1.1569. A subsequent downward breakout completed a bearish wave to 1.1521, and the pair is now consolidating above this local low.
A technical rebound to retest 1.1569 from below is a possibility. However, with bearish momentum still intact, we anticipate a further decline towards 1.1500 following any such pullback. The broader target for this move is 1.1488, which is viewed as the first leg of the third and typically strongest wave within the prevailing downtrend. The MACD indicator confirms this outlook, with its signal line positioned below zero and pointing decisively downward, reflecting sustained selling pressure.
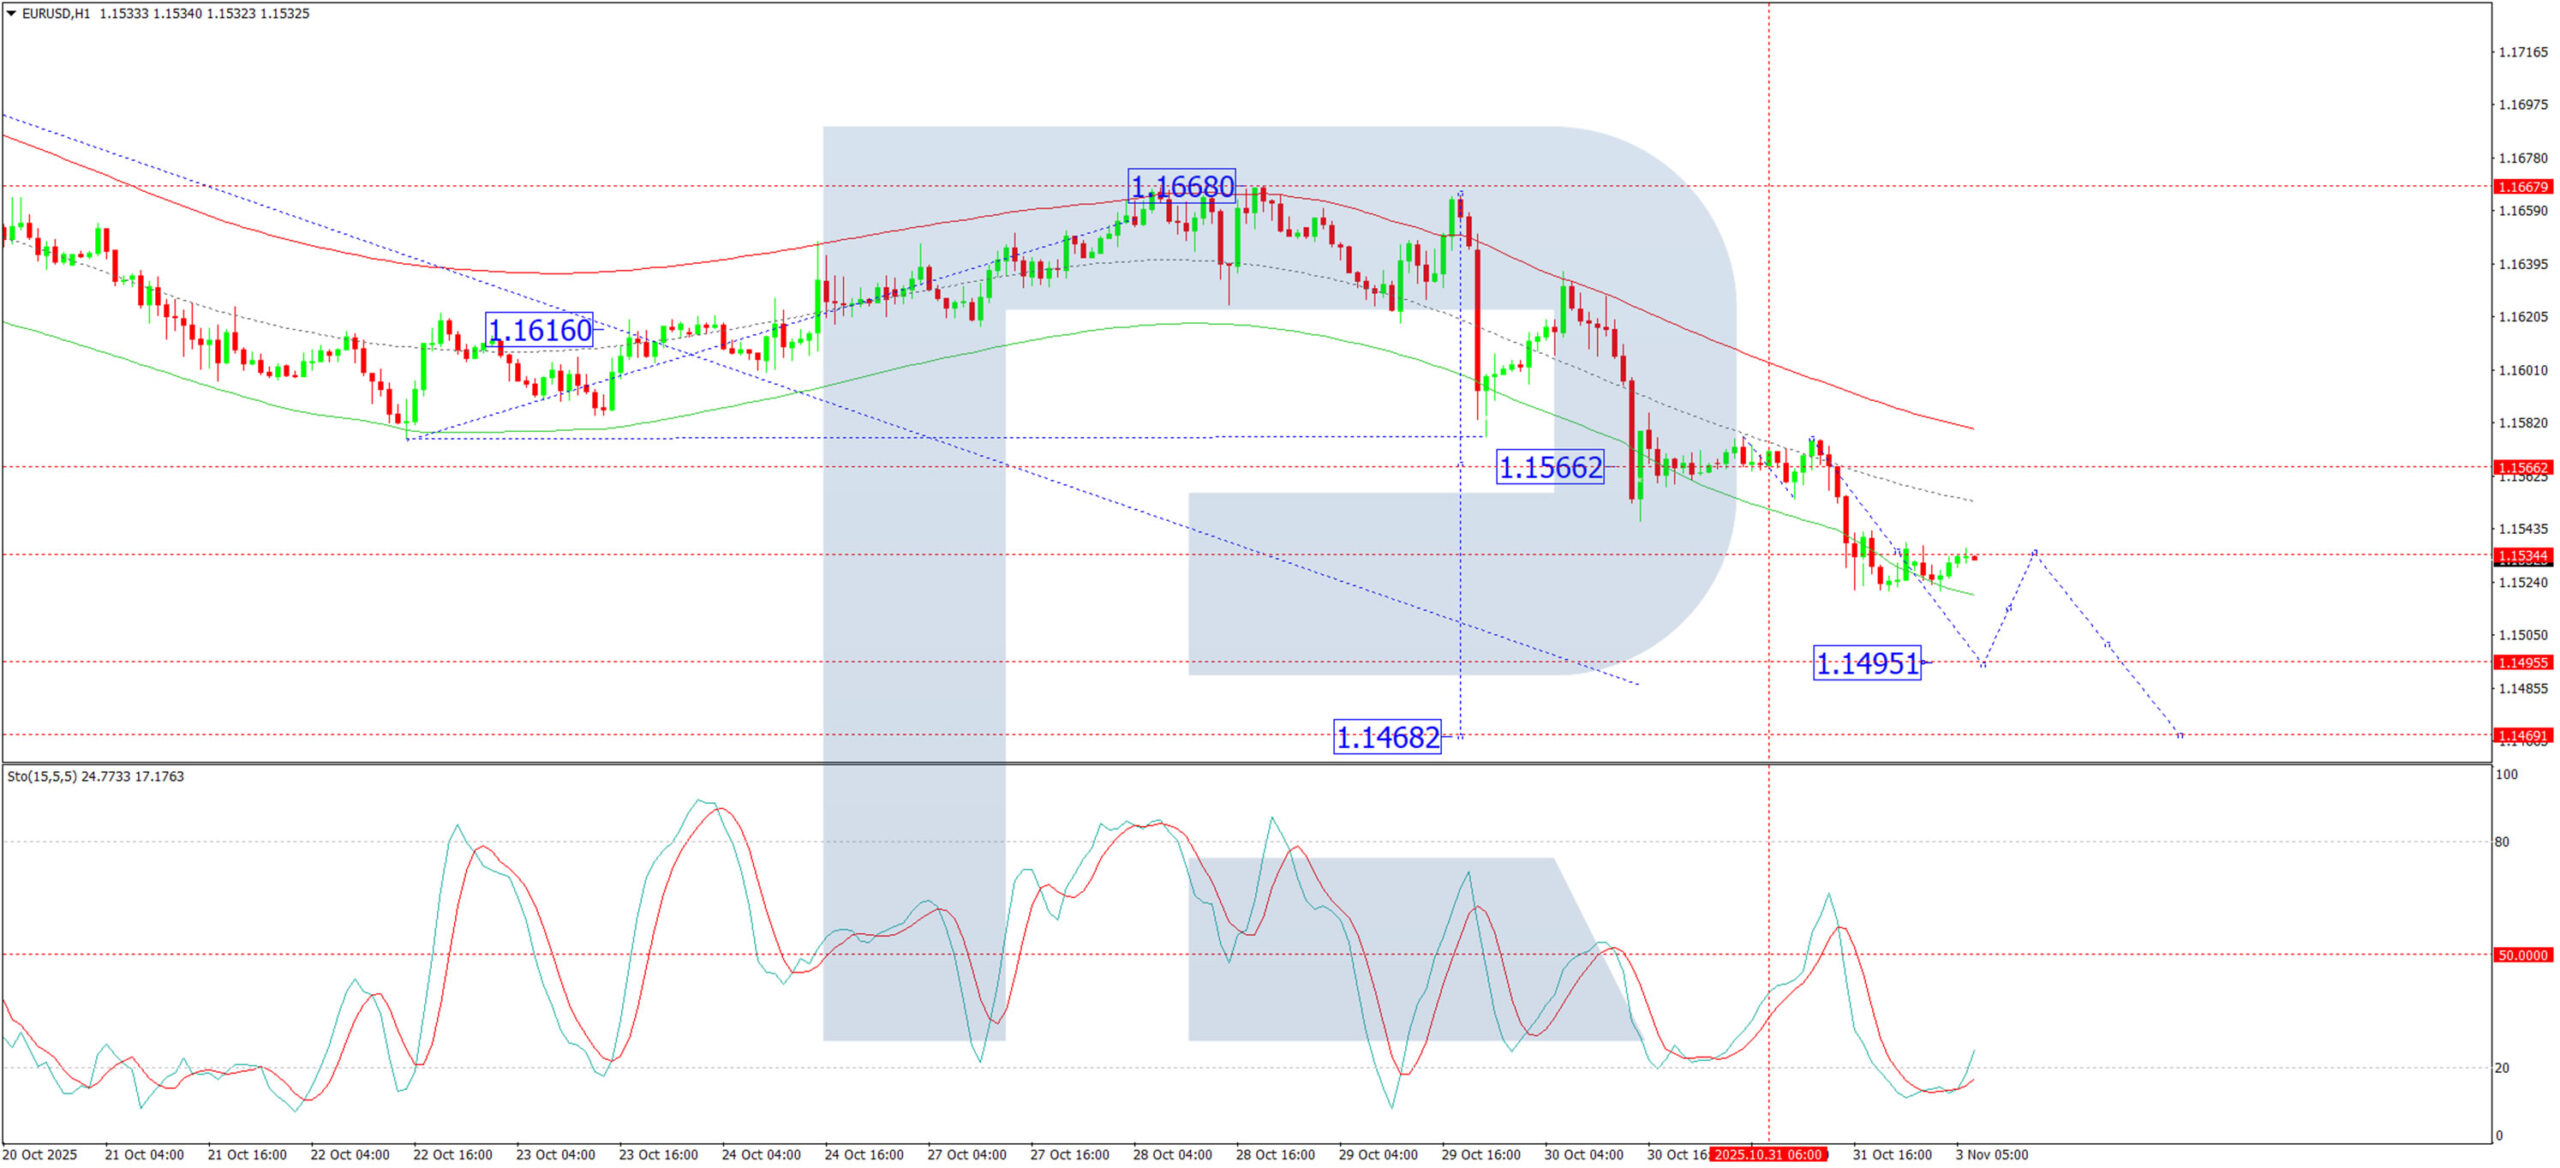
H1 Chart:
On the H1 chart, the pair broke downwards from a consolidation range around 1.1566, achieving its initial target at 1.1495. Once this level is reached, a corrective bounce towards 1.1533 is likely before the resumption of the downtrend towards 1.1468.
This scenario is supported by the Stochastic oscillator, whose signal line is below 50 and is falling confidently towards the 20 zone, indicating that short-term downward momentum remains dominant.
Conclusion
EUR/USD remains under clear selling pressure, with a de-escalation in US-China trade tensions and a cautiously hawkish Fed stance providing a supportive backdrop for the US dollar. Technically, the structure is bearish, suggesting that any near-term rebounds are likely to be corrective within a broader downtrend, with key downside targets at 1.1488 and 1.1468.
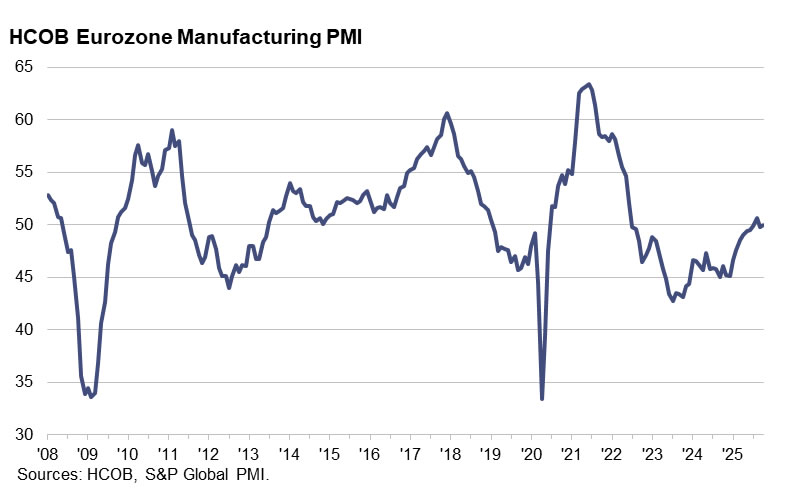
Eurozone PMI manufacturing at 50.0, very delicate sprout of economic recovery
Eurozone manufacturing activity barely expanded in October, with the final HCOB PMI coming in at 50.0, up marginally from 49.8 in September. National readings showed uneven trends: Greece and Spain led with readings above 52, while Germany (49.6) and Italy (49.9) hovered just below the neutral mark. France and Austria remained in contraction, both at 48.8.
Cyrus de la Rubia, Chief Economist at Hamburg Commercial Bank, described the improvement as a “very delicate sprout of economic recovery.” Output has risen for eight consecutive months, but new orders remain stagnant, suggesting that growth lacks momentum. The survey also showed that overall demand across the Eurozone remains subdued, with factories struggling to generate fresh business despite tentative output gains.
The regional breakdown highlights persistent divergence. Germany’s factory sector remains fragile, France’s is in recession, and Italy’s shows only persistent weakness. Meanwhile, Spain’s moderate expansion stands out but offers limited offset. De la Rubia warned that France’s political tensions and renewed production slump are weighing on cross-border demand, acting as a drag on its trading partners and complicating hopes for a broader industrial rebound heading into year-end.
AUD/USD Softens, NZD/USD Faces Fresh Selling Pressure
AUD/USD is consolidating gains near 0.6550. NZD/USD is trimming gains and struggling to stay above the 0.5700 pivot zone.
Important Takeaways for AUD/USD and NZD/USD Analysis Today
The Aussie Dollar started a downside correction from 0.6620 against the US Dollar.
There was a break below a key bullish trend line with support at 0.6570 on the hourly chart of AUD/USD at FXOpen.
NZD/USD is declining from the 0.5800 resistance zone.
There is a short-term declining channel forming with resistance near 0.5730 on the hourly chart of NZD/USD at FXOpen.
AUD/USD Technical Analysis
On the hourly chart of AUD/USD at FXOpen, the pair started a fresh increase from 0.6480. The Aussie Dollar was able to clear 0.6550 to move into a positive zone against the US Dollar.
There was also a move above 0.6580 and the 50-hour simple moving average. Finally, the pair tested 0.6600. A high was formed near 0.6617 and the pair is now correcting gains. There was a move below 0.6600 and a key bullish trend line with support at 0.6570.
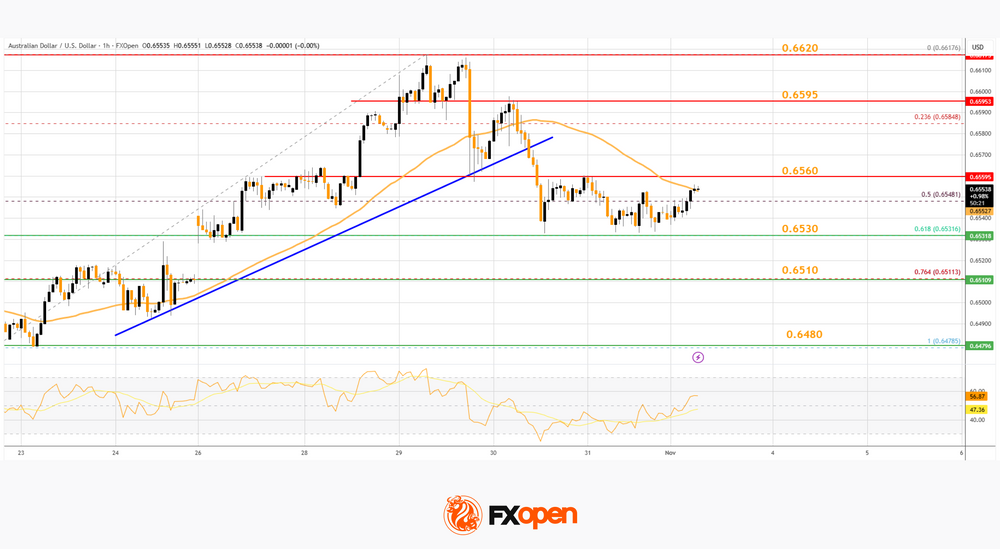
The pair declined below the 50% Fib retracement level of the upward move from the 0.6478 swing low to the 0.6617 high. On the downside, initial support is near the 61.8% Fib retracement at 0.6530.
The next key area to watch could be 0.6510. If there is a downside break below 0.6510, the pair could extend its decline toward 0.6480. Any more losses might signal a move toward 0.6420.
On the upside, the AUD/USD chart indicates that the pair is now facing hurdles near 0.6560. The first key breakout zone might be 0.6595. An upside break above 0.6595 might send the pair further higher. The next stop for the bulls could be 0.6620. Any more gains could clear the path for a move toward 0.6720.
NZD/USD Technical Analysis
On the hourly chart of NZD/USD on FXOpen, the pair attempted another wave above 0.5800 but failed. The New Zealand Dollar started another downward move from 0.5800 and dipped below 0.5750 against the US Dollar.
The pair settled below 0.5730 and the 50-hour simple moving average. It tested the 0.5710 zone and is currently consolidating losses below the 23.6% Fib retracement level of the downward move from the 0.5801 swing high to the 0.5711 low.
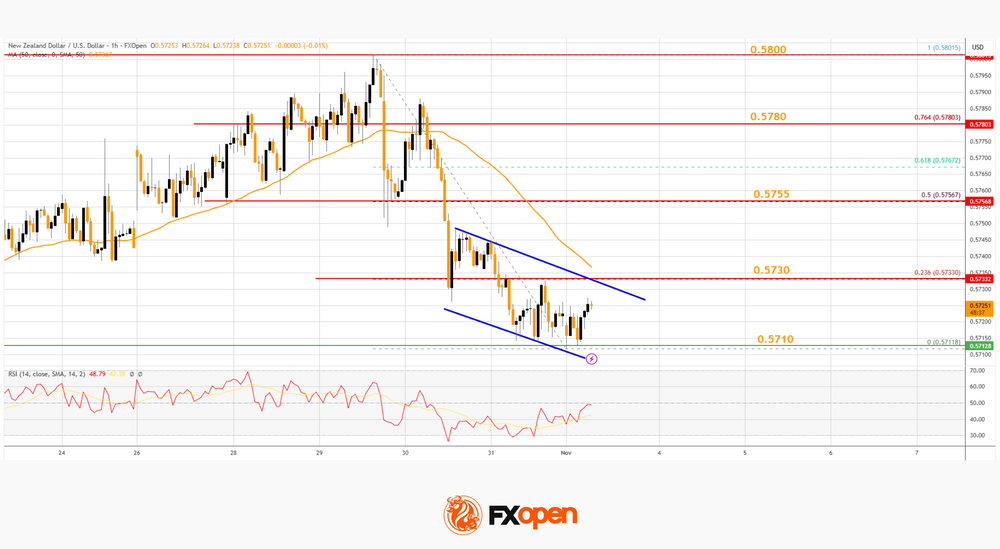
The NZD/USD chart suggests that the RSI is now near 50 and the pair is attempting to recover. On the upside, the pair might struggle near 0.5730, the 50-hour simple moving average, and a short-term declining channel.
A clear move above 0.5730 might even push the pair toward the 50% Fib retracement at 0.5755. Any more gains might clear the path for a move toward 0.5800 in the coming days.
On the downside, there is major support forming near 0.5710 and 0.5700. The next key area of interest might be 0.5650. If there is a downside break below 0.5650, the pair might slide toward 0.5620. Any more losses could lead NZD/USD into a bearish zone to 0.5580.
Trade over 50 forex markets 24 hours a day with FXOpen. Take advantage of low commissions, deep liquidity, and spreads from 0.0 pips. Open your FXOpen account now or learn more about trading forex with FXOpen.
This article represents the opinion of the Companies operating under the FXOpen brand only. It is not to be construed as an offer, solicitation, or recommendation with respect to products and services provided by the Companies operating under the FXOpen brand, nor is it to be considered financial advice.
Dollar Pushes Beyond First Technical Boundaries
Markets
The US dollar pushed beyond the first technical boundaries going into the weekly and monthly close. EUR/USD fell below the previous October low of 1.1542 last Friday, setting the stage for a revisit of the August trough at 1.1392. USD/JPY consolidated around 154 after a sharp rally the day before with a better bid yen counterbalancing overall USD strength. The trade-weighted dollar index hovered near three-month highs close to but below the psychologically important 100 barrier. Drivers supporting the greenback remain the same as the last couple of sessions. The Fed in particular gave a boost with its hawkish rate cut: a December follow-up move “is not a forgone conclusion – far from it”. It also triggered a kneejerk yield rebound. Both short-term and long-tenors had been looking for direction after nearing the lower bound of a downward trading range. In (technical) theory they have now further room to check the upper bound again, the long end in particular. Improving US-Sino trade relations are the second pillar of renewed USD strength and the third being a more fragile risk environment. While (US) stocks ended higher end last week, it was on a bumpy road and with instant profit-taking after the higher open. European equities finished lower (-0.65% for the EuroStoxx50). German rates grinded south with minor changes of no more than 2 bps. The ultra-long end underperformed (30-yr, +1.2 bps). French OATs slightly underperformed peers. France’s parliament approved a new version of Macron’s wealth tax in a move demanded by the Socialists. Lecornu’s minority government needs them to get the 2026 budget approved but Socialist support is still far from certain, despite Friday’s concession. Lecornu is moving to closed-door talks. Sterling prevented a close north of the EUR/GBP 0.88 level but held above the December 2023 low (EUR/GBP high) nonetheless. The technical picture remains GBP negative going into the Bank of England’s policy meeting on Thursday. A rate cut is for less than 30% discounted, a grave underestimation. Official inflation was lower than expected, including for food – a key element that shapes inflation expectations and which kept some policymakers reluctant to lower rates further. More timely indicators (eg. BRC’s October print last week) suggest food price rises to slow further. With UK prime minister Starmer very recently refusing to rule out income tax hikes (and breaking the manifesto pledge) to cut deficits, there’s an additional argument for the BoE to lean in. In the remainder of this week’s eco calendar we’ll look out for some much-needed input regarding the state of the US economy: October ISMs are on tap, along with the ADP job report and consumer confidence (Michigan). The JOLTS, weekly jobless claims and payrolls are once again affected by the government shutdown. The US Supreme Court on Wednesday is hearing the Trump administration’s appeal arguments for keeping the reciprocal (and some other) tariffs in place after lower courts ruled they were illegal. A slew of Fed and ECB speakers hit the wires.
News & Views
Ratingdog’s Chinese manufacturing PMI suggested growth in the sector slowed in October. The headline index for the third consecutive month printed above the 50 no-change threshold but eased from 51.2 to 50.6, indicating only marginal growth. A less pronounced increase in production and a slowdown in new order growth drove the decline. The report mentions ongoing better domestic demand to support new business, but at the same time external demand was said to have dampened the overall rate of growth. Export orders even fell at the fastest pace since May as respondents mentioned rising trading uncertainty. Concerns over the outlook for growth also led to a reduction in the level of optimism among goods producers. Despite slow(er) growth, the report mentions a slight increase in the rate of job creation. Input costs continued to rise, mainly related to higher raw material costs. But intense market competition was mentioned to force producers to offer discounts, leading to a further decline in average output prices. Average export charges declined for the first time since April.
At a virtual meeting on Sunday OPEC+ announced that it will implement a further production hike of 137k barrels per day from the 1.65 bln p/d adjustment that was announced in April 2023. The rise was of a similar amount as the ones implemented in October and November and will start December 1. Beyond that, the eight countries decided to pause the production increments in January, February, and March 2026, referring to a seasonal slowdown that usually takes place during that period. The pause also comes as sanctions on Russian oil exports add an additional factor of uncertainty in the market. The oil price this morning gains modestly with Brent oil trading near $ 65.2 p/b.