Sample Category Title
ISM Manufacturing to Steer Sentiment Before RBA, BoE Meetings
Trading was subdued in Asia today, with Japan closed for a public holiday and investors awaiting a series of major events later in the week. Aussie led mild gains, supported by positioning for a hawkish hold from the RBA on Tuesday. The British Pound, by contrast, stayed on the defensive as traders reduced exposure ahead of the BoE’s policy decision.
For the RBA, consensus is unanimous that the cash rate will remain at 3.60%, and last week’s upside inflation surprise has raised speculation that Governor Michele Bullock will sound more vigilant on price pressures. The market narrative has shifted from expecting cuts next year to debating how long the RBA would hold its restrictive stance, giving the Aussie an undercurrent of support into the meeting.
Sterling’s tone was softer as uncertainty lingered around the BoE’s Thursday announcement. While the majority expects a steady hold at 4.00%, a small but notable minority — including Goldman Sachs and Barclays — are calling for a 25-bp cut. That divergence has left traders reluctant to buy Sterling aggressively, preferring to hedge against the risk of a dovish surprise amid fragile U.K. growth prospects and fiscal strain.
Dollar opened the week on solid footing after ending October stronger, but the next few days could prove pivotal. A trio of key private-sector releases — ISM Manufacturing today, followed by ISM Services and ADP employment on Wednesday — will help gauge the economy’s resilience following the Fed’s hawkish cut last week. Robust readings could reinforce the case for the Fed to stay cautious into December, keeping yields elevated and Dollar supported.
Asian equities were mixed. South Korea’s KOSPI surged to another record high, brushing off a dip in its manufacturing PMI from 51.2 to 50.6, thanks to robust trade data showing 3.6% yoy export growth. That contrasted with China, where shares lagged as RatingDog PMI and official manufacturing readings both signaled continued softness in factory activity.
For now, traders are content to stay sidelined ahead of event-heavy sessions later in the week. The full market impact of U.S. President Donald Trump’s recent Asia trip and the trade deals announced there may also take time to filter through sentiment. Volatility could return quickly once central banks clarify their tone the policy paths.
In Asia, Japan was on holiday. Hong Kong HSI is up 0.88%. China Shanghai SSE is up 0.31%. Singapore Strait Times is up 0.44%.
China RatingDog PMI manufacturing falls to 50.6; export orders and prices decline
China’s manufacturing activity expanded at a slower pace in October, with the RatingDog PMI easing to 50.6 from 51.2, missing expectations of 50.9. The moderation reflects weaker demand momentum and growing headwinds from global trade tensions, which weighed on both output and new export orders.
According to RatingDog founder Yao Yu, both demand and production expansion softened. Export orders fell "sharply into contraction territory" as heightened trade uncertainty curbed overseas demand. Production growth also cooled, though sub-indices remained in expansion territory. Purchasing activity "slowed significantly", signaling greater caution among manufacturers heading into year-end.
Price pressures was a drag on profits, as raw material costs rose while finished goods prices fell. Exporters reduced selling prices for the first time since April to stay competitive amid fragile external demand. Still, the survey offered a bright spot: the employment index returned to expansion for the first time since March, reaching its highest level since August 2023.
OPEC+ holds Off Q1 increases after Dec hike; WTI eyes rebound toward 65
Oil prices edged higher in Monday’s Asian session as traders welcomed OPEC+’s decision to keep production steady through the first quarter of 2026. The alliance agreed on Sunday to raise December output targets by 137,000 barrels per day — matching the pace set for October and November — but to pause further increases from January to March. The move signals a shift from aggressive supply expansion toward a more cautious approach amid rising uncertainty in global demand and sanctions-related disruptions.
Since April, OPEC+ has raised total output targets by roughly 2.9 million barrels per day, about 2.7% of global supply, but began slowing the pace in October as forecasts pointed to a potential oversupply heading into winter. Sanctions on Russian producers have added fresh uncertainty to the outlook, with Moscow now facing tighter U.S. and U.K. restrictions on Rosneft and Lukoil. These measures could cap Russia’s ability to increase exports.
By opting for a pause, the group is effectively protecting prices and projecting unity at a time when market confidence is fragile. The decision also reflects seasonal realities — January through March is typically the weakest quarter for global oil demand — giving the alliance time to assess the full impact of sanctions and global inventory trends before deciding on its next steps.
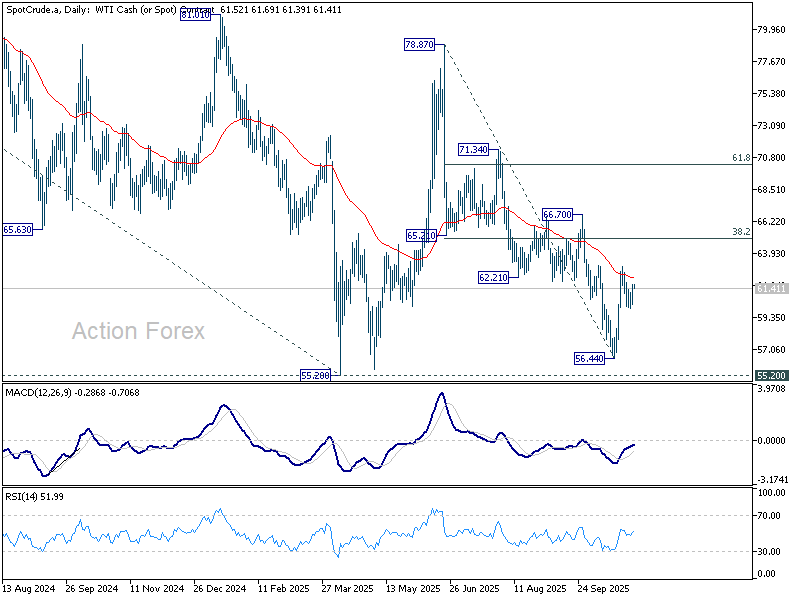
Technically, WTI crude’s decline from 78.87 appears to have completed at 56.44, holding comfortably above 55.20 (2025 low). The structure suggests that the drop was corrective, as the second leg of the pattern from 55.20.
The is room for extended rebound while 59.96 support holds. Break above 62.99 would target the 38.2% retracement of 78.87 to 56.44 to 65.00.
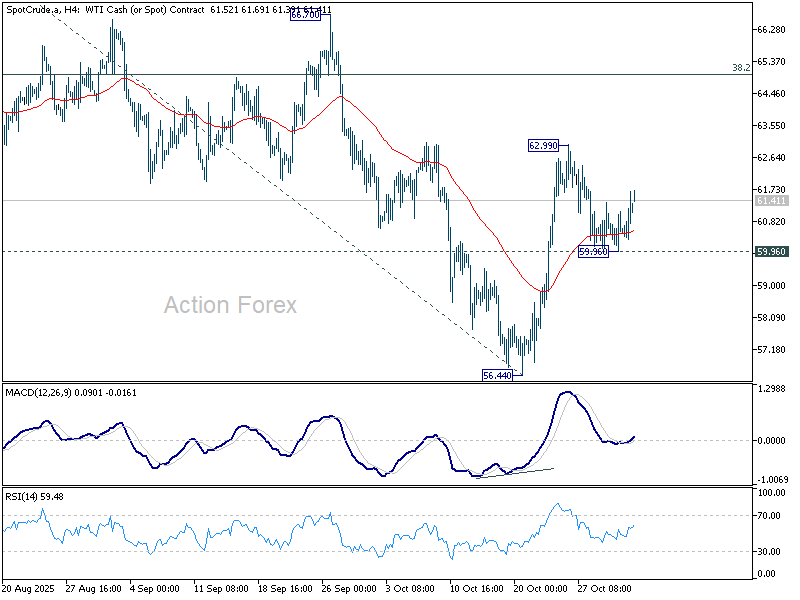
Failure to hold above 59.96, however, would imply renewed downside momentum and the risk of another test of the 55.20 zone before forming a lasting bottom.
Bitcoin correction to extend after snapping “Uptober” streak
Bitcoin softened in Monday’s Asian session, with sellers gradually regaining control after October ended on a sour note for the bulls. The cryptocurrency lost roughly 5% last month — its first negative “Uptober” in seven years — despite briefly printing a new record high above 126,000.
Last week’s attempted rebound stalled as the Fed’s latest decision delivered a hawkish twist. The 25-bp rate cut came with Chair Powell warning that another reduction in December was “not a foregone conclusion,” a remark that revived Dollar strength and curbed appetite for risk assets, including crypto.
Some optimists argue that the traditional October crypto rally may simply be delayed rather than cancelled, but current technical signals are not supporting that view.
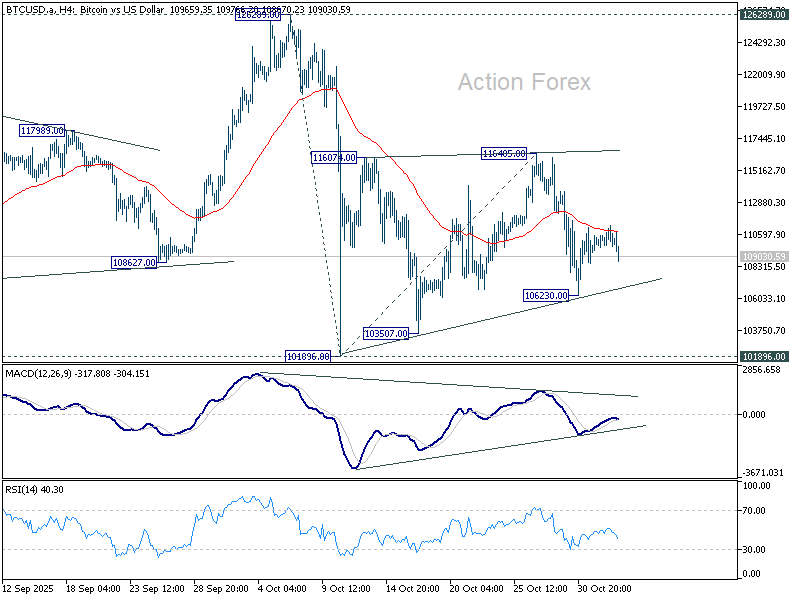
The consolidation pattern from 101,896 appears to have completed in three waves up to 116,405, suggesting that the decline from 126,289 is ready to resume. A drop through 106,230 would confirm renewed downside momentum, opening a move toward 101,896 initially.
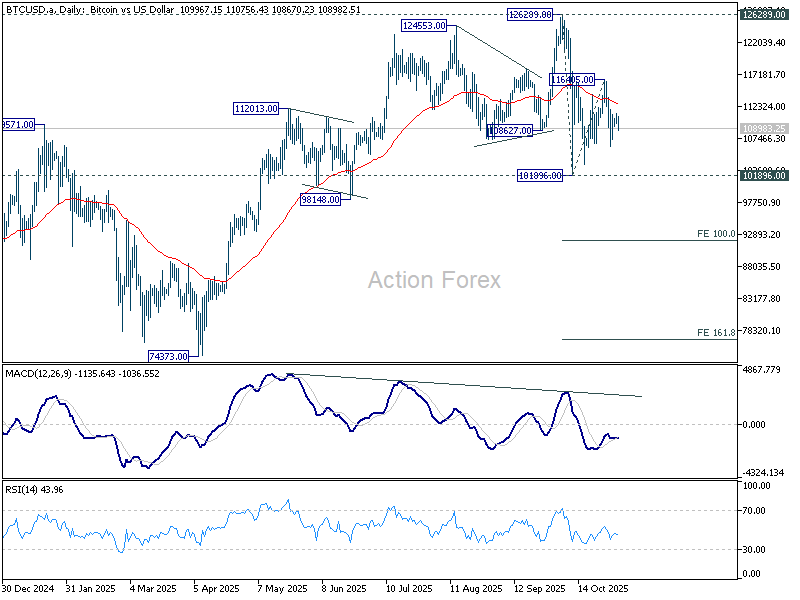
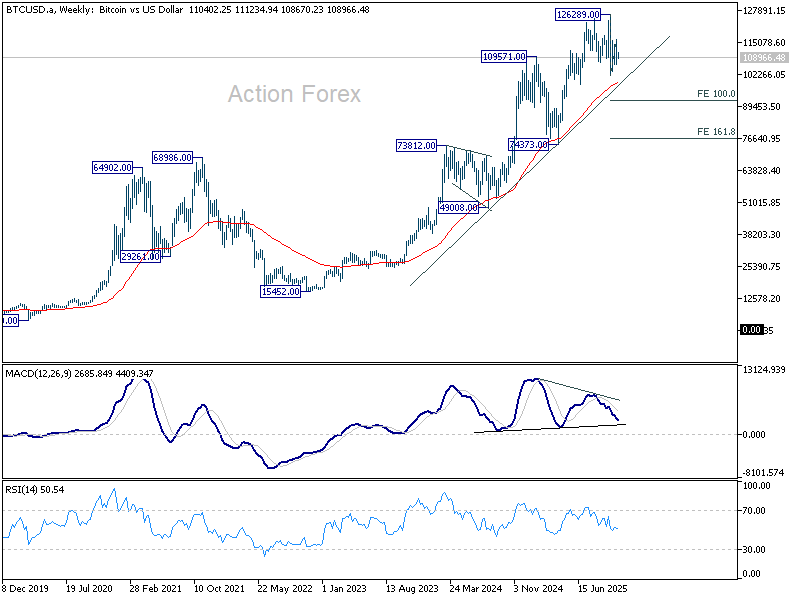
Decisive break below 101,896 would extend losses toward the 55 W EMA (now at 98,964) — the line in the sand for preserving the longer-term uptrend from 15,452 (2022 low).
RBA and BoE set to stand pat as markets seek guidance
Markets head into the first week of November braced for another busy stretch dominated by central banks and key data releases. The RBA and the BoE will both meet this week, and while no policy changes are expected, the tone of their communications could shape market expectations into year-end. Investors will also parse incoming data from North America, Europe, and Asia to gauge the global economic trend after a volatile October.
In Australia, Tuesday’s RBA meeting takes center stage after the upside shock in Q3 CPI, which dashed near-term rate-cut bets. Inflation’s re-acceleration was a clear warning that domestic price pressures was stronger than policymakers had anticipated. For Governor Michele Bullock, the task now is to balance the still-soft labor market against the renewed inflation concern — a dynamic that likely keeps the cash rate anchored at 3.60 % for longer.
According to a Reuters poll conducted October 29–30, all 34 economists expect the RBA to hold rates steady this week. Major local banks ANZ, CBA, NAB, and Westpac also see no move in December. The median forecast calls for just one cut by mid-2026, to around 3.35 %, though opinions remain split: twelve see 3.35 %, six project 3.10 %, and ten expect no change at all. Markets will listen closely to Bullock’s remarks for clues on how firmly she views inflation as the dominant risk.
The BoE is likewise expected to stand pat at 4.00 %. In the latest Reuters poll, 87 % of economists anticipated no change this week, and just over half see rates staying on hold through year-end. That marks a clear shift from a month earlier, when nearly 70 % of respondents expected at least one cut this quarter. A small minority still pencil in a 25-bp reduction by December, but with fiscal clouds gathering over Westminster, caution prevails.
Looking further ahead, a slim majority of forecasters see the Bank Rate drifting to 3.75 % by March 2026 and 3.50 % by mid-year, yet such projections remain highly tentative. The Autumn Budget later this month is the wild card: any combination of tighter fiscal measures or fresh spending could quickly alter the BoE’s reaction function. As always, the vote split will be closely watched to gauge how divided the MPC remains after months of internal debate over the pace of easing.
With Washington’s government shutdown still blocking official data releases, traders will turn to private-sector indicators to assess the U.S. outlook. Key reports include ISM manufacturing and services PMIs, ADP employment, and University of Michigan sentiment and inflation expectations. The ADP print in particular will be crucial for a labor-market pulse check as the Fed weighs whether weakness seen in summer hiring has persisted.
Elsewhere, attention will fall on labor figures from Canada and New Zealand. After cutting rates last week, the BoC signaled confidence that policy is now “about the right level,” but August’s shock GDP contraction underscored lingering fragility. A solid October jobs report would help validate the Bank’s upcoming pause and give policymakers breathing space to evaluate tariff impacts and domestic momentum.
In New Zealand, the RBNZ’s 50-bp cut last month has started to show tentative results: business confidence ticked higher and early indicators suggest stabilizing sentiment. Still, officials need hard evidence that these “green shoots” are translating into real activity. A constructive employment print this week would support the view that the easing cycle is nearing its end.
Beyond that, markets will watch Swiss CPI, Japan’s labor cash earnings data, and China’s Caixin and RatingDog PMIs.
Here are some highlights for the week:
- Monday: China RatingDog PMI manufacturing; Swiss CPI, PMI manufacturing; Eurozone PMI manufacturing final; UK PMI manufacturing final; US ISM manufacturing.
- Tuesday: Japan PMI manufacturing final; RBA rate decision; Canada trade balance.
- Wednesday: New Zealand employment; Japan BoJ minutes; China RatingDog PMI services; Germany factory orders; Eurozone PMI services final, PPI; UK PMI services final; US ADP employment, ISM services.
- Thursday: Japan labor cash earnings; Australia trade balance; Germany industrial production; Swiss unemployment rate; UK PMI construction, BoE rate decision; Eurozone retail sales; Canada Ivey PMI.
- Friday: Japan household spending; China trade balance; Germany trade balance; Swiss foreign currency reserves; Canada employment; US U of Michigan consumer sentiment.
AUD/USD Daily Report
Daily Pivots: (S1) 0.6532; (P) 0.6546; (R1) 0.6559; More...
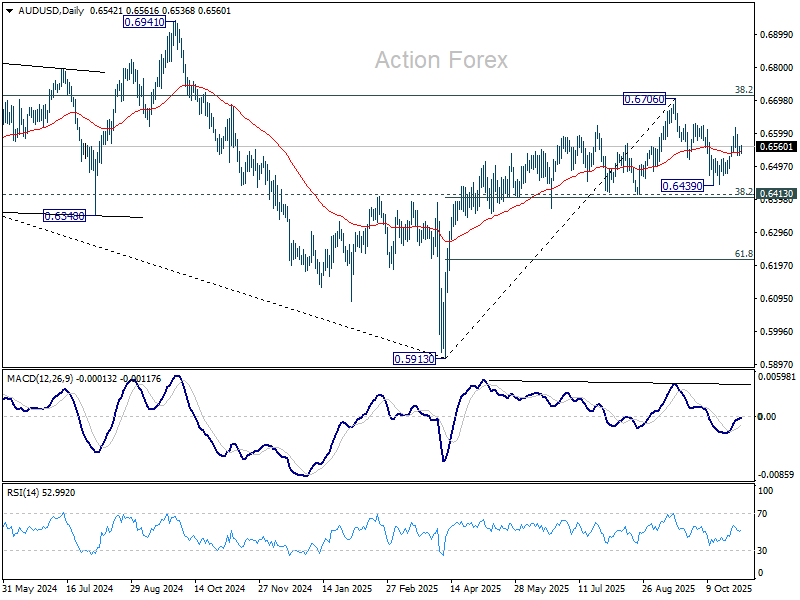
AUD/USD recovers ahead of 0.6524 resistance turned support but stays well below 0.6616. Intraday bias remains neutral for the moment. On the upside, break of 0.6616 will resume the rise from 0.6439 to retest 0.6706 high. However, break of 0.6524 will turn bias to the downside for 0.6439 and possibly below, to extend the corrective pattern from 0.6706 with another falling leg.
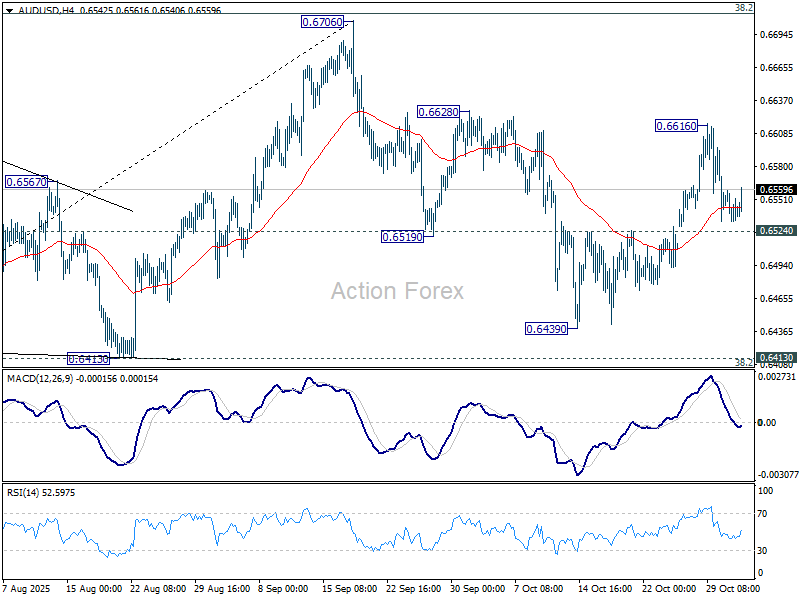
In the bigger picture, there is no clear sign that down trend from 0.8006 (2021 high) has completed. Rebound from 0.5913 is seen as a corrective move. Outlook will remain bearish as long as 38.2% retracement of 0.8006 to 0.5913 at 0.6713 holds. Nevertheless, considering bullish convergence condition in W MACD, sustained break of 0.6713 will be a strong sign of bullish trend reversal, and pave the way to 0.6941 structural resistance for confirmation.
EUR/USD Remains Vulnerable — Further Selling Likely If Dollar Rally Continues
Key Highlights
- EUR/USD started a fresh decline below the 1.1600 support.
- It traded below a major bullish trend line with support at 1.1605 on the 4-hour chart.
- GBP/USD declined further below 1.3250 and 1.3200.
- Gold started a consolidation phase near $4,000.
EUR/USD Technical Analysis
The Euro started another decline below 1.1620 against the US Dollar. EUR/USD traded below 1.1600 and 1.1580 to enter a bearish zone.
Looking at the 4-hour chart, the pair settled below 1.1600, the 100 simple moving average (red, 4-hour), and the 200 simple moving average (green, 4-hour). The pair traded as low as 1.1521 and started a consolidation phase.
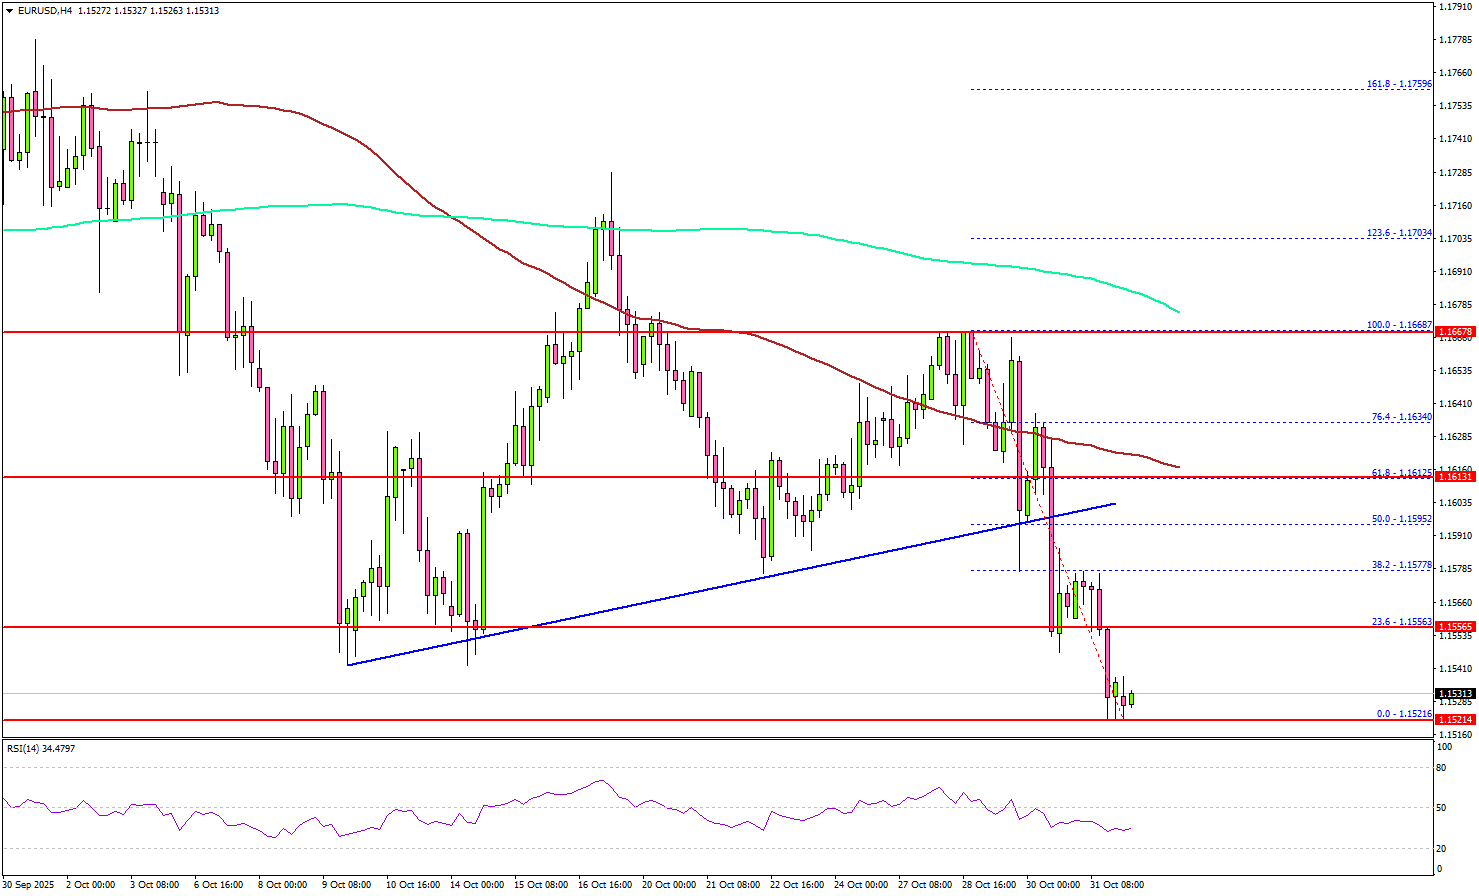
On the upside, the pair faces resistance near the 1.1555 level or the 23.6% Fib retracement level of the downward move from the 1.1668 swing high to the 1.1555 low.
The next hurdle could be near 1.1580. A close above 1.1580 resistance might push the pair to 1.1610 and the 100 simple moving average (red, 4-hour). Any more gains could set the pace for a steady increase toward 1.1650.
On the downside, the pair might find support at 1.1520. The main support might be 1.1500. A close below the 1.1500 zone could start a major pullback toward 1.1450. Any more losses might open the doors for a test of 1.1400.
Looking at GBP/USD, the pair is declining, and there are chances of more losses below the 1.3120 level in the near term.
Upcoming Key Economic Events:
- US S&P Manufacturing PMI for Oct 2025 – Forecast 52.2, versus 52.2 previous.
- US ISM Manufacturing Index for Oct 2025 – Forecast 49.2, versus 49.1 previous.
Global Stocks Hit New Highs Can the Rally Continue?
Risk-on sentiment continued to grow last week, with global stock markets hitting new record highs. The main event was the U.S. Federal Reserve cutting its key interest rate by 0.25%, bringing it to the lowest level in three years. However, Fed Chair Jerome Powell surprised investors by saying that more rate cuts are not guaranteed, which caused the U.S. dollar to strengthen.
In Japan, the Nikkei 225 climbed above 50,000 for the first time, supported by hopes for a large economic stimulus from new Prime Minister Sanae Takaichi and expectations that the Bank of Japan will keep interest rates unchanged. This boosted confidence in Japan’s economic outlook and helped drive strong buying in regional markets.
Trade news was also positive as U.S.–China talks led to a draft deal to pause new U.S. tariffs and ease restrictions on Chinese rare earth exports. The European Central Bank also kept rates steady and highlighted signs of recovery in Germany’s economy.
Markets This Week
U.S. Stocks
Strong U.S. company earnings and the recent interest rate cut helped the Dow Jones reach new record highs, despite growing concerns about a possible bubble in U.S. equities. The index remains above its 10-day moving average and in an overall uptrend, but after failing to build on recent gains, a short-term pullback looks likely. Selling on a break below the 10-day moving average could offer opportunities for short-term traders, while the medium-term trend remains strong. Key resistance levels are at 48,000, 49,000, and 50,000, with support at 47,000, 46,000, 45,500, and 45,000.
Japanese Stocks
The Nikkei 225 posted another strong rally last week, rising every day as the Bank of Japan kept interest rates low, the yen weakened, and expectations for new government stimulus boosted confidence. While the market looks overbought in the short term, selling at record highs remains risky. The better approach is to wait for a pullback toward the 10-day moving average before buying again. Resistance is at 53,000円, 54,000円, and 55,000円, while support lies at 50,000円, 48,500円, and 47,000円.
USD/JPY
Following the Bank of Japan’s decision to keep interest rates unchanged, the USD/JPY climbed to its highest level since February. Despite some concerns about the rapid pace of yen weakness, there are no signs of intervention, as officials remain cautious that higher rates could harm the economy. The uptrend remains strong, and with the pair now trading above 153, there is little resistance ahead, making buying on dips the best strategy for now. Resistance is at 154.5, 155, and 156, while support is at 153, 151.5, 151, and 150.
Gold
Profit-taking in gold continued last week as prices fell below $4,000, following the metal’s strong rally in recent months. New record highs in U.S. equities and short-term technical indicators turning lower encouraged traders to close long positions after the big rise. In the short term, the market may find support around $4,000, creating range-trading opportunities, but further declines are possible if there is no negative economic news to lift safe-haven demand. Resistance is at $4,200, $4,300, and $4,400, while support stands at $4,000, $3,950, and $3,900.
Crude Oil
WTI couldn’t build on last week’s strength as oversupply concerns and worries about weaker demand from a potential U.S. economic slowdown weighed on prices. While support remains around $60, the market is struggling to rise, suggesting that short-term trading strategies of buying weakness and selling strength may work best for now. Resistance is at $65, $66.50, $70, and $75, with support at $60 and $55.
Bitcoin
Bitcoin came back under pressure last week after markets were disappointed by Federal Reserve Chair Powell’s comments suggesting that another rate cut in December may not happen. Key support at $106,000 held, which is a positive sign, but the market remains under pressure overall. For now, range trading between $106,000 and $116,000 looks like the best strategy this week. Resistance is at $116,000, $120,000, and $125,000, while support stands at $106,000, $100,000, and $95,000.
This Weeks Focus Image
This Week’s Focus
- Monday: E.U. HCOB Eurozone Manufacturing PMI, U.K. S&P Global Manufacturing PMI, U.S. S&P Global Manufacturing PMI and ISM Manufacturing PMI
- Tuesday: Australia RBA Interest Rate Decision, E.U. ECB President Lagarde Speaks, U.S. Trade Balance
- Wednesday: Japan Monetary Policy Meeting Minutes, E.U. HCOB Eurozone Composite PMI, U.K. S&P Global Composite PMI, U.S. ADP Nonfarm Employment Change and ISM Non-Manufacturing PMI
- Thursday: Australia Trade Balance, Japan au Jibun Bank Services PMI, U.K. BoE Interest Rate Decision
- Friday: U.S. Michigan Consumer Sentiment
It’s a relatively quiet week for economic data, with attention focused on whether the current uptrends in equities and USD/JPY can continue or if profit-taking will halt their rise, as seen recently in gold. The main highlight will be the release of the Bank of Japan Monetary Policy Meeting Minutes, which could offer clues on the timing of the next interest rate hike. The Bank of England is expected to keep rates unchanged amid persistent inflation, though markets see about a 30% chance of a rate cut. Meanwhile, gold will need to recover above $4,000 to avoid further selling pressure this week.
Bitcoin correction to extend after snapping “Uptober” streak
Bitcoin softened in Monday’s Asian session, with sellers gradually regaining control after October ended on a sour note for the bulls. The cryptocurrency lost roughly 5% last month — its first negative “Uptober” in seven years — despite briefly printing a new record high above 126,000.
Last week’s attempted rebound stalled as the Fed’s latest decision delivered a hawkish twist. The 25-bp rate cut came with Chair Powell warning that another reduction in December was “not a foregone conclusion,” a remark that revived Dollar strength and curbed appetite for risk assets, including crypto.
Some optimists argue that the traditional October crypto rally may simply be delayed rather than cancelled, but current technical signals are not supporting that view.
The consolidation pattern from 101,896 appears to have completed in three waves up to 116,405, suggesting that the decline from 126,289 is ready to resume. A drop through 106,230 would confirm renewed downside momentum, opening a move toward 101,896 initially.
Decisive break below 101,896 would extend losses toward the 55 W EMA (now at 98,964) — the line in the sand for preserving the longer-term uptrend from 15,452 (2022 low).
China RatingDog PMI manufacturing falls to 50.6; export orders and prices decline
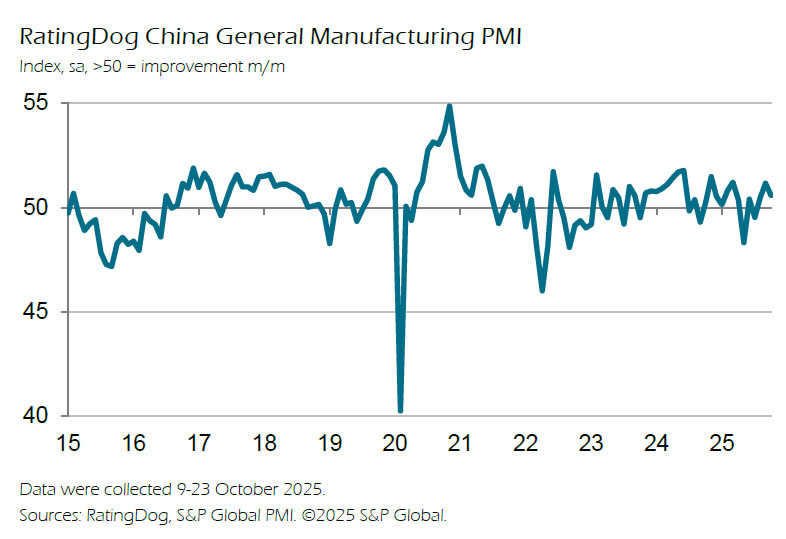
China’s manufacturing activity expanded at a slower pace in October, with the RatingDog PMI easing to 50.6 from 51.2, missing expectations of 50.9. The moderation reflects weaker demand momentum and growing headwinds from global trade tensions, which weighed on both output and new export orders.
According to RatingDog founder Yao Yu, both demand and production expansion softened. Export orders fell "sharply into contraction territory" as heightened trade uncertainty curbed overseas demand. Production growth also cooled, though sub-indices remained in expansion territory. Purchasing activity "slowed significantly", signaling greater caution among manufacturers heading into year-end.
Price pressures was a drag on profits, as raw material costs rose while finished goods prices fell. Exporters reduced selling prices for the first time since April to stay competitive amid fragile external demand. Still, the survey offered a bright spot: the employment index returned to expansion for the first time since March, reaching its highest level since August 2023.
OPEC+ holds Off Q1 increases after Dec hike; WTI eyes rebound toward 65
Oil prices edged higher in Monday’s Asian session as traders welcomed OPEC+’s decision to keep production steady through the first quarter of 2026. The alliance agreed on Sunday to raise December output targets by 137,000 barrels per day — matching the pace set for October and November — but to pause further increases from January to March. The move signals a shift from aggressive supply expansion toward a more cautious approach amid rising uncertainty in global demand and sanctions-related disruptions.
Since April, OPEC+ has raised total output targets by roughly 2.9 million barrels per day, about 2.7% of global supply, but began slowing the pace in October as forecasts pointed to a potential oversupply heading into winter. Sanctions on Russian producers have added fresh uncertainty to the outlook, with Moscow now facing tighter U.S. and U.K. restrictions on Rosneft and Lukoil. These measures could cap Russia’s ability to increase exports.
By opting for a pause, the group is effectively protecting prices and projecting unity at a time when market confidence is fragile. The decision also reflects seasonal realities — January through March is typically the weakest quarter for global oil demand — giving the alliance time to assess the full impact of sanctions and global inventory trends before deciding on its next steps.
Technically, WTI crude’s decline from 78.87 appears to have completed at 56.44, holding comfortably above 55.20 (2025 low). The structure suggests that the drop was corrective, as the second leg of the pattern from 55.20.
The is room for extended rebound while 59.96 support holds. Break above 62.99 would target the 38.2% retracement of 78.87 to 56.44 to 65.00.
Failure to hold above 59.96, however, would imply renewed downside momentum and the risk of another test of the 55.20 zone before forming a lasting bottom.
Ethereum Wave Analysis
Ethereum: ⬆️ Buy
- Ethereum reversed from support level 3800.00
- Likely to rise to resistance level 4200.00
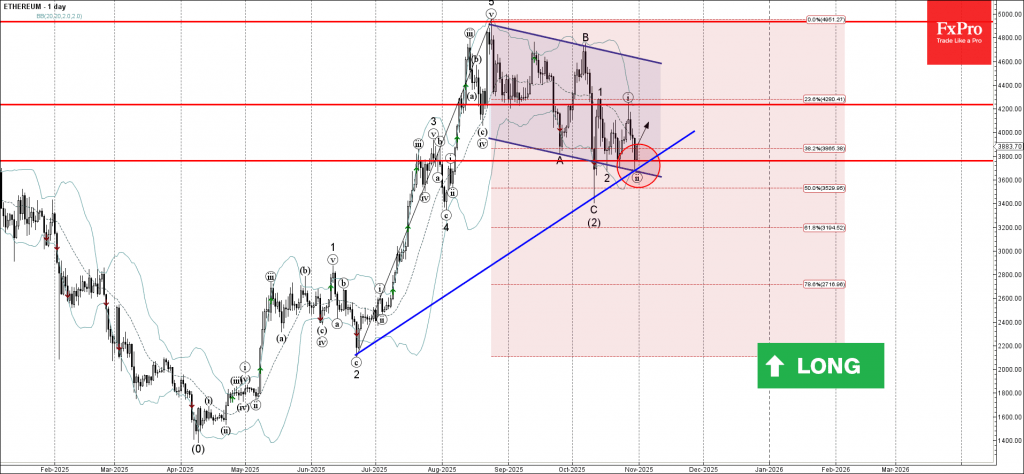
Ethereum cryptocurrency recently reversed from the key support level 3800.00 (which has been reversing the price from the start of October) intersecting with the support trendline of the daily down channel from August and the support trendline from June.
The upward reversal from the support level 3800.00 stopped the previous short term correction ii – which is a part of the impulse waves 3 and (3).
Given the clear daily uptrend, Ethereum cryptocurrency can be expected to rise toward the next resistance level 4200.00, which stopped the previous waves 1 and i.
Gold: Correction Not Over Yet
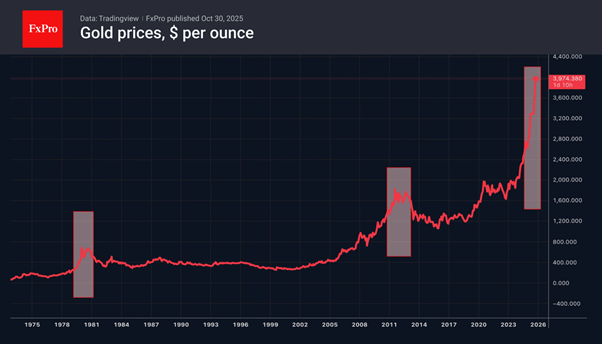
The strengthening of the US dollar and higher Treasury yields have pushed the gold price back below $ 4,000. Yellow metal is gradually losing its wild cards. It managed to reach a record high thanks to devaluation trading, expectations of aggressive monetary expansion by the Fed, Donald Trump’s threats of 100% tariffs against China, geopolitics, pessimistic forecasts for the global economy, and active purchases of bullion by central banks.
However, the White House is no longer attacking the Fed as aggressively as before. The US and China have found common ground. The Middle East conflict has been resolved, and the global economy is proving resilient in the face of tariffs. The Fed is cautious about lowering rates, and central bank activity in the bullion market is declining.
The other two examples of similar gold price rises were 1979 and 2011. The experience of those years shows that the surge and collapse were followed by long periods of consolidation. In other words, after a period of retreat from the top, the precious metal will find its trading range and settle within it. But for the weeks ahead, we continue to see more risks of further decline.
Dollar and Yields Rise Sharply After Fed, But Both Near Key Barriers Ahead
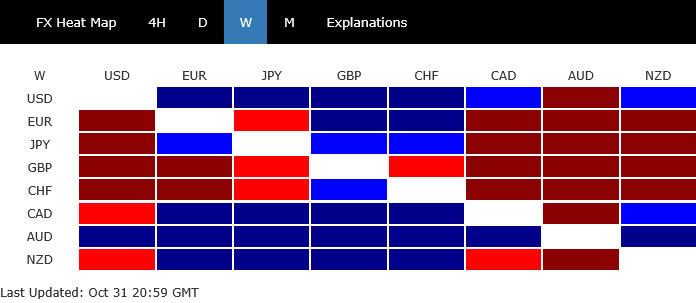
It was a week packed with market-moving headlines and wild cross-asset swings. Traders found themselves caught between optimism over a U.S.–China trade breakthrough and caution sparked by a hawkish twist from the Fed. The result was a volatile mix that saw US equities push to new records, yields jump, and currencies shuffle in dramatic fashion.
Early in the week, markets cheered reports that Washington and Beijing had finalized a framework deal that would avert another round of 100% tariffs. Yet when the agreement was formally confirmed during US President Donald Trump’s Asia trip, the reaction was muted — a reminder that much of the optimism had already been priced in.
Central banks also took the center stage, dominating the midweek flow. The Fed stole the spotlight with a decision that, while delivering the expected cut, came laced with a distinctly hawkish tone. The message sent Treasury yields higher and revived Dollar’s appeal.
Across the border, the BoC initially sounded ready to pause their easing cycle, but a shock contraction in August GDP released later in the week quickly put the door to further cuts back on the table. Elsewhere, both the ECB and the BoJ opted for uneventful holds. Meanwhile in Australia, an unexpected surge in Q3 inflation forced traders to rethink the RBA’s policy path altogether — questioning even whether the central bank was done cutting.
When the dust settled, Aussie led the pack, followed by Dollar and Loonie, Sterling’s fiscal woes left it trailing far behind. Swiss Franc and Euro were also on the weaker side, while Yen and Kiwi ended in the middle.
Wall Street Hits Record Highs Despite Fed Jolt
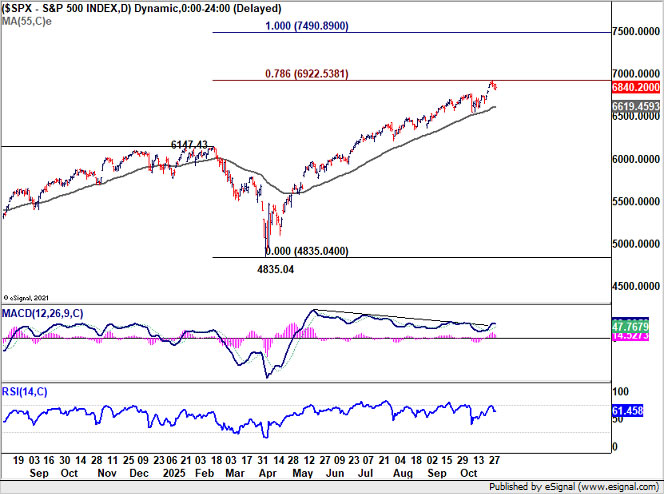
Risk sentiment stayed remarkably resilient in the US. Equity markets once again defied gravity, with all three major indexes powering to fresh record highs as optimism over global trade and tech earnings overshadowed the Fed’s hawkish tone.
NASDAQ jumped 2.2%, while S&P 500 rose 0.7% and DOW added 0.8%, marking yet another week of gains in a year already defined by relentless risk appetite. The tech-heavy Nasdaq led the charge as upbeat earnings from Amazon and Apple reinforced confidence that corporate profits can weather higher rates and trade uncertainty.
That tone was reinforced by the confirmation of the U.S.–China trade framework, which effectively took the threat of 100% tariffs off the table. The removal of a major tail risk helped investors stay committed to equities. The result was a market more inclined to consolidate gains than to correct them.
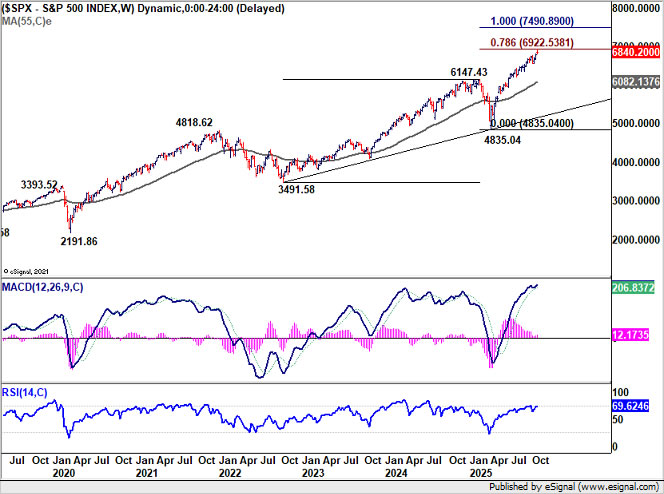
Technically, S&P 500 surged to as high as 6,920.34, just shy of 78.6% projection of 3491.58 to 6147.43 from 4835.04. The key question now is whether the index can break above 7,000 psychological barrier, where momentum could either fade or accelerate.
Sustained break above 7,000 — particularly if confirmed by D MACD’s upward cross above the falling trend line — would likely invite momentum chasing toward 100% projection at 7,490.89, possibly before year-end. Meanwhile, outlook will stay bullish as long as 55 D EMA (now at 6619.45) holds, in case of retreat.
Dollar and Yields Regain Strength After Fed's Hawkish Cut
The Fed’s October meeting delivered both the expected and the unexpected — a 25bps cut as anticipated, but the underlying message came with a distinctly hawkish twist. Markets that had been positioned for a more dovish signal quickly adjusted, sending Treasury yields and Dollar higher.
The FOMC vote revealed deepening divisions within the committee. While Governor Stephen Miran called for a larger 50-basis-point reduction, Kansas City Fed President Jeffrey Schmid broke ranks by voting for no change. Schmid later defended his dissent, citing a balanced labor market, steady momentum, and still-elevated inflation as reasons to pause.
Schmid also argued that another cut would do little to alleviate structural labor market stress, emphasizing that “demographics and technology” are the main drivers behind slower job creation. More importantly, he warned that credibility risks could arise if the Fed appears too eager to ease before inflation is convincingly anchored near 2%.
Besides, Powell’s tone at the post meeting press conference aligned with that cautious stance. He emphasized that while the Fed remains flexible, “a December cut is not a foregone conclusion.”
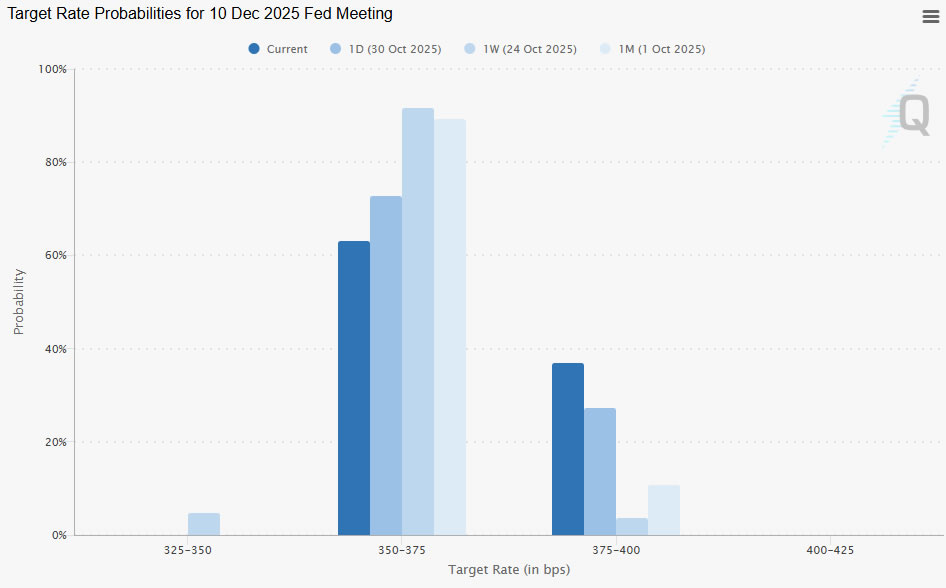
Markets took note — futures pricing for another cut fell to around 63%, down sharply from above 90% the week before. The shift marked a turning point for sentiment around the U.S. rate path.
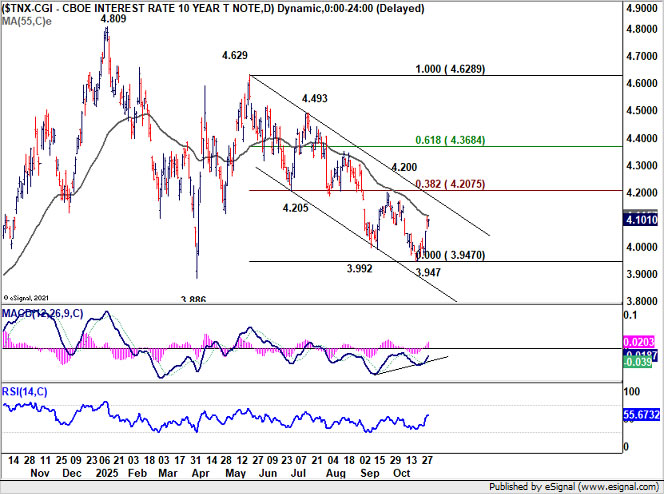
The bond market responded swiftly. 10-year yield's extended rebound confirms short term bottoming at 3.947. Considering bullish convergence condition in D MACD, the fall from 4.629 could be complete too.
Further rise is now expected to 4.205 cluster resistance (38.2% retracement of 4.629 to 3.947 at 4.207). Strong resistance could emerge there to cap upside to set the range for sideway trading.
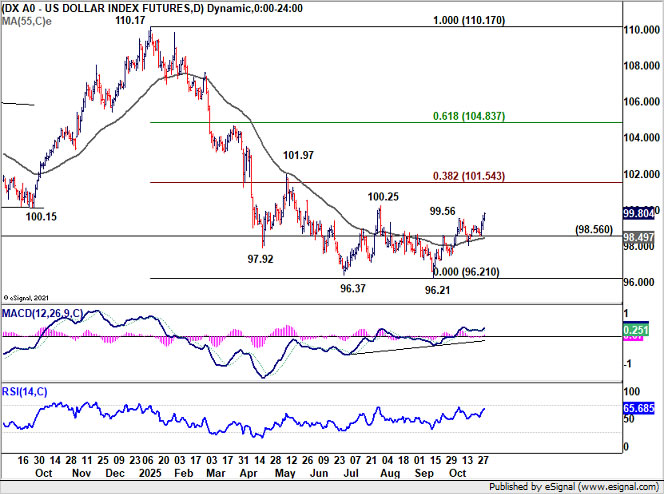
Dollar Index reclaimed upside traction, breaking through 99.56 resistance to resume the rebound from 96.21. Further rise is now expected, as long as 98.56 support holds, to 100.25 resistance and above. But upside should be capped by 38.2% retracement of 110.17 to 96.21 at 101.54.
However, a sustained push beyond 101.54 would signal a true bullish trend reversal, rather than a corrective bounce, particularly if accompanied by a break above 4.2% in the 10-year yield.
Sterling Trapped at the Bottom as UK Fiscal Woes Deepen
While Dollar was buoyed by hawkish Fed signals, the British Pound struggled and ended the week as the weakest among major currencies. The decline reflected growing fiscal unease in the UK as investors confronted a widening budget gap and rising concern about the government’s ability to maintain stability in public finances.
The selloff accelerated after reports that Chancellor Rachel Reeves faces a deeper fiscal hole than previously anticipated. The revelation complicates the government’s fiscal strategy at a time when the economy is already slowing and public debt levels remain historically high. Investors are increasingly worried that the UK will need to either tighten spending or raise taxes to restore credibility, both of which could undercut near-term growth.
For the BoE, the dilemma is becoming sharper. A significant fiscal tightening could offset some inflation pressures but at the cost of weaker demand — forcing the BoE to lean more dovishly in 2026. Markets are now debating whether Governor Andrew Bailey and his colleagues will need to accelerate rate cuts if fiscal tightening materializes, or if inflation persistence keeps them cautious for longer.
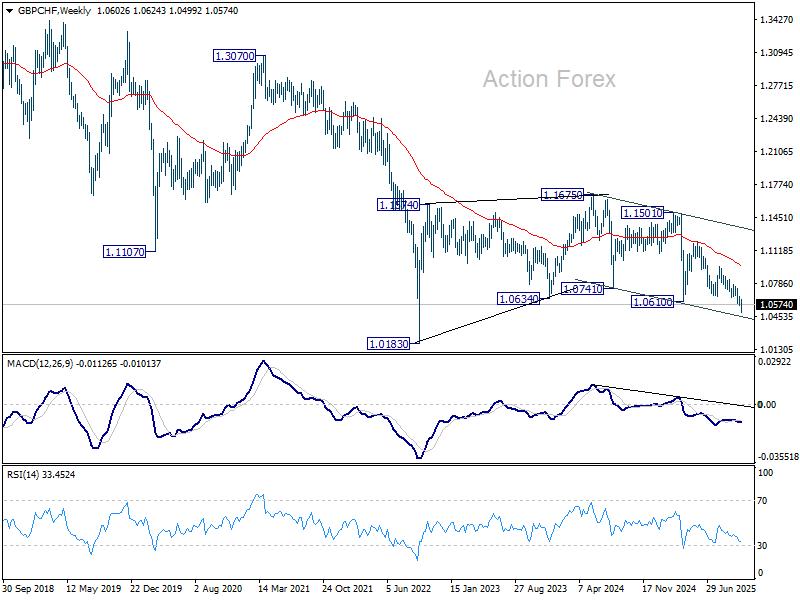
Technically, the Pound’s weakness is visible in GBP/CHF, which extended its downtrend to 1.0499 before stabilizing. Some consolidations could be seen in the near term, but outlook will stay bearish as long as 1.0658 support turned resistance holds. Next target is 100% projection of 1.1204 to 1.0658 from 1.0959 at 1.0413.
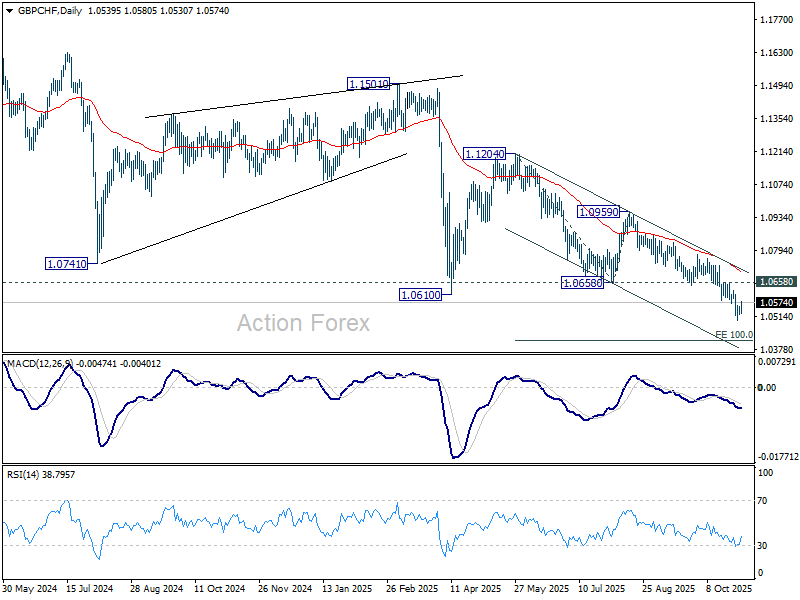
Current downside momentum, as seen in W MACD, doesn't warrant a break through 1.0183 (2022 low). Range trading is still more likely to continue between 1.0183/1.1675 in the medium term. However, any pickup in downside momentum could mean that GBP/CHF is actually ready to resume the multi-decade down trend.
Aussie Outperforms as Traders Push Back RBA Easing Timeline
In contrast to Sterling’s fiscal drag, Aussie emerged as the standout performer of the week, buoyed by much stronger-than-expected Q3 CPI report that caught RBA, economists, and traders off guard.
In response, money-market pricing for a November or December cut has collapsed, with several leading institutions now forecasting no additional easing this year. Instead, traders are focusing on the February 2026 meeting as the next plausible window for policy action — and only if Q4 inflation, due in January, shows clear disinflation momentum.
That outlook could change only if the labor market deteriorates materially, forcing the RBA to respond. So far, however, employment data have remained resilient, reinforcing the view that the Bank can afford to wait and watch.
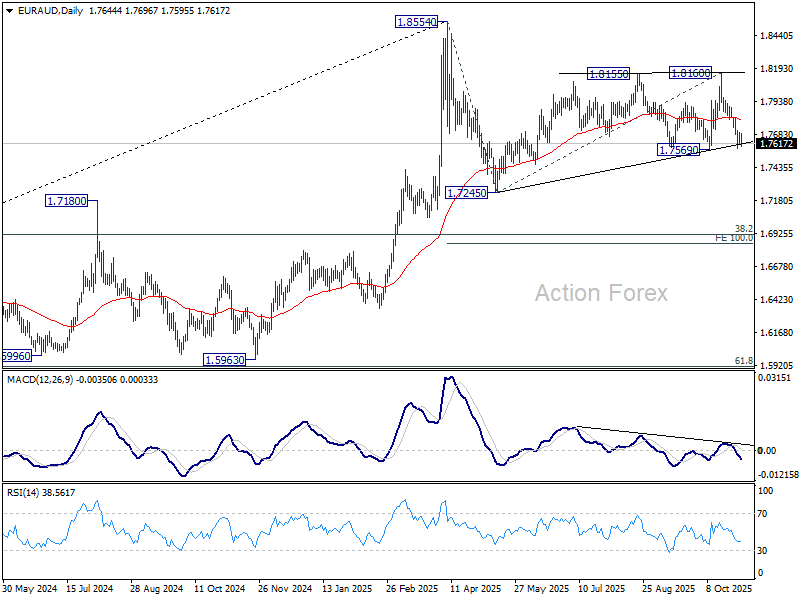
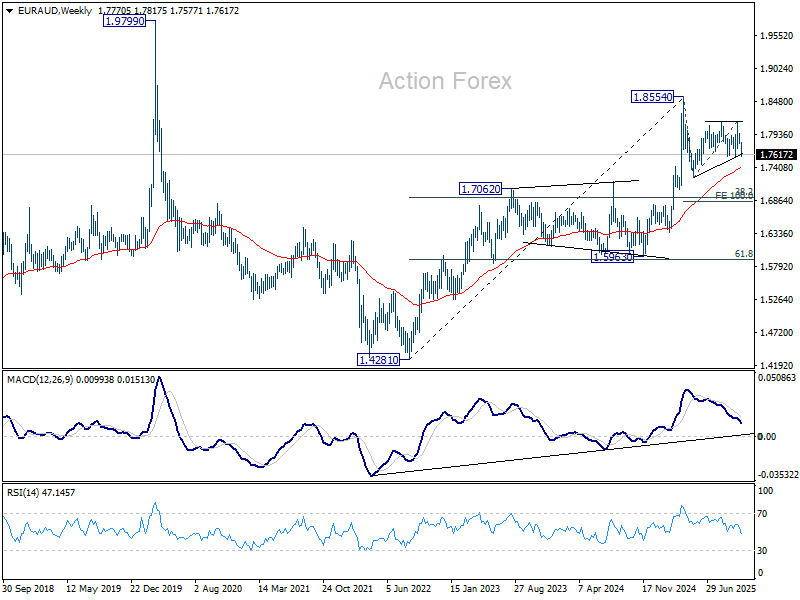
Technically, EUR/AUD is a key pair to monitor in the coming days. Decisive break below 1.7569 support confirms that the fall from 1.8554 (2025 high) has resumed. The next near-term target lies at 1.7245, with a firm break there opening the way toward 38.2% retracement of 1.4281 (2022 low) to 1.8554 at 1.6922 down the road.
EUR/USD Weekly Outlook
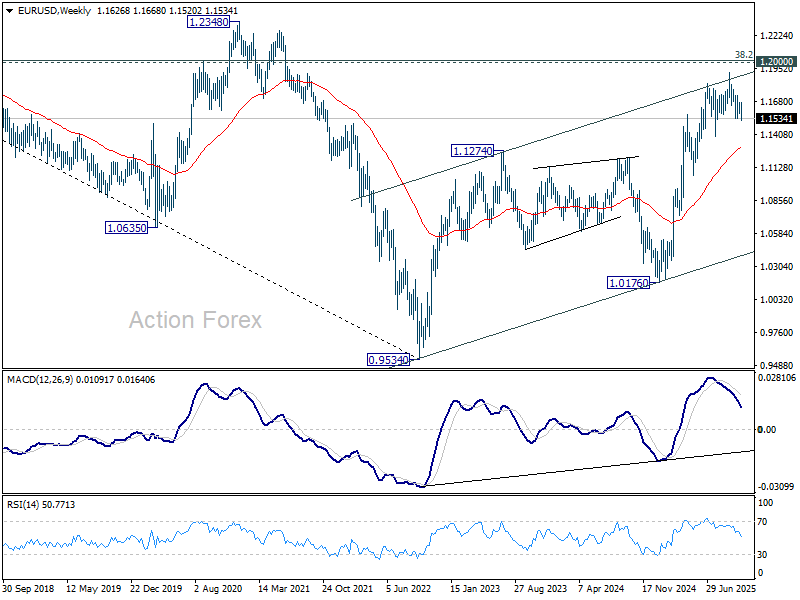
EUR/USD's fall from 1.1917 resumed by late break of 1.1540 support. Initial bias stays on the downside this week for 1.1390 support, or even further to 38.2% retracement of 1.0176 to 1.1917 at 1.1252. On the upside, above 1.1576 minor resistance will turn bias neutral and bring consolidations first, before staging another fall.
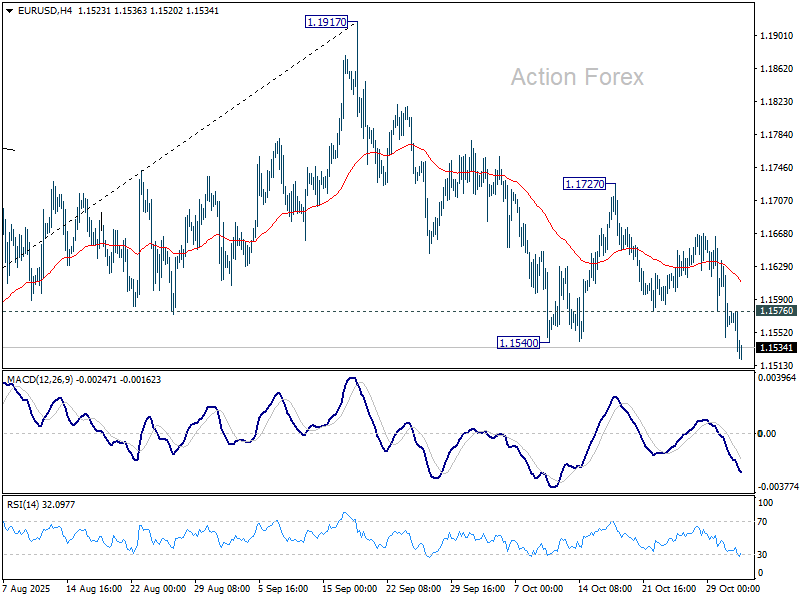
In the bigger picture, considering bearish divergence condition in D MACD, a medium term top is likely in place at 1.1917, just ahead of 1.2 key psychological level. As long as 55 W EMA (now at 1.1298) holds, the up trend from 0.9534 (2022 low) is still expected to continue. Decisive break of 1.2000 will carry larger bullish implications. However, sustained trading below 55 W EMA will argue that rise from 0.9534 has completed as a three wave corrective bounce, and keep larger outlook bearish.
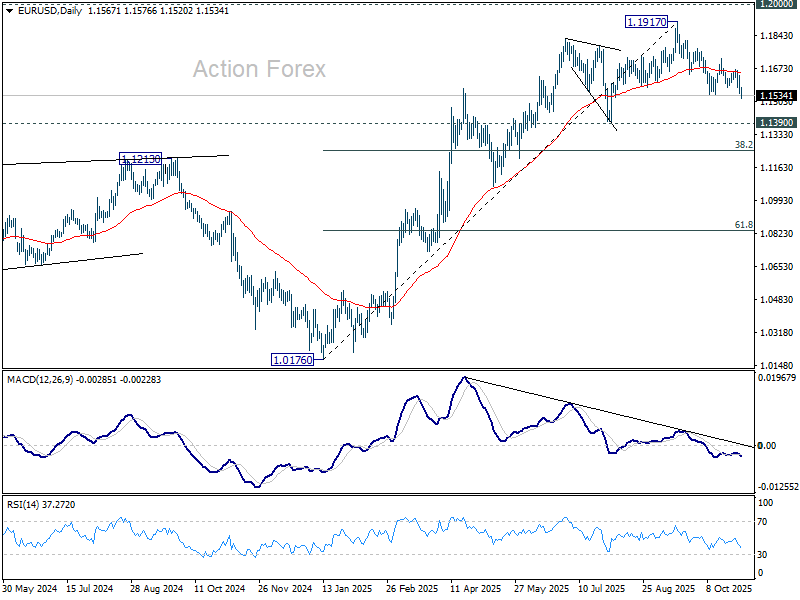
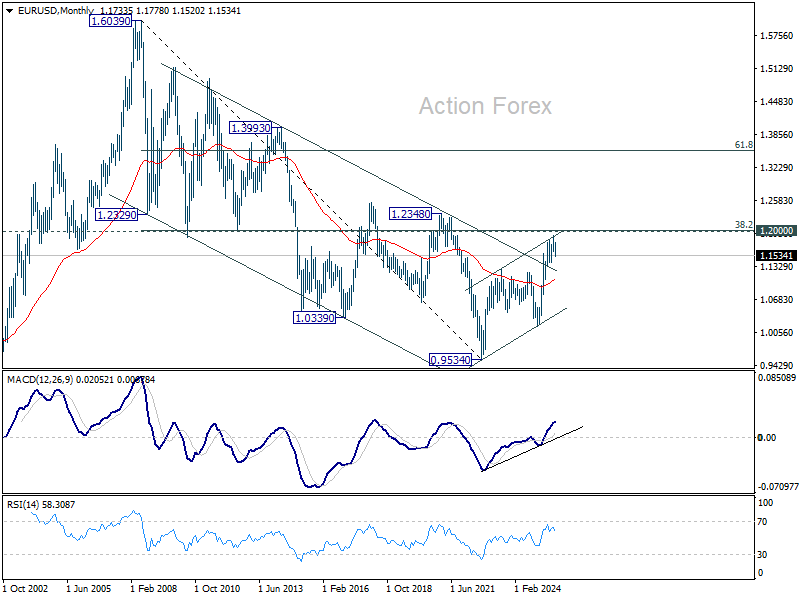
In the long term picture, 38.2% retracement of 1.6039 to 0.9534 at 1.2019, which is close to 1.2000 psychological level is the key for the outlook. Rejection by this level will keep the multi decade down trend from 1.6039 (2008 high) intact, and keep outlook neutral at best. However, decisive break of 1.2000/19, will suggest long term bullish trend reversal, and target 61.8% retracement at 1.3554.