Sample Category Title
Weekly Economic & Financial Commentary: The Rate Outlook Just Got Cloudier
Summary
United States: The Rate Outlook Just Got Cloudier
- Data remain relatively scarce on day 31 of the government shutdown. Consumer perceptions of the labor market are very weak, and home sales appear to have stalled. The FOMC instituted another 25 bps rate cut, but Powell raised the bar for future easing.
- Next week: ISM Manufacturing (Mon.), ISM Services (Wed.), Consumer Credit (Fri.)
International: G10 Central Banks Navigate a Foggy Outlook
- This week’s monetary policy decisions came from several key G10 central banks. The Bank of Canada lowered its policy rate to 2.25%, while both the European Central Bank and the Bank of Japan held rates steady. Elsewhere, China’s October PMI surveys came in weaker than expected.
- Next week: Reserve Bank of Australia Policy Rate (Tue.), Bank of England Policy Rate (Thu.), Banxico Policy Rate (Thu.)
Interest Rate Watch: Another Risk-Management Cut, but December Looms Large
- The FOMC lowered the fed funds target range by 25 bps to 3.75%-4.00% at the conclusion of its October meeting. Yet, Chair Powell made clear that additional easing in December is far from assured.
Topic of the Week: Government Shutdown Disrupting Welfare Programs
- The government shutdown is now approaching its fifth week. As funding for certain parts of the government has begun to run dry, welfare programs are soon to be affected.
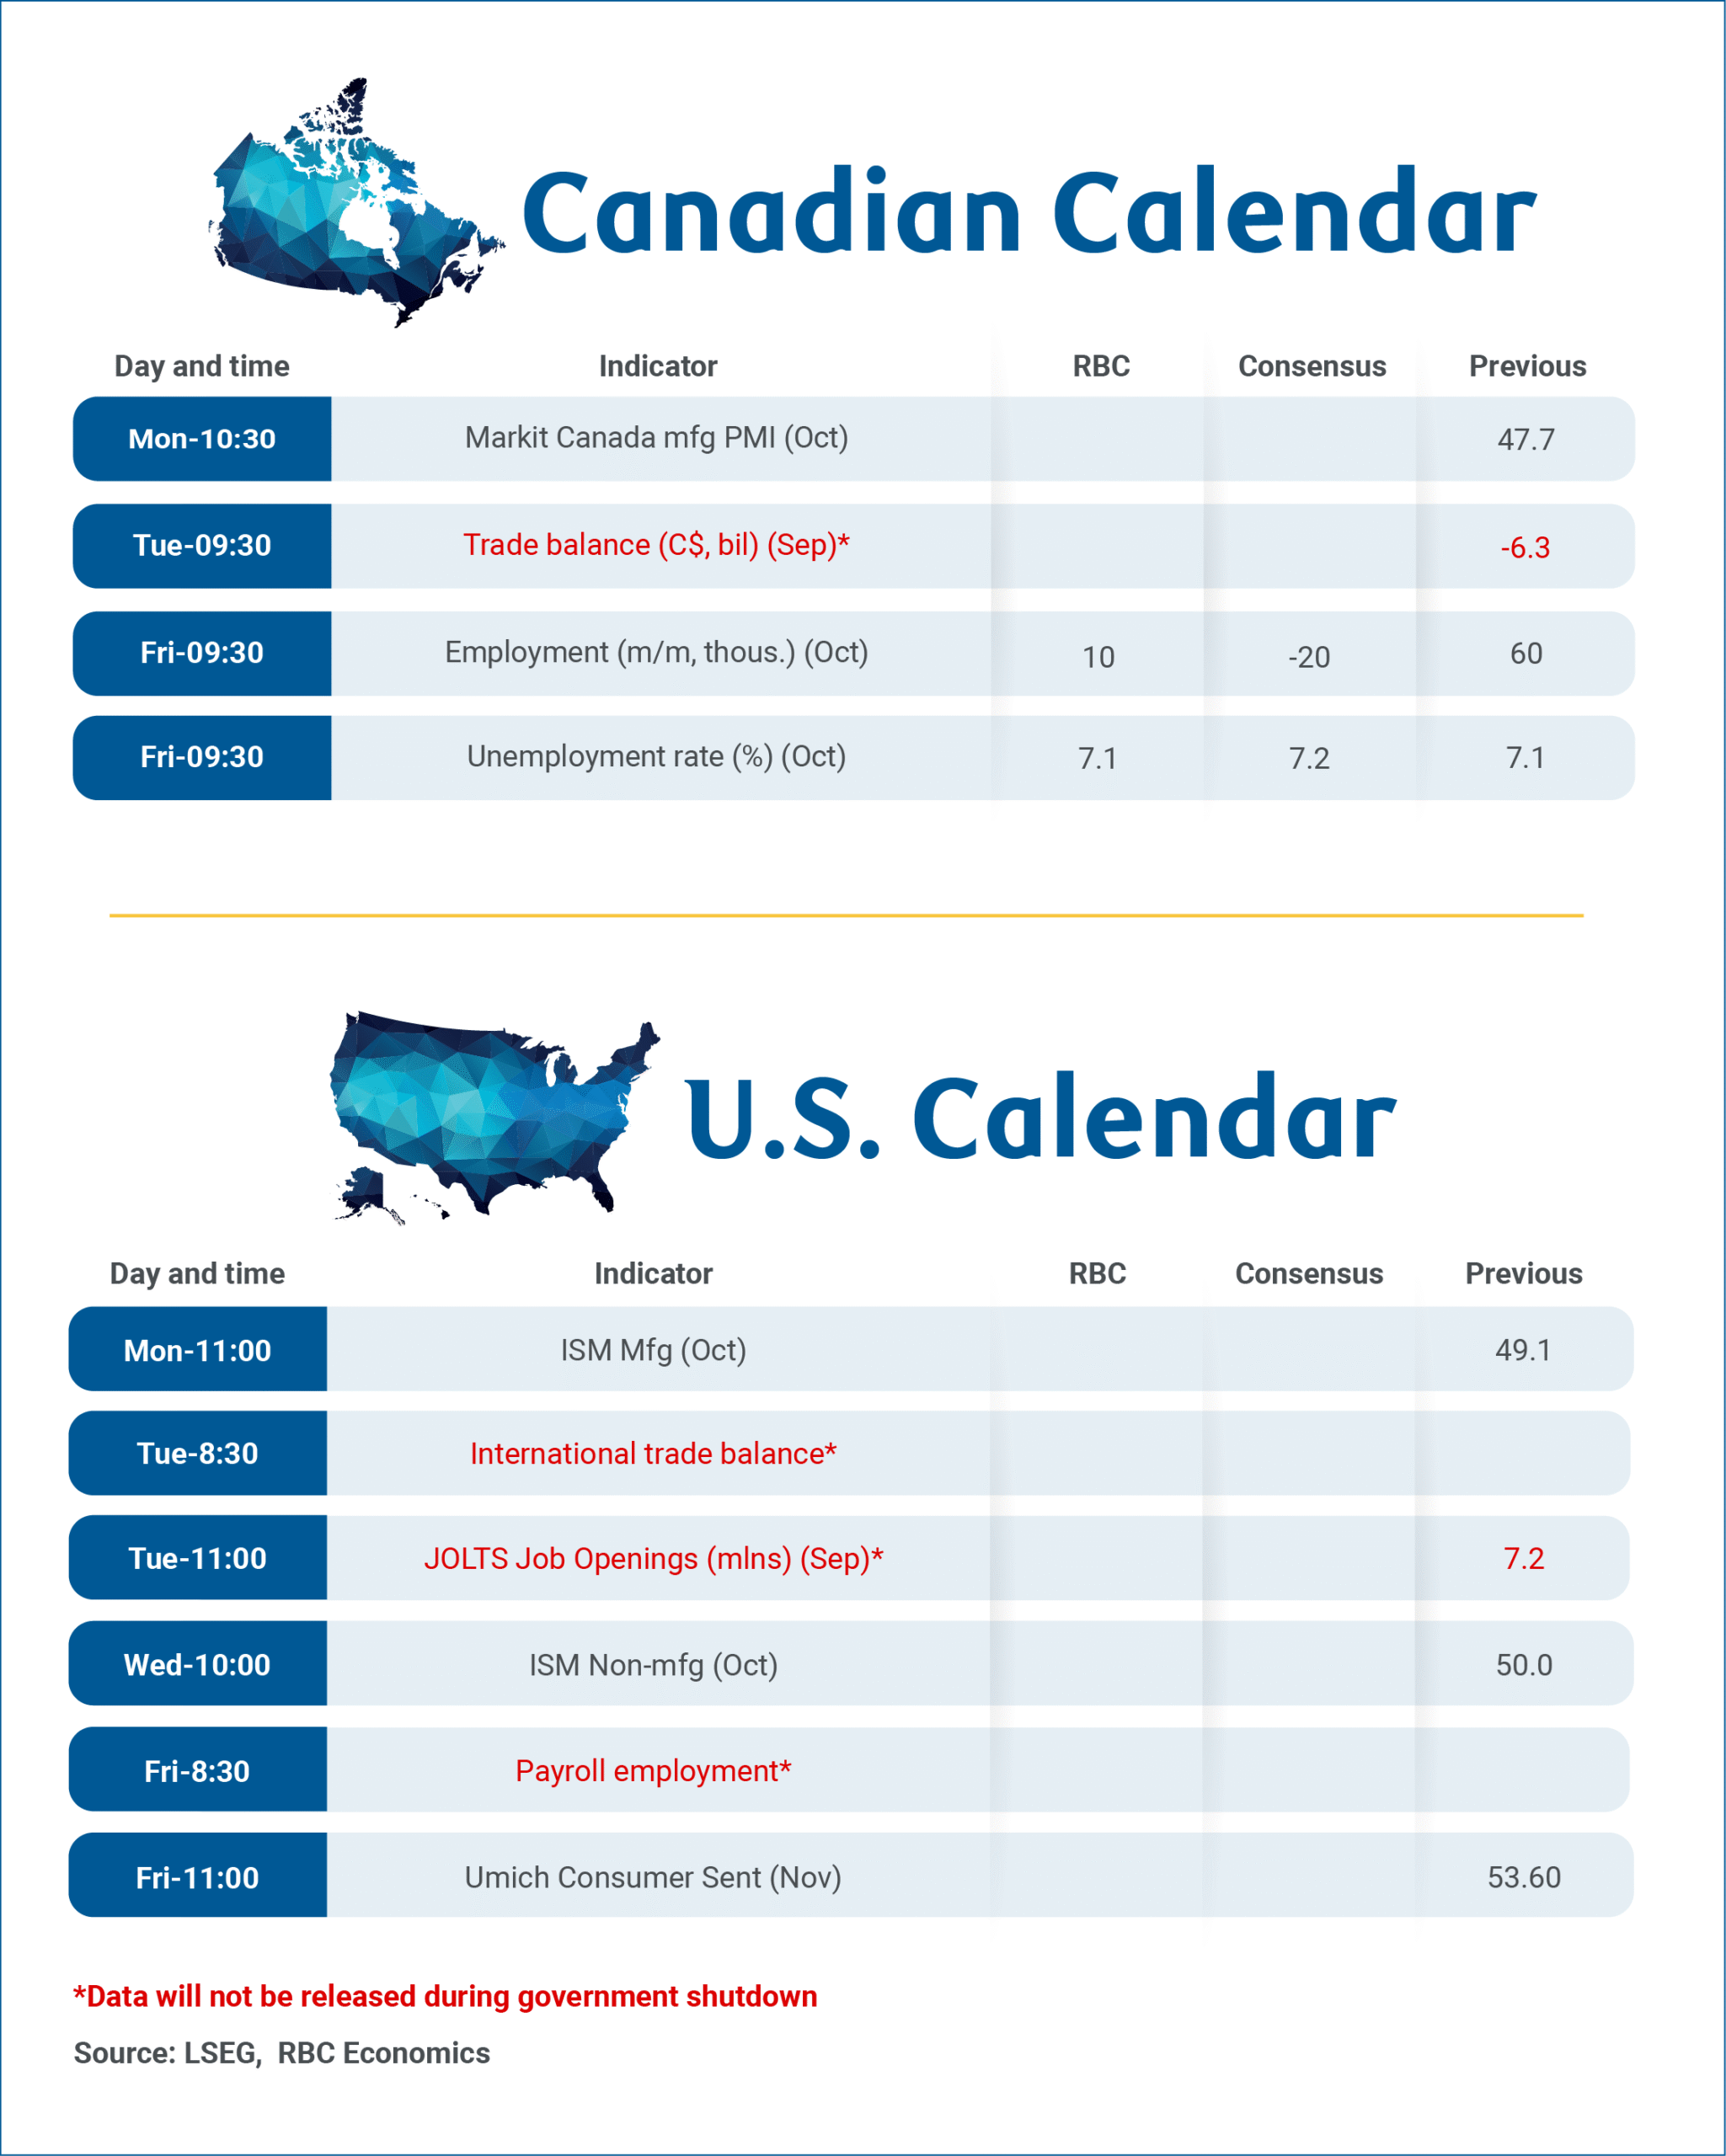
Forward Guidance: October Jobs in Canada in Focus as U.S. Shutdown Disrupts Data Releases
The U.S. government shutdown continues to prevent the release of key economic data with the coming week’s U.S. September international trade and October jobs reports unlikely to be published on schedule.
The shutdown will also prevent the release of Canada’s international trade data for September since Statistics Canada confirmed that critical U.S. import data used to gauge Canadian exports has not been provided.
Still, Canada’s job market data next Friday is expected to show further evidence of stabilization in October. .. And the details of Tuesday’s federal budget will be watched closely for the extent to which wider deficit spending will add to economic growth tailwinds into next year.
We expect employment to show a 10,000 increase in October. Monthly employment changes are notoriously volatile. A 60,000 jump in employment in September followed 66,000 and 41,000 declines in August and July, respectively, and an 83,000 surge in June.
But with population (and available labour force) growth slowing, even modest growth in employment over time is enough to keep the unemployment rate from rising. We expect the unemployment rate to hold at 7.1% in October—up 0.5% from a year ago, but just 0.1 percentage points higher than May.
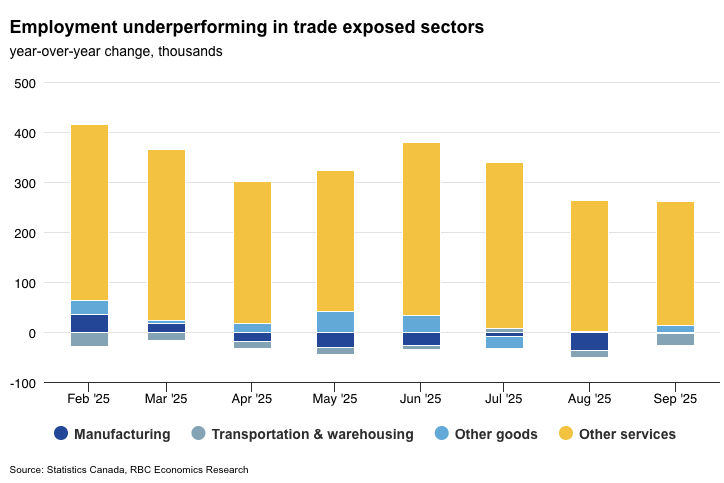
Canadian hiring demand stabilizing
Looking through monthly volatility, hiring demand has shown further signs of stabilizing. Job openings from indeed.com have been holding broadly steady, and layoffs have been limited. Most of the rise in the unemployment rate has come from longer job searches for new entrants. The youth unemployment rate is particularly elevated.
Heavily trade exposed industries like manufacturing and transportation services are expected to remain under pressure, but job growth in the rest of labour markets remains broadly positive.
Wage growth has mostly continued to show signs of slowing, and hours worked will be watched closely as an early indicator of Q4 growth momentum. August GDP declined unexpectedly, but an upward revision to July output and signs that the economy grew in September have left GDP tracking closely to our base case forecast of 0.5% growth.
Week Ahead – With Treats Potentially Over, Risk Sentiment About to be Tricked?
- Risk appetite has not fully enjoyed the treats of a Fed rate cut, strong earnings and trade peace.
- Fedspeak, the US Supreme Court and US data could challenge the Dollar’s current strength.
- Aussie and Pound are on divergent paths as respective central banks meet next week.
- Yen weakness fuels verbal interventions; the battle for $4,000 Gold persists.
Flurry of risk-positive events this week
The week has confirmed expectations, proving to be both eventful and market-moving. Following speculation, the Fed announced another 25bps rate cut, and the Trump-Xi summit rubber-stamped a basic trade agreement, signaling a short-term truce between the two superpowers. Additionally, the current earnings round continues with strong results from the tech giants, once again confirming their bright outlook and market dominance.
US stock indices are in the green for the third consecutive week, outperforming their European counterparts. Notably, the Nasdaq 100 index is the best performing asset class this week, surpassing cryptocurrencies, gold and major FX pairs.
Risk sentiment somewhat bruised after a hawkish Fed
On face value, one could say that the week has been, hands down, a win for risk appetite. But this is not entirely accurate. While the Fed did not disappoint the rate cut expectations, the overall rhetoric was much less dovish than anticipated. Chair Powell’s remark that “a further cut in December is not a foregone conclusion, far from it” has really set the debate alight.
At the same time, he kept the door open for a December move. Powell’s comment about “what do you do if you're driving in the fog? You slow down” was a clear message that a restart of the official data releases could be necessary for the third consecutive rate cut that President Trump is craving.
Fedspeak is critical next week
Wednesday’s meeting also confirmed that the Fed has entered a new phase. While doves and hawks were united in terms of the response to the perceived labour market weakness, there now appears to be a split over how to act next.
The market was almost certain that a December rate cut would follow, but Powell’s rhetoric has given rise to second thoughts. This means that Fedspeak could be massively critical starting next week, when board members and regional Fed presidents resume their public appearances, laying the groundwork for the critical December meeting.
US Supreme court to hear tariff case; flare-ups are not out-of-the picture yet
Overall, it has been a positive week on the tariff front. Apart from the pivotal Trump-Xi summit, the US president has had a fruitful trip to East Asia.
This goodwill factor might evaporate this week, though, as on November 5, the US Supreme Court will hear oral arguments about Trump’s ability to impose tariffs using the International Emergency Economic Powers Act of 1977.
The ruling is not expected for a few months, although there will be pressure on the Court to expedite this case. That said, on Wednesday the judges will be able to ask questions to both sides, potentially giving a taste of their thinking ahead of the ruling. Any headline that judges were quite lenient toward Trump’s lawyers could support risk appetite.
The data week that could have been…
Under normal circumstances, next week would be a nonfarm payrolls week. However, with the US government shutdown entering its second month, the usual calendar will not be met. Importantly, even if the shutdown ends next week, the BLS will announce an amended calendar until year-end to normalize the missed releases, which probably means that chances of a Friday nonfarm payroll release are quite slim.
Luckily, next week is packed with private US data. Specifically, the usually ignored JOLTS job openings and the Challenger jobs cuts will get their fair share of attention, but understandably all eyes will be on the two ISM surveys and the ADP employment report. A soft set of data next week would refuel the December rate cut expectations.
Will Dollar maintain current gains?
After a sluggish start to the week, the more-hawkish-than-anticipated rhetoric from Powell turned the tide around for the dollar. Euro/dollar is trading around 1.1572, a level that has been acting as a floor on numerous occasions. Positive US data releases this week, coupled with a potential push to end the government shutdown could keep the dollar supported next week.
Notably, October has been an exceptional month for the greenback. The dollar index has climbed by 1.8%, boosted by strong moves in both euro/dollar (-1.3%) and dollar/yen (+4.1%). On the flip side, both the yen and the pound have been notably underperforming, with dollar/yen being the best performing FX pair in October, outperforming US equity indices and cryptocurrencies.
Euro rally to fizzle out?
The ECB meeting proved more interesting than anticipated, with President Lagarde conveying confidence in the growth outlook without adopting a hawkish rhetoric. With the market pricing in just 10bps of additional easing just mid-2026, an unimpressive data calendar and a flurry of ECB speakers – with the doves quickly trying to gain the upper hand in the discussion for a December rate cut in defiance of ECB’s confident stance – could undermine the euro next week.
Aussie best positioned to take advantage of any dollar weakness
Contrary to the Fed, the RBA is expected to keep rates steady on Tuesday for the third consecutive meeting, with the market fully pricing in the next 25bps rate cut in mid-2026. The much stronger Q3 inflation report squashed rate cut expectations arising from the weakness seen in the job market, postponing any serious rate-cut discussion until December at the earliest.
Markets are currently assigning a 92% chance of no change on Tuesday, with the aussie potentially benefiting from a slightly more hawkish rhetoric from the RBA and a continued improvement in the US-China trade relations.
In this context, there are some key Chinese releases next week, with Friday’s trade balance data potentially revealing some of the reasons why China capitulated so quickly to US demands at this week Trump-Xi summit in South Korea.
Euro/Pound climbs to a fresh 2½-year high; BoE might surprise with a rate cut
The pound has been under considerable pressure, posting losses against the euro and dollar this week, while the monthly picture is even worse. The main reason appears to be lingering concerns about the late-November budget, which could result in significant tax increases, denting the current fragile growth rate. The focus now shifts to the MPC meeting on Thursday, which includes the quarterly monetary policy statement and a press conference.
The softer CPI report for September and the weakness seen in jobs data are keeping the BoE rate-cut expectations alive, with the market assigning a 31% probability to such an event. Notably, economists are split about one additional cut by year-end, with one major investment bank suddenly forecasting such a rate cut next week.
For the doves, specifically Taylor and Dhingra, it is the perfect opportunity to get their rate cut approved by convincing just three members to join them. Notably, the August voting shenanigans cannot be excluded, particularly if Governor Bailey joins the dovish side, with the pound potentially being hit considerably in such a development.
Daily verbal interventions become the norm for the Yen
The goodwill from this week’s Trump-Takaichi meeting has quickly evaporated, as the combination of a more hawkish Fed meeting and the BoJ maintaining its prevailing balanced approach pushed dollar/yen to a fresh eight-month high.
Following a solid Tokyo CPI report, the data calendar is relatively busy next week with average cash earnings and household spending data on offer. That said, considering the dollar/yen move, verbal interventions could dominate the newsflow. A decisive move above the busy 154.52-154.80 zone could force Japanese Finance Ministry officials to step up their rhetoric but still refrain from hinting at direct intervention.
The battle for $4,000 continues
The precious metal has lost around 9% from its recent all-time high, as the battle for the $4,000 level continues in full force. Fundamentally little has changed recently, as the US debt burden continues to climb and central bank demand is expected to remain strong. This means that gold is well positioned to benefit from a risk-off reaction, particularly if caused by another trade flare-up.
Weekly Focus – Trade Tensions Move to the Background Again
Trade tensions between the US and China eased this week following an agreement by Trump and Xi on several trade issues. The US side agreed to reduce fentanyl related tariffs on China from 20% to 10% and postponed probes into Chinese shipbuilding and compliance with the Phase One agreement. In return, China delayed export control on rare earth minerals by a at least one year and resumed soybean purchases from the US. It is positive that the two sides can de-escalate tensions, but we expect to see more bumps on the road, although the two sides will most likely try not to rock the boat ahead of Trump's China visit in April. For details, see: US-China trade - Xi and Trump put a lid on trade tensions once again, 30 October.
We had a busy central bank week where the US Federal Reserve cut interest rates by 25bp to a target range of 3.75%-4.0%. The cut was widely expected but Powell delivered hawkish remarks at the press conference, casting doubt on a December rate cut, and one member surprisingly voted in favour of holding rates steady. Powell said that 'another rate cut in December is far from assured' and that 'there is a growing chorus of feeling we should maybe wait a cycle'. He highlighted that despite the government shutdown, available data does not signal significant further cooling in labour markets. The Fed also announced an end to QT, for which markets were well prepared. For details, see Research US: Fed review: Hawkish cut, 29 October. In Japan, the Bank of Japan (BoJ) kept rates unchanged in a 7-2 vote. A small probability of a hike was priced prior to the meeting, leading to a further yen weakening. We maintain a hawkish BoJ outlook, expecting the next hike in December, contingent on improving wage and spending data.
In Europe, the ECB decided to leave its key policy rates unchanged with the deposit facility rate at 2.00% as expected. Lagarde highlighted that some downside risk factors have abated since the last meeting and stressed the symmetry of the 2% inflation target, which allows some undershooting. Otherwise, she gave limited new information, which resulted in no market reaction. Markets are pricing 1bp worth of cuts this year and 8 next year, while we expect the ECB to leave the deposit rate unchanged. See ECB Review: Abated downside growth risks, 30 October. Euro area HICP inflation declined to 2.1% y/y in October as expected by consensus. Core inflation surprised on the topside by holding steady at 2.4% y/y (cons: 2.3% y/y). The decline in headline inflation was thus due to lower food and energy inflation while services inflation rose to 3.4% y/y from 3.2% y/y. The monthly price increase in services was strong at 0.40% m/m s.a., which is slightly hawkish. We expect euro area inflation to average 2.1% in the final quarter of the year before falling below target next year. We also got data on euro area GDP in the third quarter, which showed that activity rose more than expected by 0.2 % q/q (cons: 0.1% q/q) following a rise of 0.1% q/q in the second quarter. The main surprise was the French economy that recorded a growth rate of 0.5% q/q due to strong exports while Germany stagnated, and Spain rose 0.6% q/q due to strong domestic demand.
Next week focus turns to private data from the US with the ISM report for October and ADP employment, the Challenger Report, and Uni. of Michigan consumer confidence. In China, we get the private manufacturing PMI which is interesting following a big decline this week in the official version. In Japan focus turns to wage growth, while there is limited data in the euro area. Finally, we expect a 25bp cut from the Bank of England to 3.75%.
Bank of England Preview – Softer Inflation Opens Door for More Easing
- We expect the Bank of England (BoE) to cut the Bank Rate by 25bp to 3.75% but we recognise it is a close call.
- We see a clear, although narrow, path to a 5-4 decision for cut.
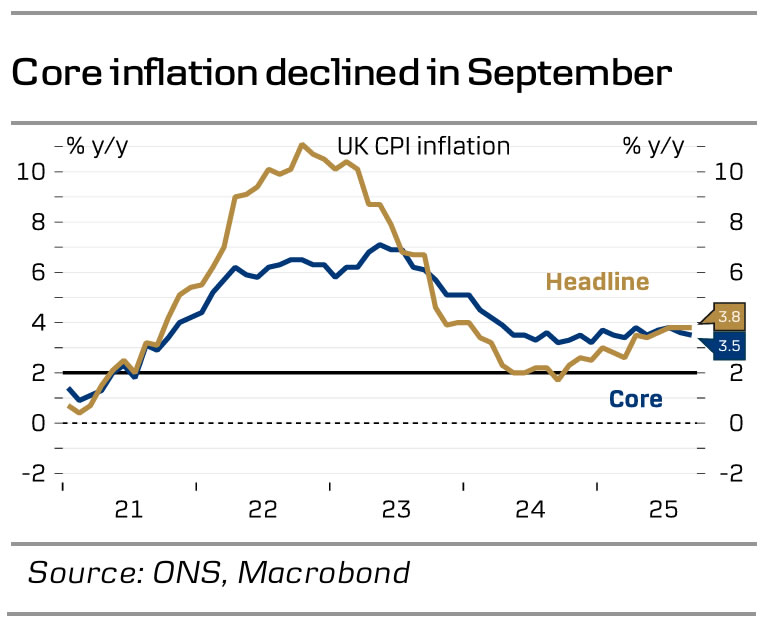
- Since the last meeting, the labour market has continued to cool but the steepness of job losses is not too worrying. Softer inflation data keeps the door open for further easing.
- If we are right, we expect GBP to weaken, and UK yields to drop on announcement.
We expect the BoE to cut the Bank Rate to 3.75% on Thursday 5 November. This is a non-consensus call, and markets are also pricing only about 30% for a cut. We see chances slightly above 50%. Recent data has confirmed that the cooling of the labour market continues but not at an alarming pace. Job loss accelerated although at a moderate pace of 10k in September and previous job losses were revised down. Consumer demand remains moderate with retail sales at 1.5% y/y in September. Both indicating no rush to cut rates.
On the other hand, CPI inflation came in lower than the 4.0% y/y consensus and BoE forecast in September at 3.8%. It was largely driven by lower-than-expected service inflation, which continues to be the main headache for the BoE. Following the CPI release, markets priced in close to 50-50 for a November cut but later retracted.
We see a clear, although narrow path, to pave the way for a cut at the November meeting. Four members of the MPC, Lombardelli, Pill, Mann and Greene will very likely be voting for an unchanged decision. Dhingra and Taylor voted for cut in September and will almost certainly repeat that. Deputy governor Ramsden has been in the dovish camp for long and he is likely to join Dhingra and Taylor. That leaves governor Bailey and deputy governor Breeden (until this date aligned at all meetings) with the deciding votes.
BoE call. With the economy holding up and inflation still quite sticky above target, we expect the BoE to cut rates for the last time in February leaving the Bank Rate at 3.50%. The Autumn Statement is a big joker in all of this. If the Labour government comes through with fiscal tightening as we expect, it will support our call for cutting rates quicker than what is priced in by markets, see also Research UK - Autumn Statement will be key for UK markets.
Market reaction. In our base case of a 25bp cut on Thursday, we expect GBP to weaken on announcement and UK yields to move lower. More broadly, we stay negative on GBP FX as we see the relative growth outlook between the UK and the euro area as GBP negatives. This is further amplified by divergence in the fiscal policy outlook with UK fiscal policy set to be tightened in the Autumn. Additionally, a global investment environment characterised by elevated uncertainty and a positive correlation to a USD negative environment, in our view, favours a weaker GBP. We expect EUR/GBP to trend higher the coming year, targeting the cross at 0.89 in 6-12 months.
EUR/USD Mid-Day Outlook
Daily Pivots: (S1) 1.1529; (P) 1.1583; (R1) 1.1619; More…
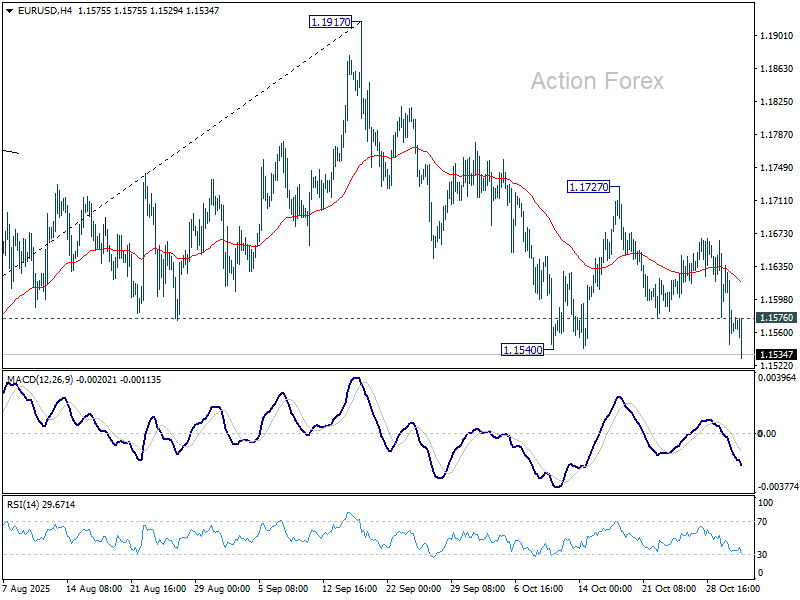
EUR/USD's break of 1.1540 support confirms resumption of the fall from 1.1917. Intraday bias is now on the downside for 1.1390 support. Break there will extend the decline to 38.2% retracement of 1.0176 to 1.1917 at 1.1252. on the upside, above 1.1576 minor resistance will turn bias neutral and bring consolidations first, before staging another fall.
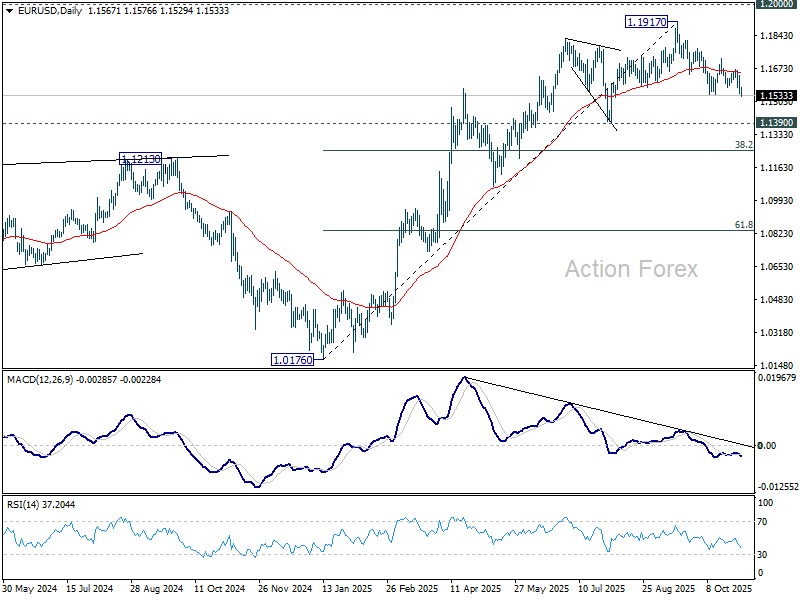
In the bigger picture, considering bearish divergence condition in D MACD, a medium term top is likely in place at 1.1917, just ahead of 1.2 key psychological level. As long as 55 W EMA (now at 1.1301) holds, the up trend from 0.9534 (2022 low) is still expected to continue. Decisive break of 1.2000 will carry larger bullish implications. However, sustained trading below 55 W EMA will argue that rise from 0.9534 has completed as a three wave corrective bounce, and keep outlook bearish.
USD/JPY Mid-Day Outlook
Daily Pivots: (S1) 152.73; (P) 153.59; (R1) 155.02; More...
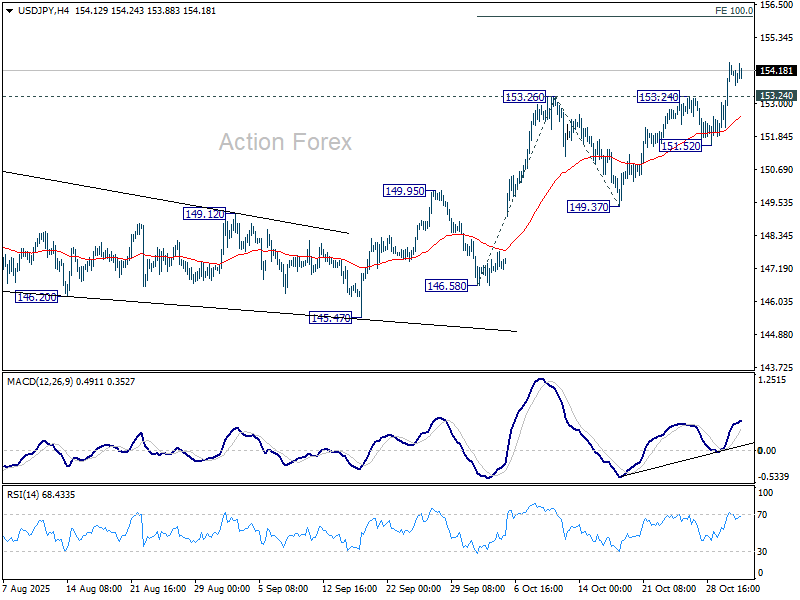
No change in USD/JPY's outlook and intraday bias stays on the upside. Current rally is part of the whole rise from 139.87 and should target 100% projection of 146.58 to 153.26 from 149.37 at 156.05. Firm break there will target 158.86 resistance next. On the downside, below 153.24 resistance turned support will turn intraday bias neutral first. But outlook will stay bullish as long as 151.52 support holds, in case of retreat.
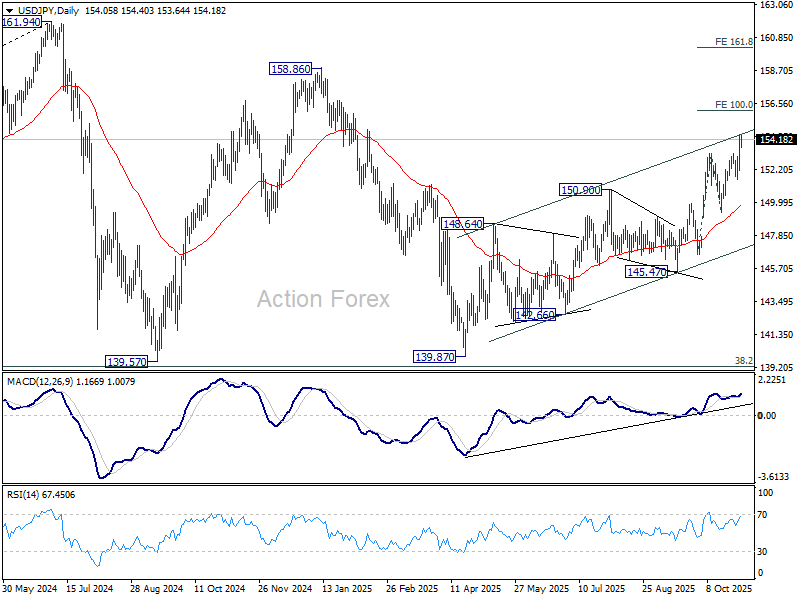
In the bigger picture, current development suggests that corrective pattern from 161.94 (2024 high) has completed with three waves at 139.87. Larger up trend from 102.58 (2021 low) could be ready to resume through 161.94 high. On the downside, break of 145.47 support will dampen this bullish view and extend the corrective pattern with another falling leg.
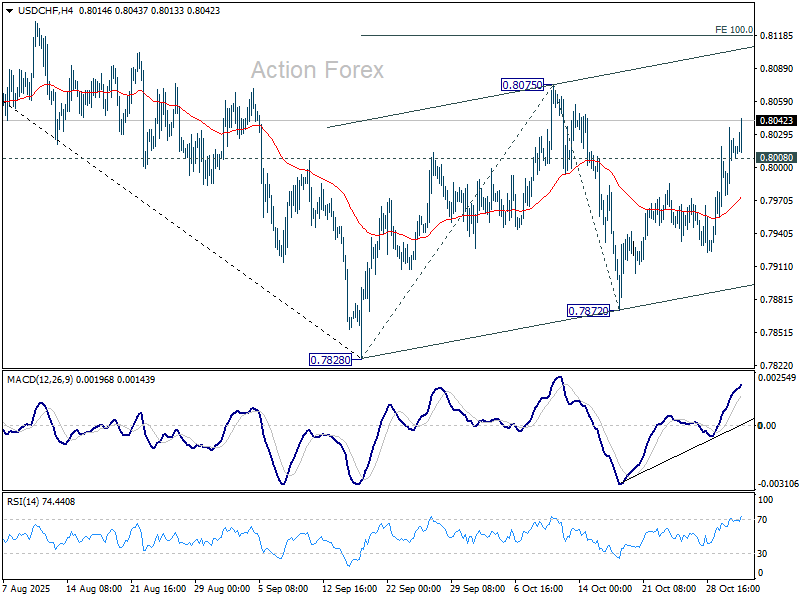
USD/CHF Mid-Day Outlook
Daily Pivots: (S1) 0.7984; (P) 0.8011; (R1) 0.8045; More…
No change in USD/CHF's outlook and intraday bias remains on the upside. Corrective pattern from 0.7878 is in its third leg. Further rise should be seen to 0.8075 resistance. Firm break there will target 100% projection of 0.7828 to 0.8075 from 0.7872 at 0.8119. On the downside, below 0.8008 minor support will turn intraday bias neutral first.
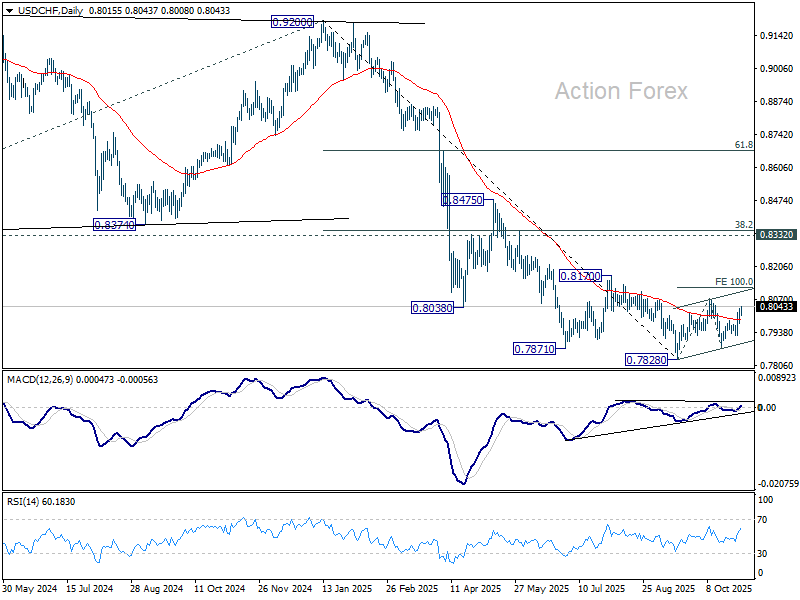
In the bigger picture, long term down trend from 1.0342 (2017 high) is still in progress. Next target is 100% projection of 1.0146 (2022 high) to 0.8332 from 0.9200 at 0.7382. In any case, outlook will stay bearish as long as 0.8332 support turned resistance holds (2023 low).
Canada’s Economy Cooled in August
Canadian GDP contracted by 0.3% m/m in August, against consensus expectations of no growth.
Compositionally, 12 of 20 industries registered a decline on the month. Goods industries (-0.6% m/m) reversed out last month's hefty gain, while the services sector nudged down by -0.1% m/m.
On the goods side, the mining, oil & gas sector lost some steam (-0.7% m/m) after a three-month string of gains. A -0.5% m/m contraction in the manufacturing sector also contributed to the broad-based slowdown in goods sectors.
On the services side, the airline strike activity pushed air transportation lower by 4.6% m/m in August. Meanwhile, wholesale trade declined by 1.2% m/m in August, dragged down by activity in the motor vehicles and parts wholesales subcategory. Retail trade, up 0.9% m/m, offset some of the drag.
Advanced guidance calls for a slight uptick in September GDP (0.1% m/m). Increases in the finance and insurance, energy, and manufacturing sectors are expected to be partially offset by activity in wholesale and retail trade.
Key Implications
Tariff-impacted industries remain under pressure from trade-related challenges. While consumption and domestic demand have shown some stability, third-quarter GDP growth is tracking a paltry 0.4% annualized, consistent with our forecasts and the Bank of Canada's recent October MPR. Official expenditure-based GDP measurement faces heightened uncertainty as next month's trade data will be unavailable due to the U.S. government shutdown.
The BoC has acknowledged that trade-related impacts on inflation and economic growth are become more clear. We'd agree, though that doesn't lower the level of uncertainty in coming quarters as Canada and the U.S. continue to work on hammering out a trade deal. For now, the growth backdrop is expected to remain weak and gradually recover over the medium-term. As such, we maintain our view that the BoC has reached the end of their interest rate easing cycle after delivering a 25 bps cut this week.
GBP/USD Mid-Day Outlook
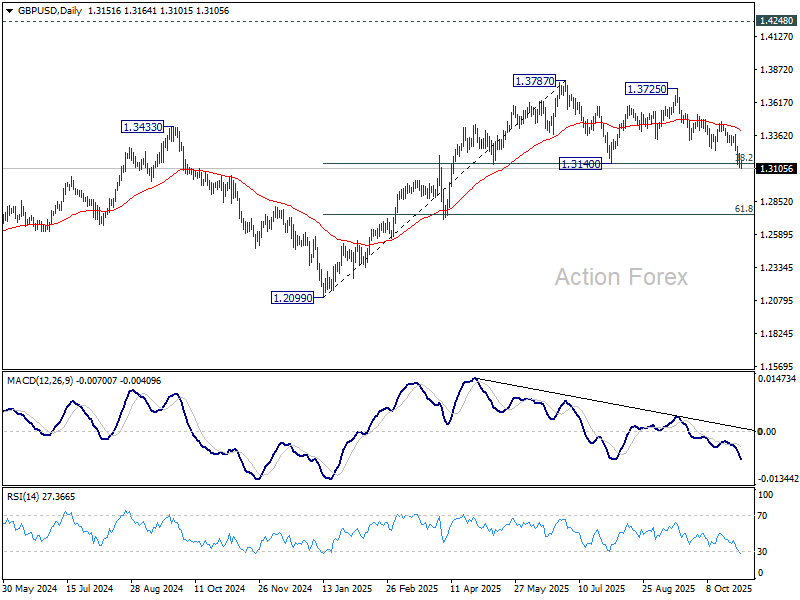
Daily Pivots: (S1) 1.3105; (P) 1.3162; (R1) 1.3207; More...
GBP/USD's decline continues today and the break of 1.3140 cluster (38.2% retracement of 1.2099 to 1.3787 at 1.3142) now suggests that a double top pattern (1.3787/3725) was already in place. Intraday bias stays on the downside for 61.8% retracement at 1.2744 next. On the upside break of 1.3247 support turned resistance is needed to indicate short term bottoming. Otherwise, risk will stay on the downside in case of recovery.
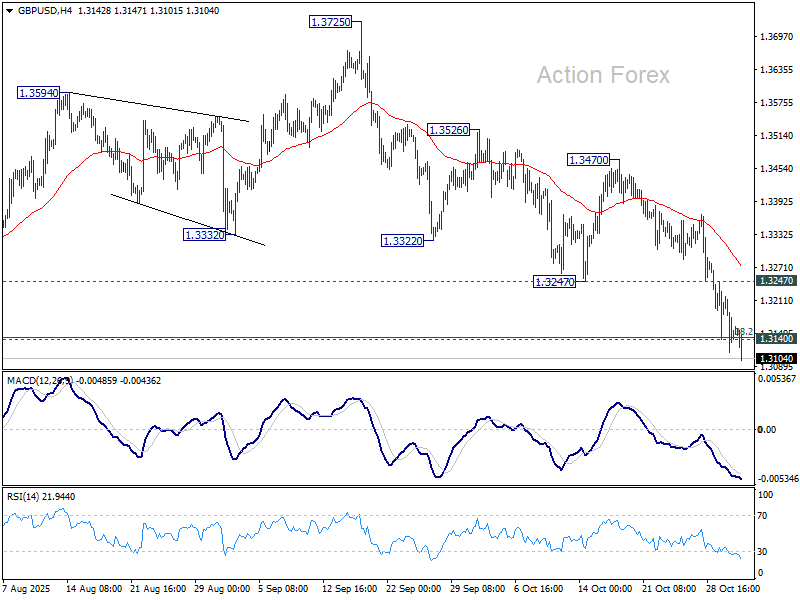
In the bigger picture, rise from 1.0351 (2022 low) is still seen as a corrective move. Sustained trading below 55 W EMA (now at 1.3191) will argue that a medium term top has already formed and bring deeper fall back to 1.2099. Firm break there will confirm bearish reversal. In case of another rise, strong resistance should emerge below 1.4248 (2021 high) to cap upside.