Sample Category Title
EUR/USD Under Pressure
Today, the EUR/USD pair is trading around 1.1560, close to autumn lows. From this week’s high, the pair has fallen by roughly 0.85%, reflecting bearish pressure.
The main factors driving the decline are traders’ reactions to central bank signals:
→ Hawkish Fed rhetoric: On Wednesday, Jerome Powell indicated that further rate cuts are “by no means predetermined.” The Fed continues to see mixed signals from the labour market and inflation data, suggesting it will not rush into easing policy.
→ ECB keeps rates unchanged: Yesterday, the European Central Bank left rates steady. However, markets remain concerned about the slowing economic growth across the eurozone, meaning the ECB cannot afford to tighten policy amid weak activity.
Technical Analysis of EUR/USD
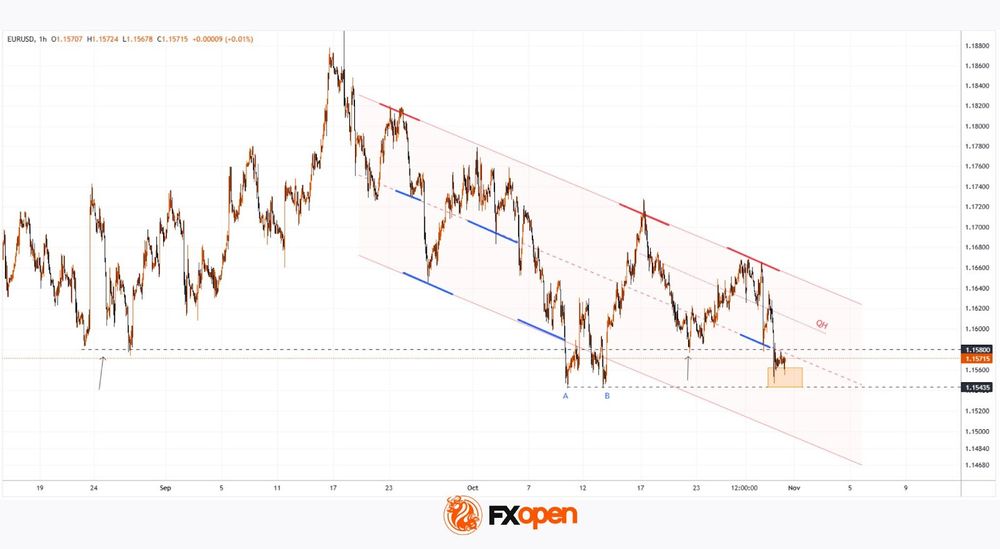
Since mid-September, price movements have formed a descending channel (shown in red). Today, the pair fell below a key support level at 1.1580 (highlighted by arrows).
An earlier attempt to break this support in early October failed — as the pair entered oversold territory below the channel, it formed a double bottom (A–B) before sharply rebounding.
In this context, the 1.15435 level, where the double bottom formed, is significant. The orange-shaded area shows that bulls step in near this level, producing candles with long lower wicks. On shorter timeframes, this behaviour displays signs of a bullish engulfing pattern.
If bears succeed in breaking support, the pair could test the lower boundary of the red channel. Positive news from Donald Trump on progress in trade talks with China could improve the U.S. trade balance, supporting this bearish scenario.
Conversely, if bulls continue defending the 1.1560–1.15435 zone, EUR/USD may rebound, potentially moving towards the QH line.
Trade over 50 forex markets 24 hours a day with FXOpen. Take advantage of low commissions, deep liquidity, and spreads from 0.0 pips. Open your FXOpen account now or learn more about trading forex with FXOpen.
This article represents the opinion of the Companies operating under the FXOpen brand only. It is not to be construed as an offer, solicitation, or recommendation with respect to products and services provided by the Companies operating under the FXOpen brand, nor is it to be considered financial advice.
Eurozone CPI eases to 2.1%, but core holds firm at 2.4%
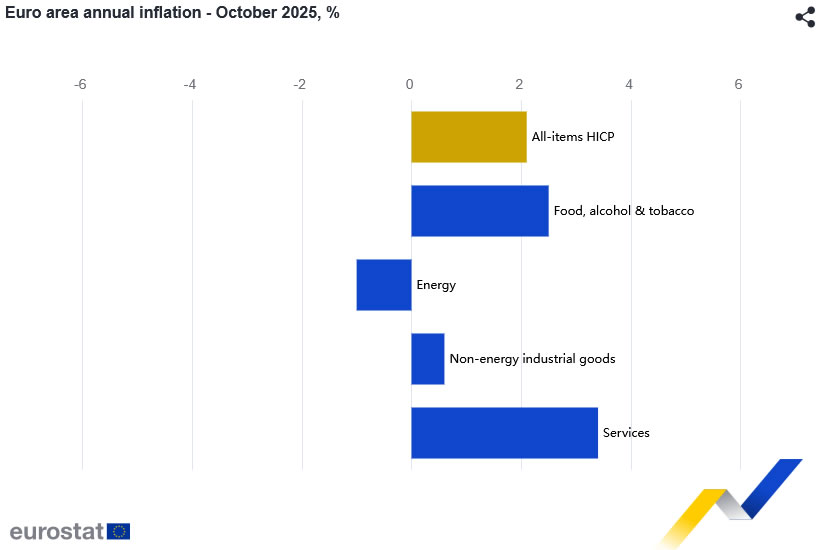
Eurozone inflation slowed slightly in October, though underlying price pressures remained sticky. According to the flash estimate, headline CPI edged down to 2.1% yoy from 2.2%, in line with expectations. Core inflation, which excludes energy, food, alcohol and tobacco, held steady at 2.4%, surprising on the upside compared with forecasts of 2.3%.
A closer look at the breakdown shows services inflation rose to 3.4% from 3.2%, confirming that the most persistent source of price pressure continues to come from the labor-intensive service sector. Meanwhile, food, alcohol and tobacco inflation eased to 2.5%, non-energy industrial goods slowed to 0.6%, and energy prices fell -1.0%, marking a deeper decline than September’s -0.4%.
USD/JPY Hits Nine-Month High as Yen Endures Tough October
The USD/JPY pair climbed to a nine-month high on Friday, approaching the key 154.00 level. The yen concluded October with losses of approximately 4%, marking a highly unsuccessful month. The currency's decline was exacerbated by domestic political shifts, following the election of Sanae Takaichi as Prime Minister. Takaichi is a known advocate for stimulative fiscal policy and the maintenance of ultra-loose monetary conditions—a combination that typically weighs on a currency.
This dovish political backdrop was complemented by the Bank of Japan's decision to hold interest rates steady in October. Governor Kazuo Ueda further dampened sentiment by warning that tighter global trade conditions could stifle economic growth and reduce corporate profits.
In a notable shift, the new Finance Minister, Satsuki Katayama, clarified that she no longer views a yen exchange rate of 120-130 per dollar as appropriate. She emphasised that currency stability is now her primary focus, a comment markets interpreted as a step back from direct intervention.
The yen also faced pressure from a broadly strengthening US dollar. Market expectations for further Federal Reserve rate cuts have receded, while data showing higher-than-expected inflation in Tokyo for October complicated the domestic policy outlook.
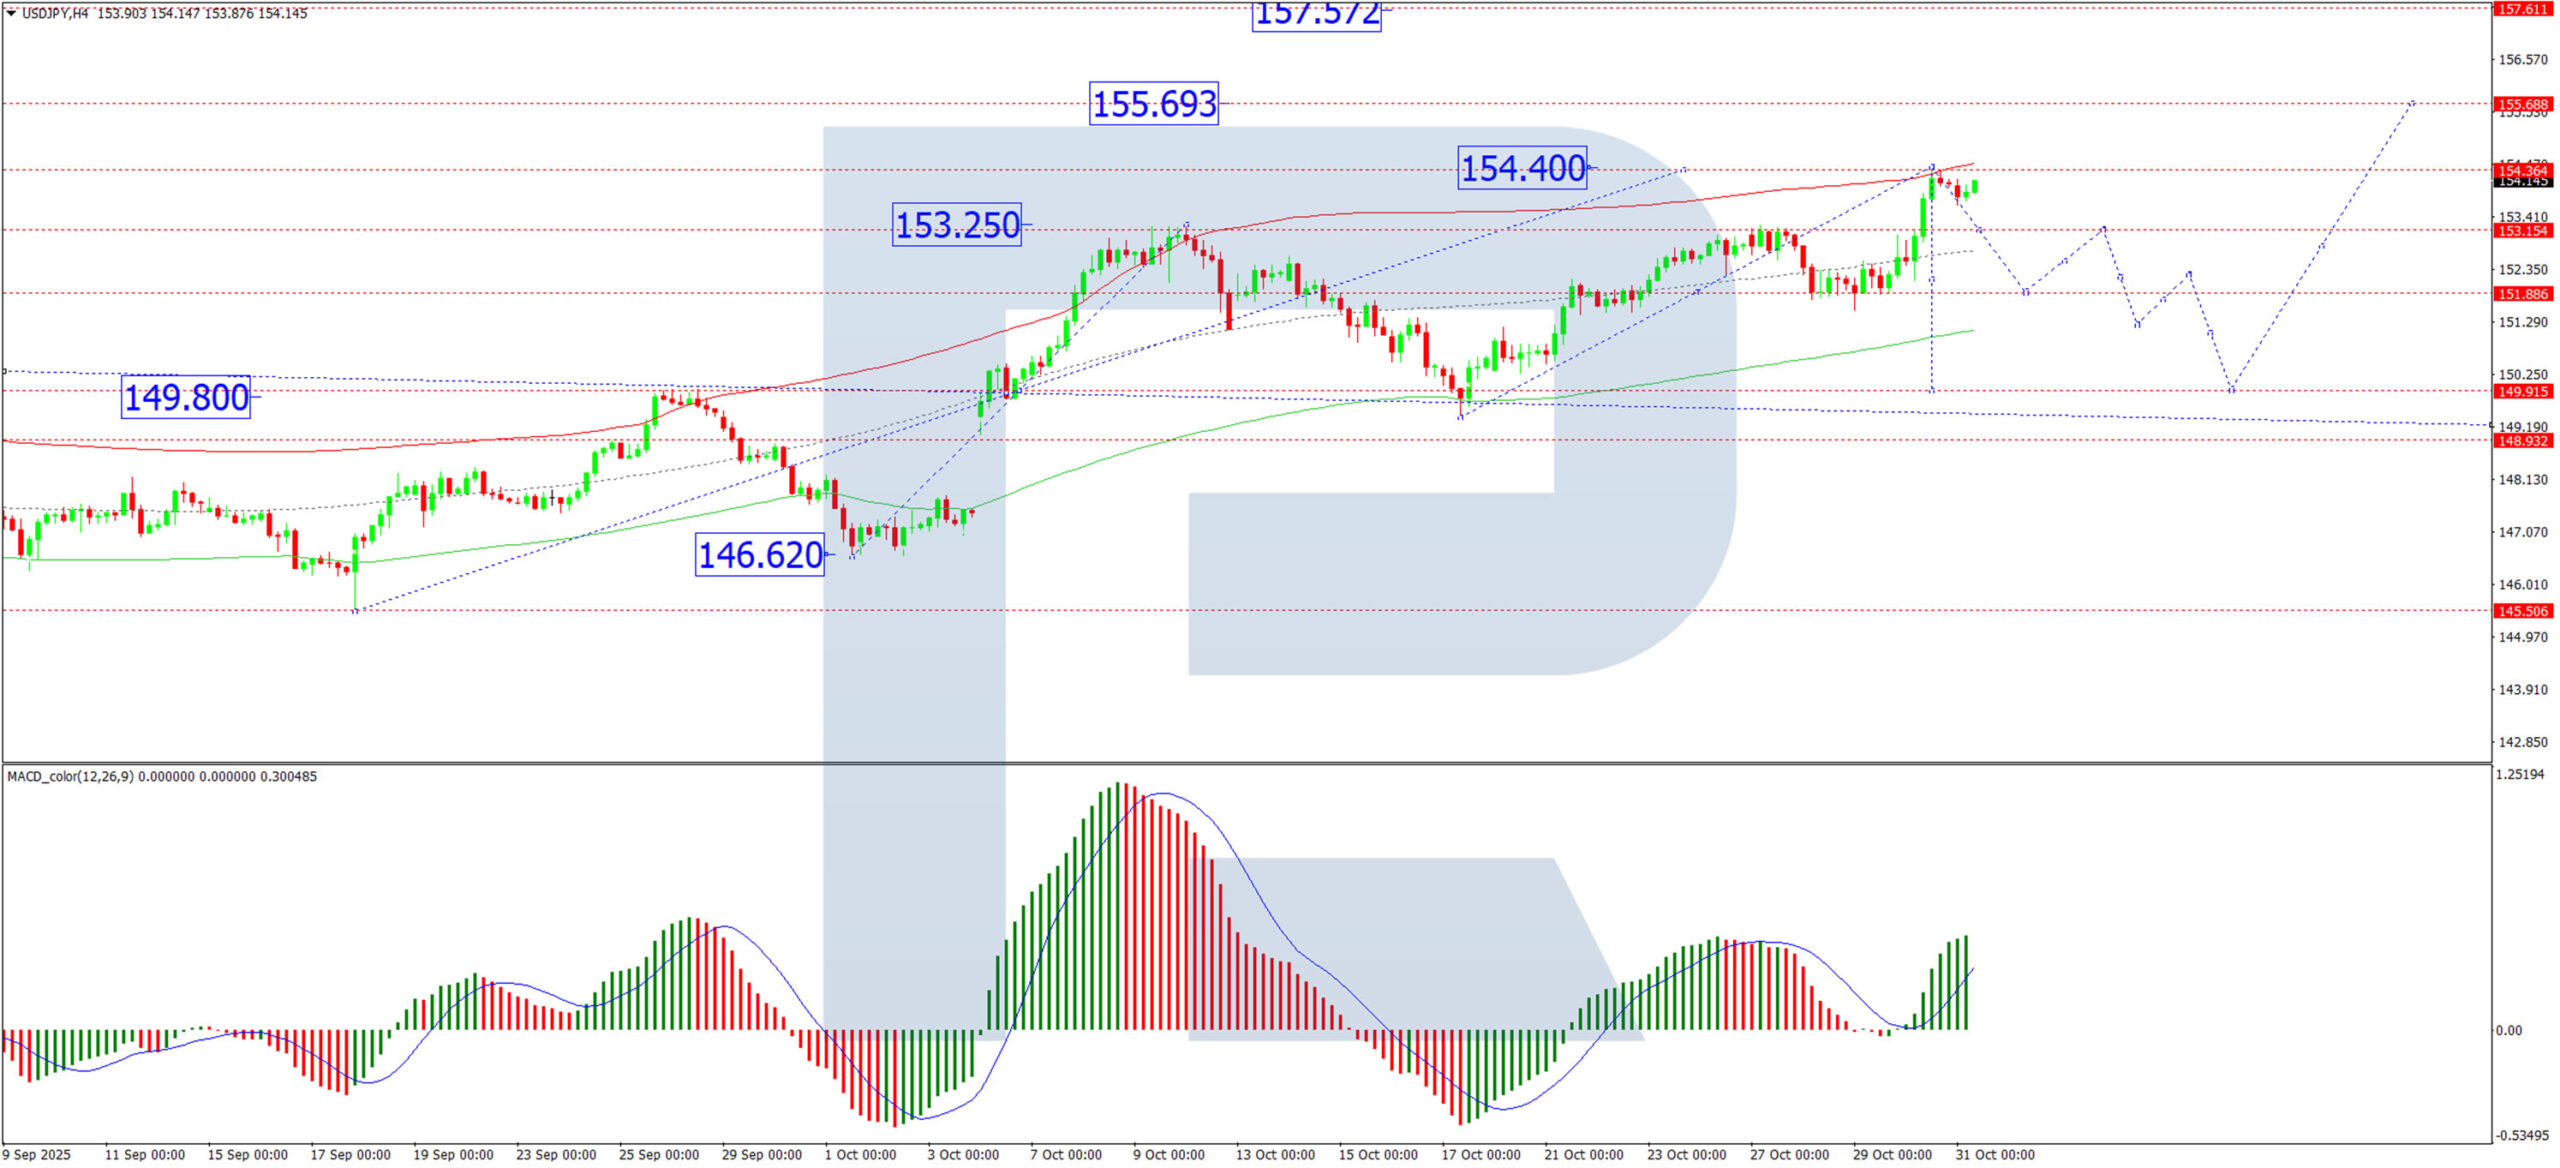
Technical Analysis: USD/JPY
H4 Chart:
On the H4 chart, USD/JPY has completed a bullish wave structure, reaching 154.40. The pair is now likely to enter a period of consolidation at these highs. A decisive downward breakout from this range would signal the start of a correction, with an initial target at 151.88. Conversely, an upward breakout would open the path for the next leg of the rally towards 155.70.
This technical outlook is supported by the MACD indicator. Its signal line remains above zero and is pointing firmly upwards, confirming the underlying bullish momentum.
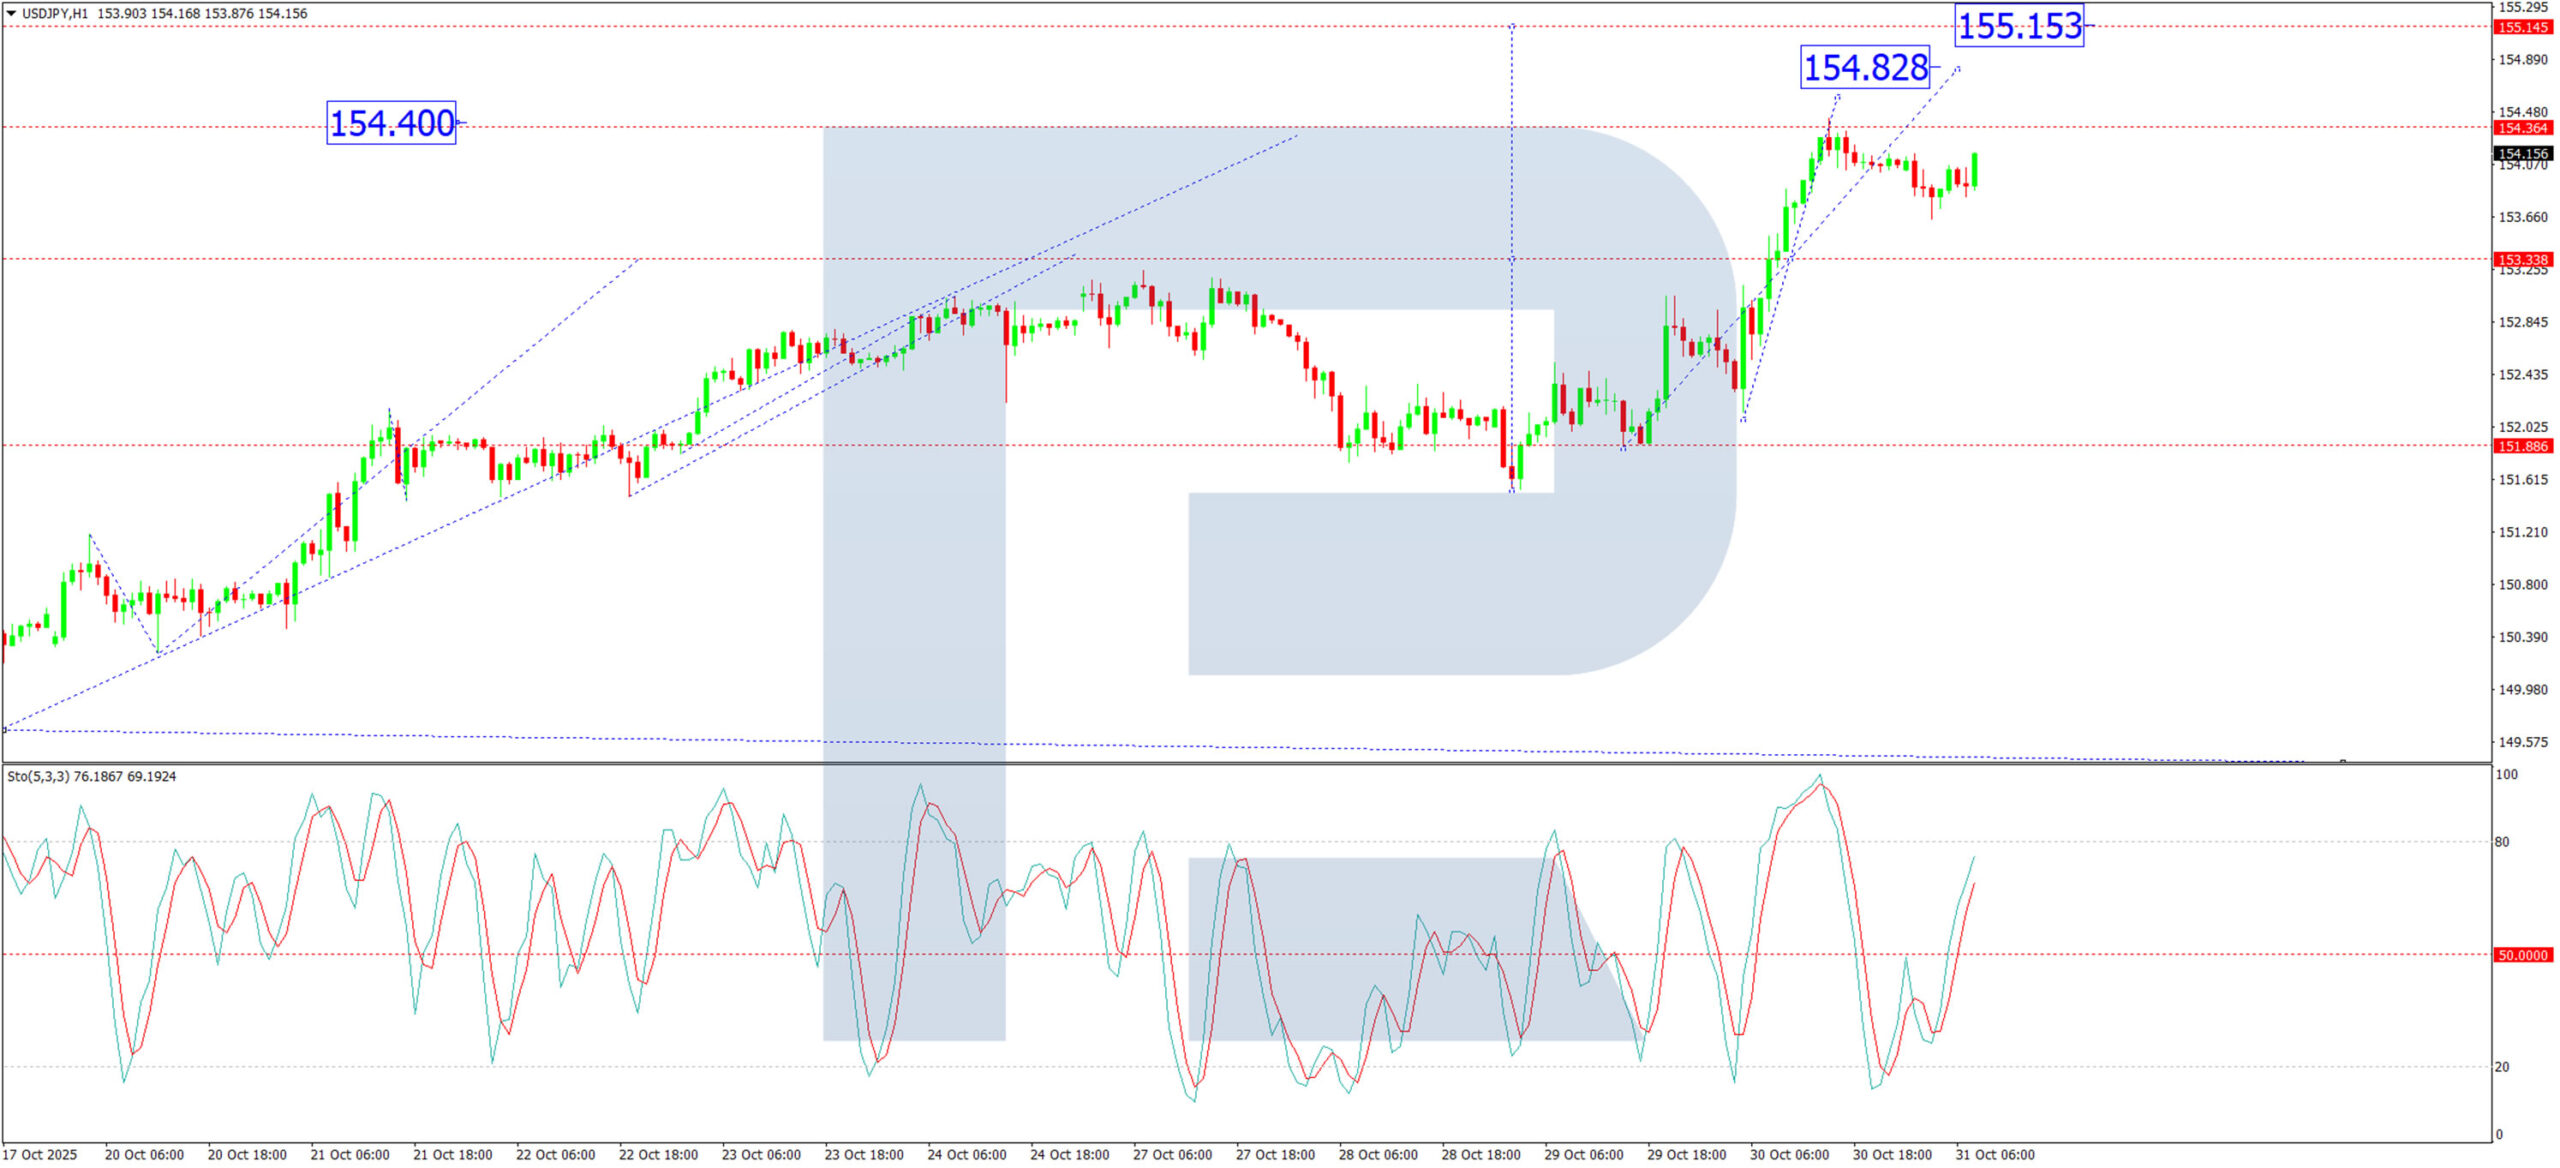
H1 Chart:
On the H1 chart, the market completed an initial growth wave to 153.33, formed a tight consolidation range, and then broke upwards to achieve its local target of 154.40. Following this peak, a pullback towards at least 153.33 is anticipated. Upon finding support, the next upward wave is expected to target 154.83, with the potential to extend the broader bullish trend towards 155.15.
The Stochastic oscillator aligns with this view. Its signal line is above 50 and rising sharply towards 80, indicating that short-term bullish momentum remains intact.
Conclusion
The yen's sharp decline in October was driven by a perfect storm of domestic political and monetary dovishness, coupled with a resurgent US dollar. Technically, USD/JPY's bullish structure is firmly established. While a short-term correction is possible, the path of least resistance remains skewed to the upside, with key targets at 155.70 on the H4 chart. All eyes will be on whether Japanese authorities will transition from verbal intervention to concrete action if the yen's weakness persists.
Cliff Notes: Data Challenges
Key insights from the week that was.
In Australia, the long-awaited Q3 CPI printed materially above market expectations, both on a headline (1.3%qtr/3.2%yr) and trimmed mean (1.0%qtr/3.0%yr) basis. This does not look to be isolated to ‘one-offs’, creating a firmer starting point for inflation moving into the second half of this year. Goods inflation is not providing as much of a disinflationary offset as before – a key dynamic evident globally; but more critically, market services inflation remains ‘sticky’ around the top of the RBA’s 2-3% target band. We are also wary of the fact that some key sub-components are showing signs of a more sustainable pick-up, which suggests that upside risks may also lie ahead.
Earlier today, Chief Economist Luci Ellis detailed the changes to our RBA cash rate forecasts. For the RBA to remain confident that inflation will settle at the mid-point of the target range, multiple quarterly readings on inflation will need to be assessed in detail. For that reason, we now anticipate the RBA to remain on hold until mid-2026, when we expect it will deliver 25bp rate cuts in May and August, bringing the cash rate to 3.10%. We view the risks around our base case as relatively balanced. Given policy is currently restrictive, any further delay raises the probability that the RBA will eventually have to cut the cash rate by more than 50bps to a 2-handle. The recent softening in labour market conditions will remain a key consideration too, but it would take a material weakening beyond our current forecast to warrant the RBA moving any earlier than May.
The FOMC meeting was the most closely watched policy engagement of the week globally. The Committee decided to cut the fed funds rate by 25bps to a midpoint of 3.875% and also announced an end to quantitative tightening from 1 December. There was dissent on both sides for the rates decision, with Miran favouring a 50bp cut but Schmid no change. From the tone of the statement and Chair Powell’s press conference guidance, the Committee remains positive on the underlying health of the US economy and are not overly concerned by the shut down – believing its economic impact will quickly reverse and, in the meantime, that authorities still have enough information on the economy to recognise a material adverse turn, if it were to occur. The October cut was instead characterised as a marginal risk management decision given “downside risks to employment rose in recent months”.
Most members also continue to show concern over upside risks for inflation. In the press conference, Chair Powell stated a rate cut in December is “far from a foregone conclusion” with “strongly differing views” on the short-term path for policy. Later in the press conference, Chair Powell added that a “growing chorus feels like maybe [the] Fed should wait a [meeting] cycle” to assess conditions. While absent from the FOMC’s current narrative, we also continue to believe that capacity is limited in the US economy and so see upside risks to the market’s expected policy rate path to, or through, 3.00% over the next 12 to 18 months. Clearly, if our expectations prove prescient, long-term yields are also likely to rise.
On the same day as the FOMC, the Bank of Canada also cut by 25bps to 2.25%. Guidance suggests this is likely to be the trough for the foreseeable future, with the policy rate now seen as "at about the right level". Growth forecasts were revised down, but the supply shock created by US trade policy is limiting authorities’ ability to stimulate growth while keeping inflation near target.
The Bank of Japan then held its policy rate steady in a 7-2 vote, mirroring September’s decision. Growth for the year ending March was revised up slightly (+0.1ppt) on improved trade certainty, while the inflation projections were broadly unchanged. Inflation is expected to soften through 2026 due to easing food prices and base effects, but the Committee remains confident inflation will be near the 2.0% target at the end of the projection period. Inflation’s persistence and a tight labour market continue to support wage growth. However, weak firm profitability poses a risk to achieving policy’s goal. The Committee reiterated its commitment to further rate hikes but gave no timing guidance. We expect the next move in March, though stronger-than-expected financial and wage data could bring January into play.
The ECB also delivered no surprises, the Governing Council keeping the deposit rate at 2.0%. No updated economic projections were published at this time, and the policy statement maintained the existing forward guidance wording – stating that the Governing Council “will follow a data-dependent and meeting-by-meeting approach to determining the appropriate monetary policy stance”.
President Lagarde struck a somewhat more positive tone regarding the euro area’s economic growth outlook, suggesting that the EU-US trade deal reached over the summer, the ceasefire in the Middle East, and progress in US-China trade negotiations have reduced some of the downside risks. Regarding inflation, Lagarde once again noted that underlying inflationary pressures remain consistent with the ECB’s target, reiterating her view that monetary policy is in a good place.
Towards the end of the week, the meeting between President Trump and President Xi delivered to expectations, with both sides discarding threatened actions and edging back protectionist measures already in place. The US agreed to halve the tariff related to fentanyl from 20% to 10% after China agreed to crack down on the production and distribution of the chemicals used to make it. China also agreed to buy soybeans from the US and delay the rare earth restrictions they had planned to put in place. Note though the licencing regime for rare earths announced earlier in the year will reportedly remain in place.
Evident in the initial readout from last week’s Plenum and a subsequent pledge by authorities to materially increase consumption’s share of China’s economy, President Xi and the Central Government are increasingly turning their attention away from relations with the US to domestic development priorities and the continued strengthening of relationships across Asia, South America and Africa. This is where China sees opportunity for activity and income growth and a further strengthening of China’s position in the global economy.
Trick or Treat? Inflation Spooks RBA, Longer Wait for Cash Rate Cuts
It will likely take more than one quarter to undo the shock of the September quarter CPI. Two cash rate cuts expected, in May and August; a later start would induce additional easing.
- As flagged earlier in the week, the RBA is now expected to keep the cash rate on hold in November and December. A February cut is also unlikely unless the labour market deteriorates in the near term by more than we expect.
- Monetary policy is still somewhat restrictive, so some further cuts to the cash rate next year are warranted. Our revised inflation forecast starts higher than previously but still goes below the midpoint of the RBA’s 2–3% target range, troughing at 2.3%. Without further rate cuts, inflation would fall further than this. We therefore expect two more 25bp cuts; the earliest likely date for the first of these cuts is now May (to 3.35%), followed by August (to 3.1%). If the RBA instead waits beyond May to start cutting, we anticipate an additional cut late 2026 to a trough of 2.85%.
- Our revised outlook incorporates the stronger starting point for consumption flagged in the October Market Outlook and our revamped Card Tracker data. Without further rate cuts, though, we anticipate this consumer recovery would fade quickly. A slightly weaker starting point for the labour market also sees the peak for the unemployment revised up to 4.6% late next year.
As we flagged earlier this week, the release of higher-than-expected inflation data will have spooked the RBA and taken a cash rate cut off the table for November. We never expected a follow-up cut in December, noting the RBA Monetary Policy Board’s (MPB) preference for caution.
There is a pathway to a February rate cut, but only if the labour market deteriorates more than expected in the next couple of months, and the emerging consumer recovery falters quickly. This is not our expectation. Although we expect the December quarter inflation data to be a lot less scary than the September quarter, we think it will take more than one quarter of data to convince the RBA that the inflation trend is still consistent with target beyond the short term. This is particularly so given that a couple of CPI categories, including home-building prices and AV-related services, do look to be seeing a sustained pick-up.
Our base-case expectation is therefore now that the RBA does not cut the cash rate until May 2026, to 3.35%. A further 25bp cut to 3.1% in August is also expected.
Monetary policy is still somewhat restrictive. Further cuts to the cash rate next year are therefore warranted given that underlying inflation will remain within the band and be heading down in coming quarters. We concur with the RBA that it is not sensible to be too precise about where the ‘neutral rate’ is at any point in time. That said, a 50bp adjustment to the cash rate from here can be reasonably seen as removing the remaining restrictiveness of policy.
The higher starting point for trimmed mean inflation lifts the inflation outlook in the near term. But with interest rates a bit higher for longer and the gradual softening in the labour market already underway, there is downward pressure on inflation further out. (We are looking to see whether the RBA’s revised forecasts next week incorporate this point and have a downward slope, or whether the flat profiles of the previous three forecast rounds are still favoured.)
Our revised forecasts, also published today, still show trimmed mean inflation drifting below the midpoint of the RBA’s 2–3% target range, troughing at 2.3% late in 2026. If things turn out as our forecasts imply, the RBA’s forecasts will also be revised down over time, if they do not already show a similar low point next week. That in turn would drive a decision to remove the current restrictive stance of monetary policy to avoid inflation going below the bottom of the target.
We had already revised up our near-term forecast for consumption in light of stronger internal data on spending. These data, as shown in our revamped Card Tracker, suggest that the consumer recovery is now on a firmer footing. We believe that the bounce-back in national accounts measures of consumption will be another factor keeping the RBA on hold for longer.
Our internal data also show, however, that the pick-up in spending is concentrated among mortgagors, that is, people with mortgage debt. Renters and people who do not pay either rent or mortgage repayments have not increased their spending to the same extent. This leads us to suspect that there is a risk that this recovery is a relief rally, contingent on the cash rate cuts that have been seen so far. If rates were to remain on hold from here, that recovery would falter and fade out over 2026, especially given that jobs growth has slowed and the unemployment rate has drifted up marginally. The sizeable impulse coming from the Stage 3 tax cuts (more than $20bn a year) will also be fading.
We also expect that the slightly weaker starting point for the labour market and later date for cash rate cuts implies a softer outlook for employment. We have revised up the peak for the unemployment rate to 4.6%, late in 2026. The RBA has repeatedly stated (correctly) that it does not mechanically map its assessment of ‘full employment’ to a particular level of the unemployment rate. That said, it is clear from the RBA’s
internal analysis released under Freedom of Information law that it would not consider the labour market to be ‘a little tight’ at that level. Assuming the RBA does indeed cut the cash rate on the expected timetable, some recovery from that point is expected over 2027.
Given the RBA’s determination to reach the exact midpoint of its 2–3% target range, it is possible that even two quarters of more moderate inflation relative to the September quarter outcome will not be enough to convince the MPB that further rate cuts are needed. The bias to stay on hold will be strong given the uplift in consumer spending and the brisk recovery in housing prices. As noted earlier in the week, we therefore contemplate an alternative scenario where the cuts to the cash rate do not start until August (or even later). This would see further easing in both the labour market and the inflation outlook, and a larger eventual policy response needed by the RBA. A third cut would take the cash rate to 2.85%, a level that is probably mildly supportive and would help return inflation to the target midpoint from below.
There is also a more hawkish case that could be made for the rates outlook, but it would require developments that we do not think are that likely. Firstly, it would require the consumer recovery to accelerate in the face of ongoing (slightly) restrictive monetary policy and a softening labour market. Unless household income growth also improves, real consumer spending power will be constrained and the recovery would falter, much as we saw earlier this year. Secondly, it would imply that Australia is facing renewed ongoing domestic inflation pressures, either because interest rates at current levels are actually stimulatory, or because the labour market is tighter than we believe. We do not think the data support either interpretation, noting among other indicators of domestic financial conditions that household credit is not rising faster than household income, and that wages growth has not been surprising on the upside.
Our base case therefore moves to two cash rate cuts, in May and August, with a decent chance of a later timing and larger number of cuts if the RBA has been so spooked by this week’s inflation data that it delays even further.
Powell Forces Money Markets into Resetting View on a December Rate Cut
Markets
Yesterday’s ECB meeting was a non-event that, if anything, further raised the bar for rate cuts as downside risks to growth abated. ECB president Lagarde was referring to the US-EU trade deal, the ceasefire in the middle east and the progress made in the US-Sino relations. European yields were little changed. Bunds underperformed vs swap, adding 1.1-2.2 bps across the curve. US yields rose 1.1 bp at the front end, following Wednesday’s 10bps+ move higher. Powell forced money markets into resetting their view on a December rate cut (currently given a 65% probability compared to quasi 100%). That process could linger on for a while. Long-term bond yields added 3 bps with the 10-yr yield bottoming out further north of 4%. The Fed announced an end to QT but it will skew the proceeds from maturing bonds towards T-bills. UK rates are showing some similar bottoming out. The 10-yr Gilt yield hit strong support at 4.4% earlier this week, the 2-yr tenor is looking at 3.8%. We consider front end yields to be the most prone for a further decline. UK money markets keep gravely underestimating chances for the Bank of England to cut rates next week (25%) and in coming months. It may be the trigger that pushes GBP over the EUR/GBP 0.88 edge. The pair tested that barrier multiple times this week, including yesterday. The US dollar outperformed, supported by the modest risk-off vibes. EUR/USD revisited the previous October lows around 1.154 but closed at 1.1565. DXY (99.52) hit a 3-month high intraday of 99.91. USD/JPY strongly supported the trade-weighted dollar’s upleg. The Bank of Japan disappointed and added JPY weakness to overall USD strength. USD/JPY pierced through 154 for the first time since February.
The ongoing US government shutdown means we won’t get personal income and spending data. Neither will the PCE inflation indicators be released. It is this lack of economic input that prompted amongst others the Fed to poor cold water over the idea that a December rate cut is all but certain. Focus shifts to the euro area instead where headline inflation is expected to have eased from 2.2% to 2.1%. The core gauge would drop from 2.4% to 2.3%. Based on this week’s earlier member states’ release we see some upward risks but it won’t move markets much after the ECB basically cemented the long status quo. Stock sentiment will be the more important driver for markets in general going into the weekly and monthly close. Futures in Europe are signaling a modest red open. Those in the US are flashing green, supported by bumper earnings from Apple and Amazon. EUR/USD gently gravitates towards the October lows. A break would pave the way for a return to the August low (1.1392). EUR/GBP is taking another shot at 0.88.
News & Views
Tokyo inflation accelerated significantly and more than expected in October. Overall prices jumped by 0.6% M/M in the Japanese capital, both on a headline and a core (ex fresh food) level. Goods prices were up 0.9% and services 0.4%. Out of all reported subcategories, only prices for clothing & footwear were lower in October (-0.1% M/M) though coming off a 3.3% increase in September. Utility prices stood out with a 4.8% monthly increase as city-wide subsidies for water have run their course. On an annual level, Tokyo CPI accelerated from 2.5% to 2.8%, again both for headline and core inflation. Today’s numbers come on the heels of yesterday’s BoJ decision to stand pat at the moment and see how the economy and inflation both evolve with the intention to conduct a new rate hike in due time. The market implied probability that this could happen at the next, December, meeting remains broadly unchanged around 50% this morning. Other Japanese data this morning included disappointing September retail sales (0.3% M/M & 0.5% Y/Y) and stronger industrial production numbers (2.2% M/M & 3.4% Y/Y).
Official Chinese PMI for October showed the composite PMI sliding from 50.6 to 50, the boom/bust level representing no growth. The manufacturing sector remains mired in (mild) contractionary territory (49 from 49.8) while the services sector barely keeps its head above the water line (50.1 from 50). Manufacturing details showed a faster decline in new orders (also export) and a continuation of job axing. Price gauges showed higher input prices contrasting with lower output prices. Under the hood of the non-manufacturing PMI details were similar and weak as well with the exception of also falling selling prices.
Trick or Threat?
US markets fell yesterday as investors questioned the wave of higher AI spending pledged by Big Tech, even though every major name that reported this week beat lofty expectations on earnings, revenue and cloud growth. The Nasdaq 100 dropped nearly 1.5%, with Microsoft down almost 3%, and Meta plunging 11%, breaking below its 200-day moving average without finding enough dip buyers to reclaim it. Alphabet opened at an all-time high but spent the session giving back early gains to close with a modest 2.45% post-earnings rise.
The selloff likely reflects the broader macroeconomic backdrop, as Treasury yields climbed after Federal Reserve (Fed) Chair Powell said earlier this week it’s “not clear” another 25 bp cut will come in December.
The good news: Apple and Amazon extended the streak of better-than-expected results after the bell. Apple — not the market’s hottest AI play — beat forecasts on strong iPhone sales and upbeat holiday guidance. Amazon delivered its fastest AWS growth since 2022, a relief for investors who had questioned its – and its peers’ - heavy data-center spending. In reality, these firms are racing to meet demand that, according to Microsoft, is running well ahead of their capacity. With AI applications expected to double computing needs every 9 to 18 months, supply is struggling to keep pace. That makes today’s spending look aggressive — but necessary. Until we see signs of oversupply, there’s little reason to worry about capex excess.
Overall, Big Tech wrapped up the earnings season on solid footing despite mixed price reactions — largely a Fed-driven sentiment issue rather than a fundamental one. Nasdaq futures are higher this morning, buoyed by Amazon’s 13% post-earnings jump — the biggest among the “Magnificent Seven” this week.
Today attention turns to the oil majors, with Exxon Mobil and Chevron reporting earnings expected to show modest year-on-year declines as softer oil and gas prices bite. Both face the same test: protecting profitability and capital discipline in a lower-price environment while reassuring investors about cash returns and production outlooks. Recent tactical longs built on renewed Russia-related tensions are now taking profits. WTI crude has found support near $60 a barrel, but if US output keeps recovering, there’s a greater risk of a break below $60 than a rebound above it.
Meanwhile, the US dollar has been recovering since Powell’s comments dampened hopes for a December rate cut. The EURUSD trades below 1.06 after the European Central Bank (ECB) held rates steady as expected, with Lagarde saying policy is “in a good place.” Policymakers sounded slightly more upbeat, citing easing downside risks as trade tensions with the US subside, while keeping their inflation outlook broadly unchanged. Traders now price in no further rate cuts over the next year. Still, despite the ECB’s slightly hawkish tone, the euro’s top-heavy formation may persist if the Fed turns more hawkish — since the ECB’s pause was priced in, while the Fed’s stance surprised markets. Today’s focus in Europe will be the October preliminary inflation data, expected to confirm slowing price pressures across the region, which could further strengthen the bears’ hand.
Across the Channel, sterling came under pressure this week, with the GBPUSD testing the 38.2% Fibonacci support of its year-to-date rally. A decisive break would push the pair into a bearish consolidation zone, raising the risk of a deeper pullback — consistent with fundamentals as the Autumn Budget looms and UK growth prospects remain subdued.
In Japan, the USDJPY climbed to 154.45 on dovish shift in BoJ expectations due to the new PM Takaichi’s explicit preference for a soft monetary policy.
In metals, gold is heading for a second consecutive weekly loss, though selling pressure has eased despite higher yields, a firmer dollar and encouraging trade news. Volatility remains elevated, suggesting room for a short-term pullback before stability returns. But the long-term picture is unchanged: surging sovereign debt across developed economies, fragile major currencies and sustained central-bank gold buying continue to support appetite for gold — and other hard assets — over the medium to long term. In that context, precious, industrial,and rare-earth metals should remain in demand.
ECB Kept Rates Steady as Euro Area Growth Strengthens
In focus today
In the euro area, flash inflation data for October is set to be released. Yesterday, inflation in Germany and Spain surprised to the upside, with headline inflation reaching 2.3% y/y and 3.2%, respectively. Consequently, we now expect euro area HICP inflation to remain steady at 2.2% y/y in October, revising our initial estimate of a decline to 2.1% y/y.
In Norway, we expect the seasonally adjusted unemployment rate to remain unchanged at 2.1% in October. However, a slight increase in the number of fully unemployed people suggests that the labour market is gradually softening. Additionally, keep an eye on the number of new vacancies, which has been on an increasing trend after the summer. This may indicate that employment may rebound later in the fall.
Economic and market news
What happened overnight
In China, the manufacturing PMI for October fell to 49.0, remaining in contraction territory as weaker new orders pointed to fragile demand. The data reflected pre-National Day holiday demand and fading front-loading to the US. Meanwhile, the non-manufacturing PMI stayed slightly above 50, signalling stabilisation without a strong rebound. The data suggests that additional stimulus measures may be needed to bolster domestic demand.
In Japan, Tokyo inflation accelerated to 2.8% y/y in October, up from 2.5% in September, driven primarily by higher water charges. The faster pace of inflation bolsters the case for the Bank of Japan to continue its gradual interest rate hikes, sustaining market expectations of a potential near-term increase. Meanwhile, retail sales rose 0.5% y/y in September, below the expected 0.8% growth.
What happened yesterday
The ECB kept its policy rates unchanged, with the deposit facility rate at 2.00%, as expected by markets and consensus. The inflation outlook remains broadly unchanged, and no new guidance was provided. President Lagarde noted that several downside growth risks have eased, citing the US-EU trade deal and improved US-China relations. We maintain our view that the ECB will keep policy rates unchanged in 2025 and 2026. For details see ECB review - Abated downside growth risks, 30 October.
In the euro area GDP grew by 0.2 % q/q in Q3, exceeding expectations, and improving from a 0.1% q/q increase in Q2. This outcome aligns with signals from earlier country-level data. While detailed drivers of growth are not yet available, exports were the primary contributor to growth in France and Italy, whereas domestic demand drove the expansion in Spain. The ECB's September staff had anticipated 0.0% q/q growth, making this a positive surprise for policymakers and supporting the view that current interest rates are "in a good place." We expect the euro area economy to maintain a similar growth pace in the final quarter of the year, as October PMI data suggests sustained momentum. Meanwhile, the unemployment rate held steady at 6.3%, which, together with rising real incomes, continues to support household consumption.
Inflation data from Germany showed a slight upside surprise in October, with headline inflation at 2.3% y/y (cons: 2.2%) down from 2.4% y/y in September. While energy and food inflation eased, core CPI inflation remained stable at 2.8% y/y, as services inflation rose to 3.5% from 3.4% y/y. The persistence of services inflation in Germany provides a mildly hawkish signal. Similarly, inflation in Spain also surprised to the upside, with headline inflation rising to 3.2% y/y (cons: 3.0%). As a result, we now expect euro area HICP inflation to have held steady at 2.2% y/y in October, contrary to our initial estimate of a decline to 2.1% y/y.
In Sweden, the NIER Economic Tendency Survey rose for the fourth consecutive month in October to 100.8, surpassing its historical average for the first time since July 2022. Consumer confidence increased for the sixth month to 96.8, nearing normal levels but still held back by cautious views on major purchases. Manufacturing confidence edged up to 100.2, aligning with its historical average, highlighting broad-based economic improvement.
Equities: Equities drifted lower through much of the trading session yesterday with S&P500 down -1%, Nasdaq -1.6% and Russell 2000 -0.8% respectively. However, futures are up since the close due to strong earnings particularly from Apple and Amazon. In particular Amazon and its cloud services was strong. With more than 60% of S&P companies have reported their Q3 earnings, it's fair to argue that this reporting seems to turn out strong, with strong E's (almost) across the board. Defensives, led by consumer staples, are underperforming cyclicals, but that is also as expected in the current macroeconomic backdrop. Overnight equities are mixed with Nikkei up 1.7% (amid higher-than-expected inflation) and Shenzhen down 1% at the time of writing.
FI and FX: Fixed income and FX markets are largely stable overnight, following a busy week with central bank meetings. EUR/USD dropped below 1.16 in yesterday's session and has traded in a range of 1.1560-1.1580 since yesterday afternoon, with the ECB meeting having little impact on the pair. While US data releases continue to be postponed due to the government shutdown, PCE inflation data is scheduled to be released today. In Norway, today's attention will be on the labour market report and Norges Bank's announcement on the daily FX transactions for November. As for the SEK, monthly rebalancing flows should entail some moderate SEK-selling over month-end.
GBP/JPY Daily Outlook
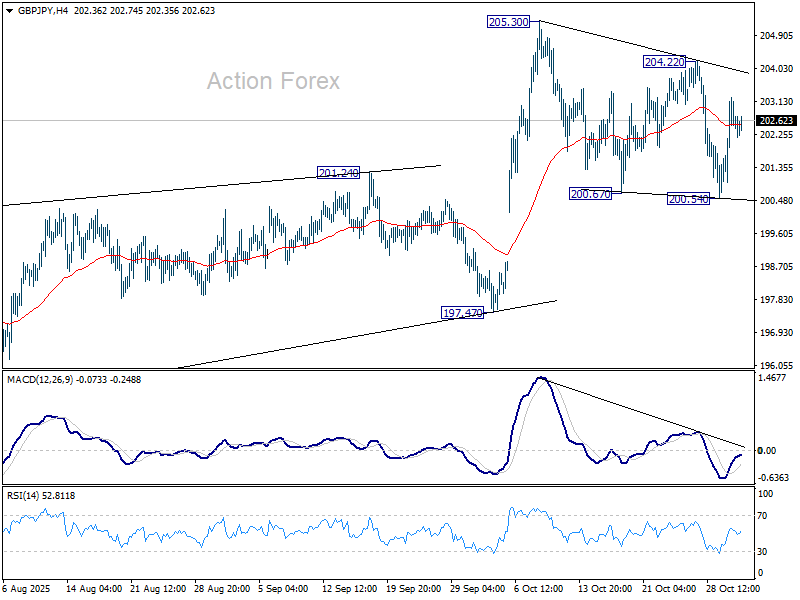
Daily Pivots: (S1) 201.38; (P) 202.33; (R1) 203.65; More...
Intraday bias in GBP/JPY remains neutral at this point. On the upside, break of 204.22 will affirm near term bullishness and target 205.30 high next. Nevertheless, below 200.54 will extend the fall from 205.30 towards 197.47 key structural support.
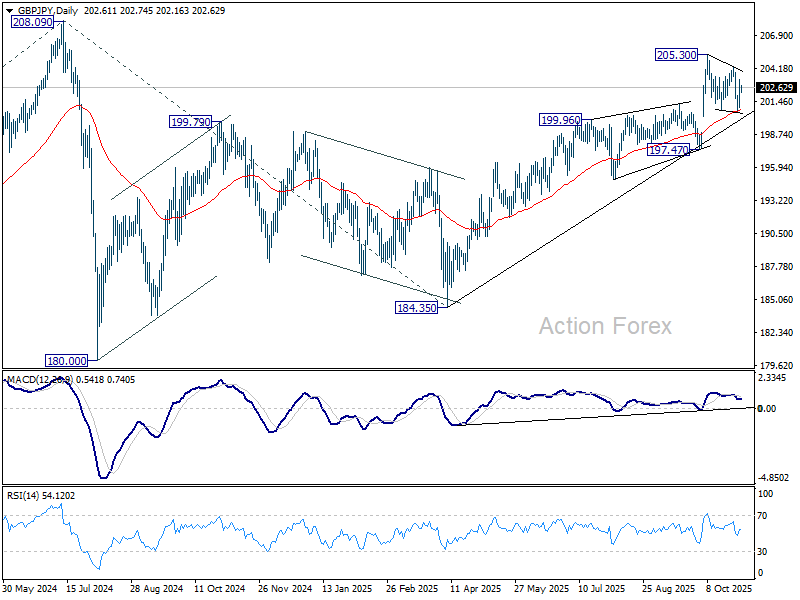
In the bigger picture, price actions from 208.09 (2024 high) are seen as a corrective pattern which might have completed at 184.35. Firm break of 208.09 high will resume the up trend from 123.94 (2020 low). Next target is 61.8% projection of 148.93 to 208.09 from 184.35 at 220.90. However, decisive break of 197.47 support will dampen this view and extend the corrective pattern with another fall.
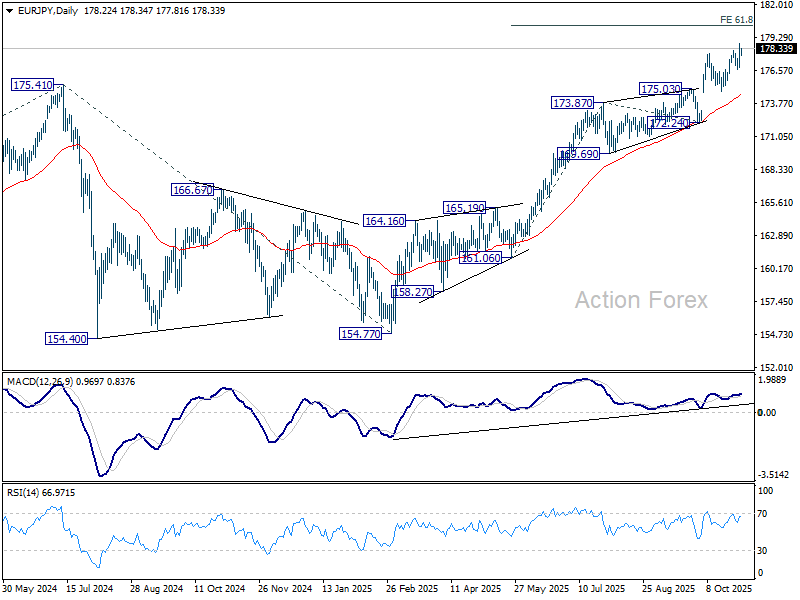
EUR/JPY Daily Outlook
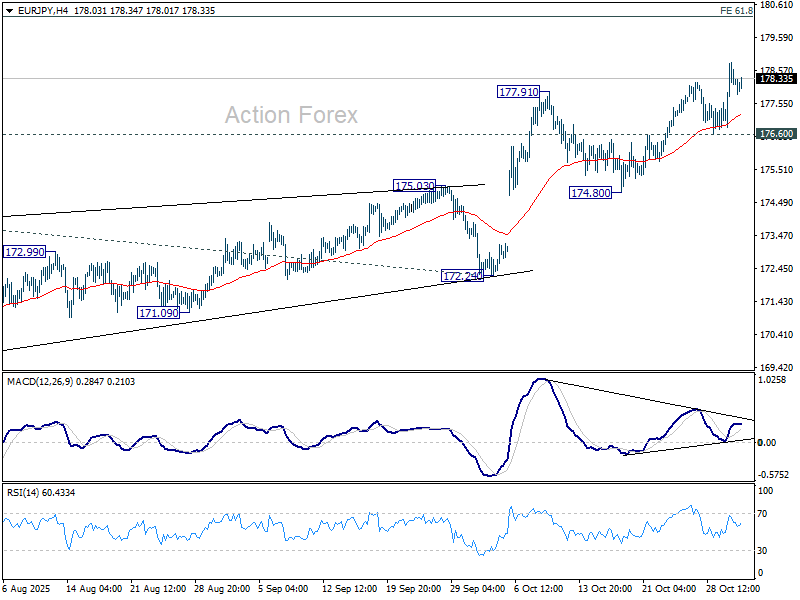
Daily Pivots: (S1) 177.14; (P) 177.98; (R1) 179.14; More...
Intraday bias in EUR/JPY stays on the upside for the moment. Current up trend should target 61.8% projection of 161.06 to 173.87 from 172.24 at 180.15 next. On the downside, below 176.60 will turn bias neutral again. But overall outlook will remain bullish as long as 174.80 support holds, in case of retreat.
In the bigger picture, up trend from 114.42 (2020 low) is in progress and should target 61.8% projection of 124.37 to 175.41 from 154.77 at 186.31. Firm break of 172.24 support will suggests that it has turned into consolidations again. But still, outlook will continue to stay bullish as long as 55 W EMA (now at 167.87) holds, even in case of deep pullback.