
Sample Category Title
US-China Trade – Xi and Trump Put a Lid on Trade Tensions Once Again
- The meeting between Trump and Xi did not contain any surprises after the framework deal was revealed over the weekend. China achieved reduction in Fentanyl related tariffs while Trump secured soybean exports being resumed and China delaying its' export controls by at least a year.
- It is positive the two sides are able to de-escalate tensions quick and provide calm back into the global trading system. We expect to see more bumps on the road, but the two sides will try not to rock the boat ahead of Trump's China visit in April.
- With tariffs on China coming down, it narrows the gap to other Asian countries and could lead to a recovery in Chinese exports to the US and a rewidening of the trade deficit.
What did Trump and Xi agree on?
Below a short overview of what was agreed based on media reports:
- US fentanyl related tariffs on China cut from 20% to 10%
- China delays export controls on rare earths by a year and could be extended. In return US will suspend a new rule that broadens restrictions to any company at least 50% owned by companies on the entity list.
- China will resume soybean purchases from the US.
- A US probe into Chinese shipbuilding has been postponed while US and China discuss the issue further. China suspends its' countermeasures on shipping.
- US investigation into China's compliance with the Phase One agreement is also postponed.
- Trump set to visit China in April. Xi to vist the US later in 2026.
In addition, Trump mentioned on Air Force One that China will invest more in the US but provided no details.
Things missing from the deal was sales of Nvidia Blackwell chips but Trump said he would give more information later. Taiwan and a TikTok deal also didn't come up. And while they discussed the war in Ukraine, Trump said they did not talk about Chinese oil purchases.
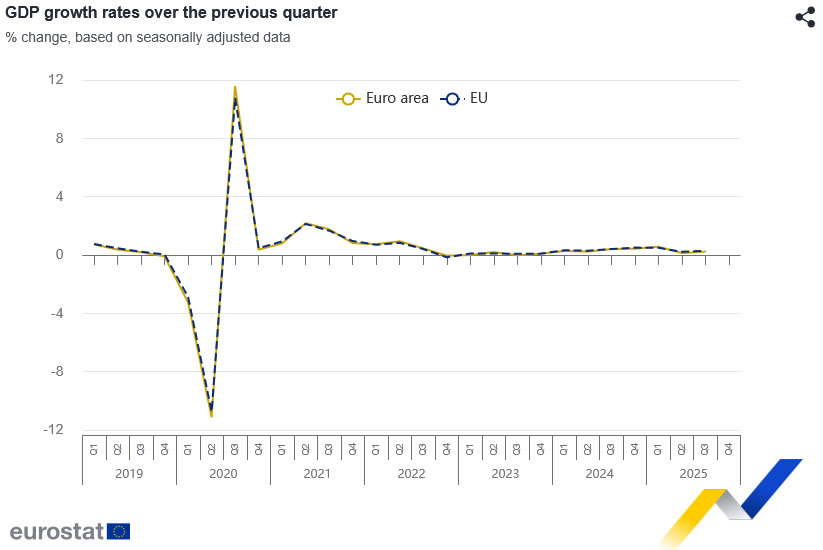
Eurozone GDP beats expectations with 0.2% growth in Q3
The Eurozone economy expanded by 0.2% qoq in Q3, outpacing expectations of a 0.1% increase. EU GDP rose 0.3% qoq, marking a modest but welcome pickup in growth momentum. Compared with the same period last year, seasonally adjusted GDP grew 1.3% yoy in the Eurozone and 1.5% across the EU.
Among member states, performance was uneven but generally positive. Sweden led the bloc with a robust 1.1% quarterly increase, followed by Portugal (+0.8%) and Czechia (+0.7%). In contrast, Lithuania (-0.2%), Ireland, and Finland (both -0.1%) saw mild contractions. The data show that 14 countries posted positive year-on-year growth, with only one economy contracting.
GBP/USD Finds a Floor at 1.3200 After Fed-Induced Sell-Off
The GBP/USD pair is consolidating around the 1.3200 level on Thursday, following significant losses in the previous session. The pair is now trading near its lowest point since April 2025, with selling pressure intensifying after the Federal Reserve cut interest rates by 25 basis points. While delivering the expected cut, Fed Chair Jerome Powell struck a hawkish note by stressing that further easing this year is not guaranteed, bolstering the US dollar.
The pound faces its own set of domestic headwinds. Mounting expectations of a Bank of England rate cut, combined with concerns over the upcoming November budget, are weighing on sentiment. During parliamentary hearings, Prime Minister Keir Starmer refused to rule out potential rises in income tax, national insurance, and VAT.
Further compounding the issue, press reports suggest the Office for Budget Responsibility (OBR) plans to lower its productivity growth forecast by approximately 0.3 percentage points. Such a revision could create a budget deficit of around £20 billion.
Softer-than-expected inflation data and a reported decline in food prices by the BRC have reinforced the market's view that the Bank of England is moving closer to easing monetary policy.
Technical Analysis: GBP/USD
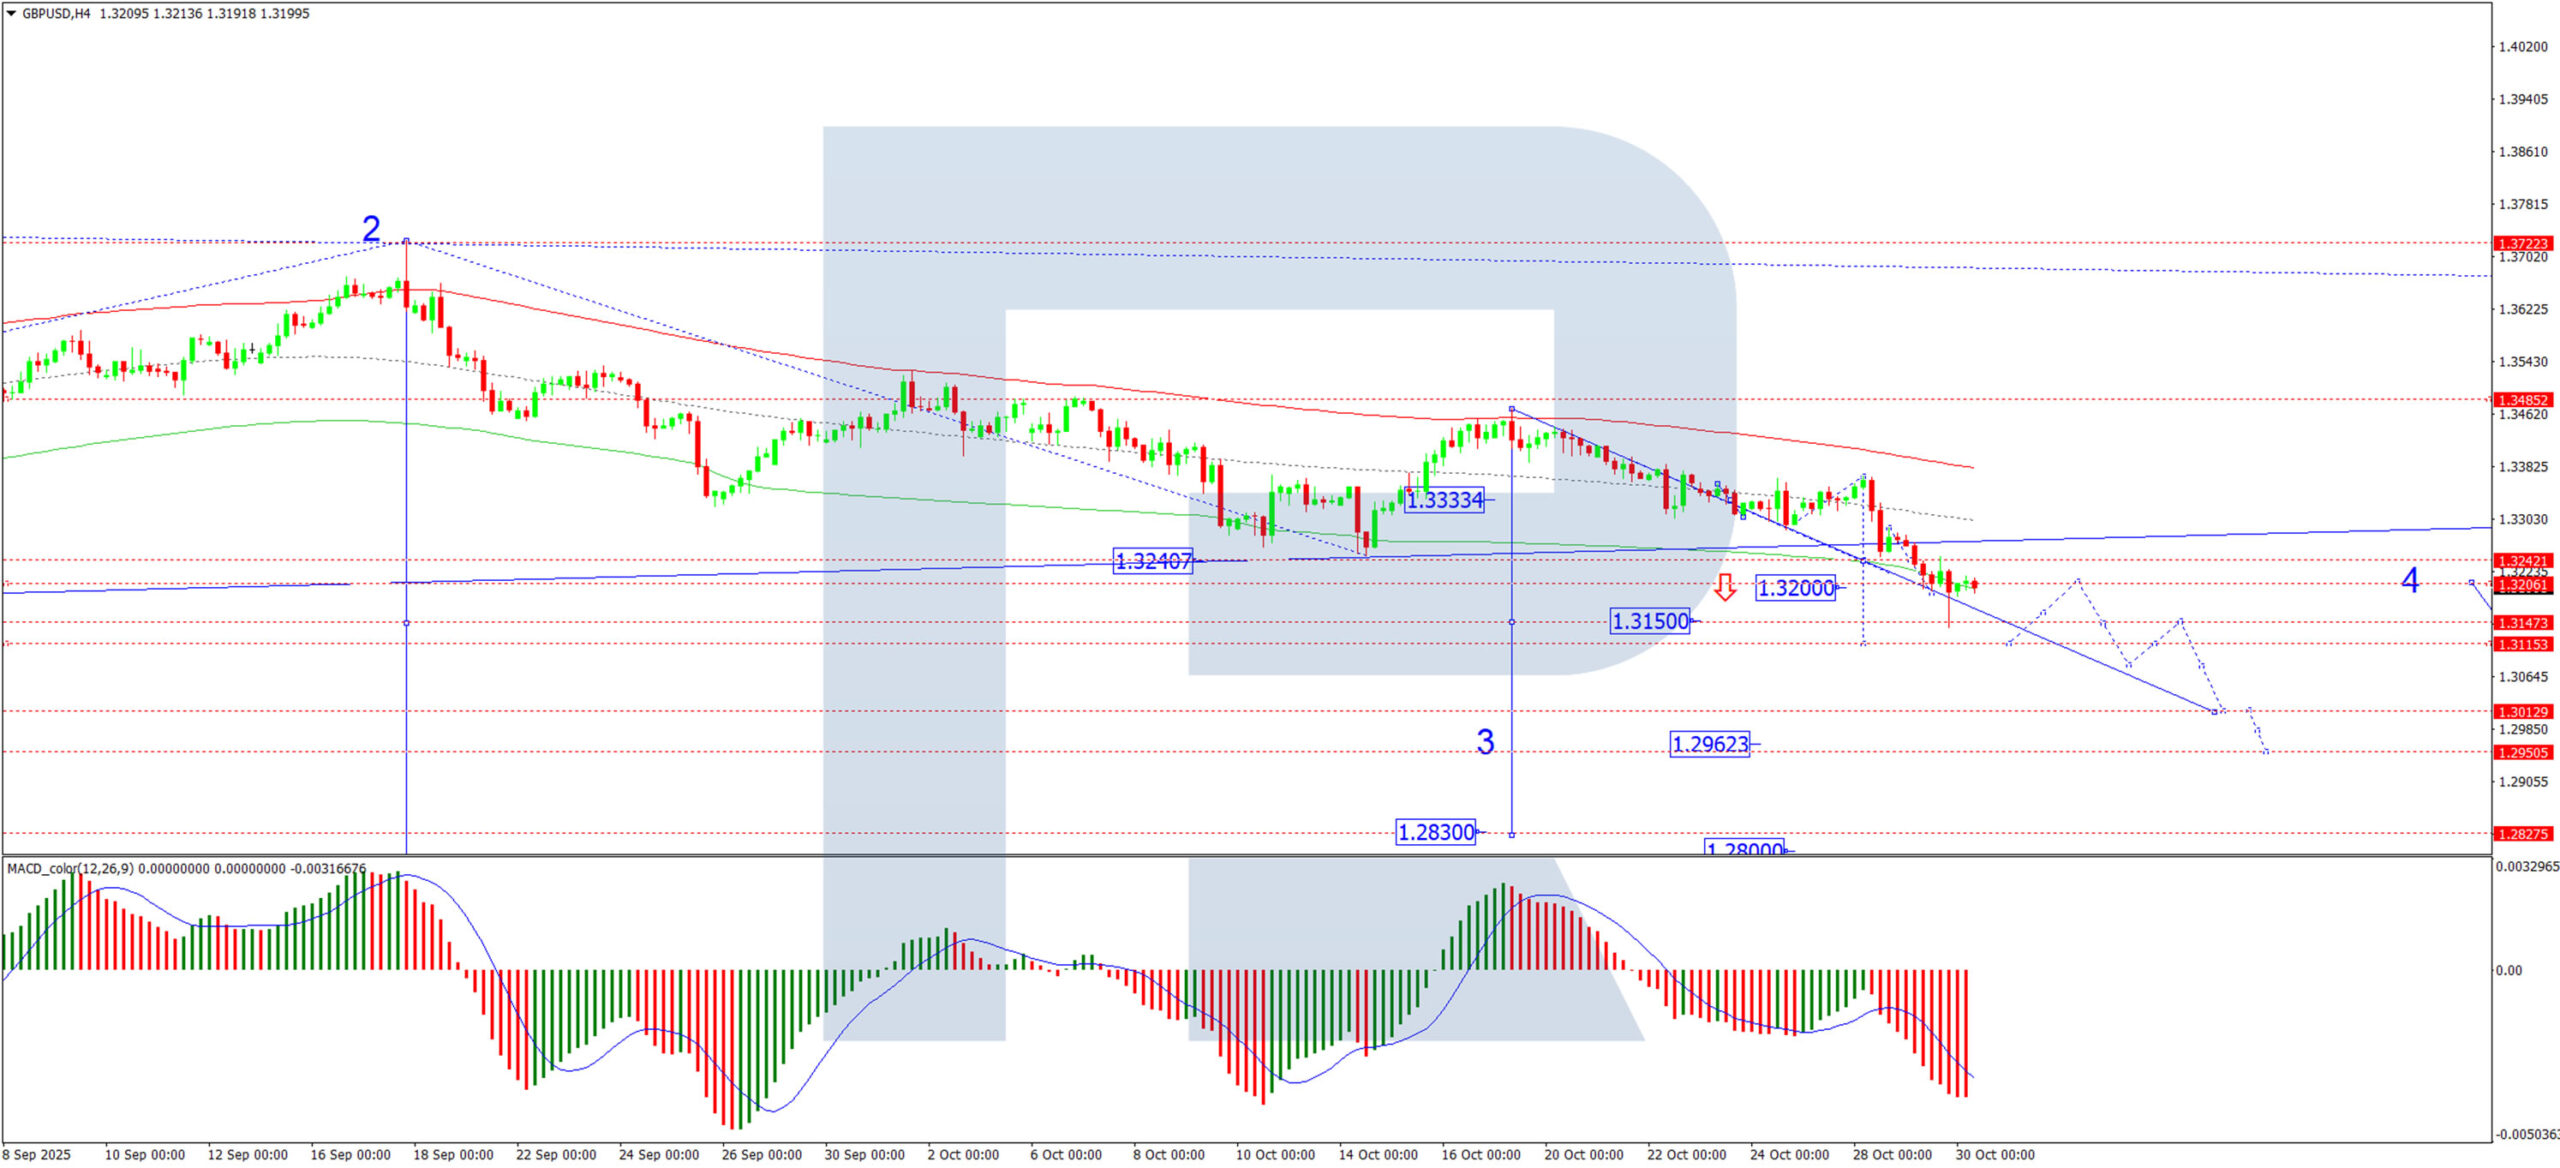
H4 Chart:
On the H4 chart, GBP/USD is developing a bearish wave structure targeting 1.3111. We anticipate the pair reaching this level before forming a consolidation range around it. Critically, this move is considered the third and typically powerful wave within the broader downtrend, with the 1.3111 target representing only its initial phase. Following consolidation, we expect a downward breakout and a continuation of the sell-off to at least 1.2830. This bearish scenario is confirmed by the MACD indicator, whose signal line is below zero and pointing decisively downward, indicating sustained selling momentum.
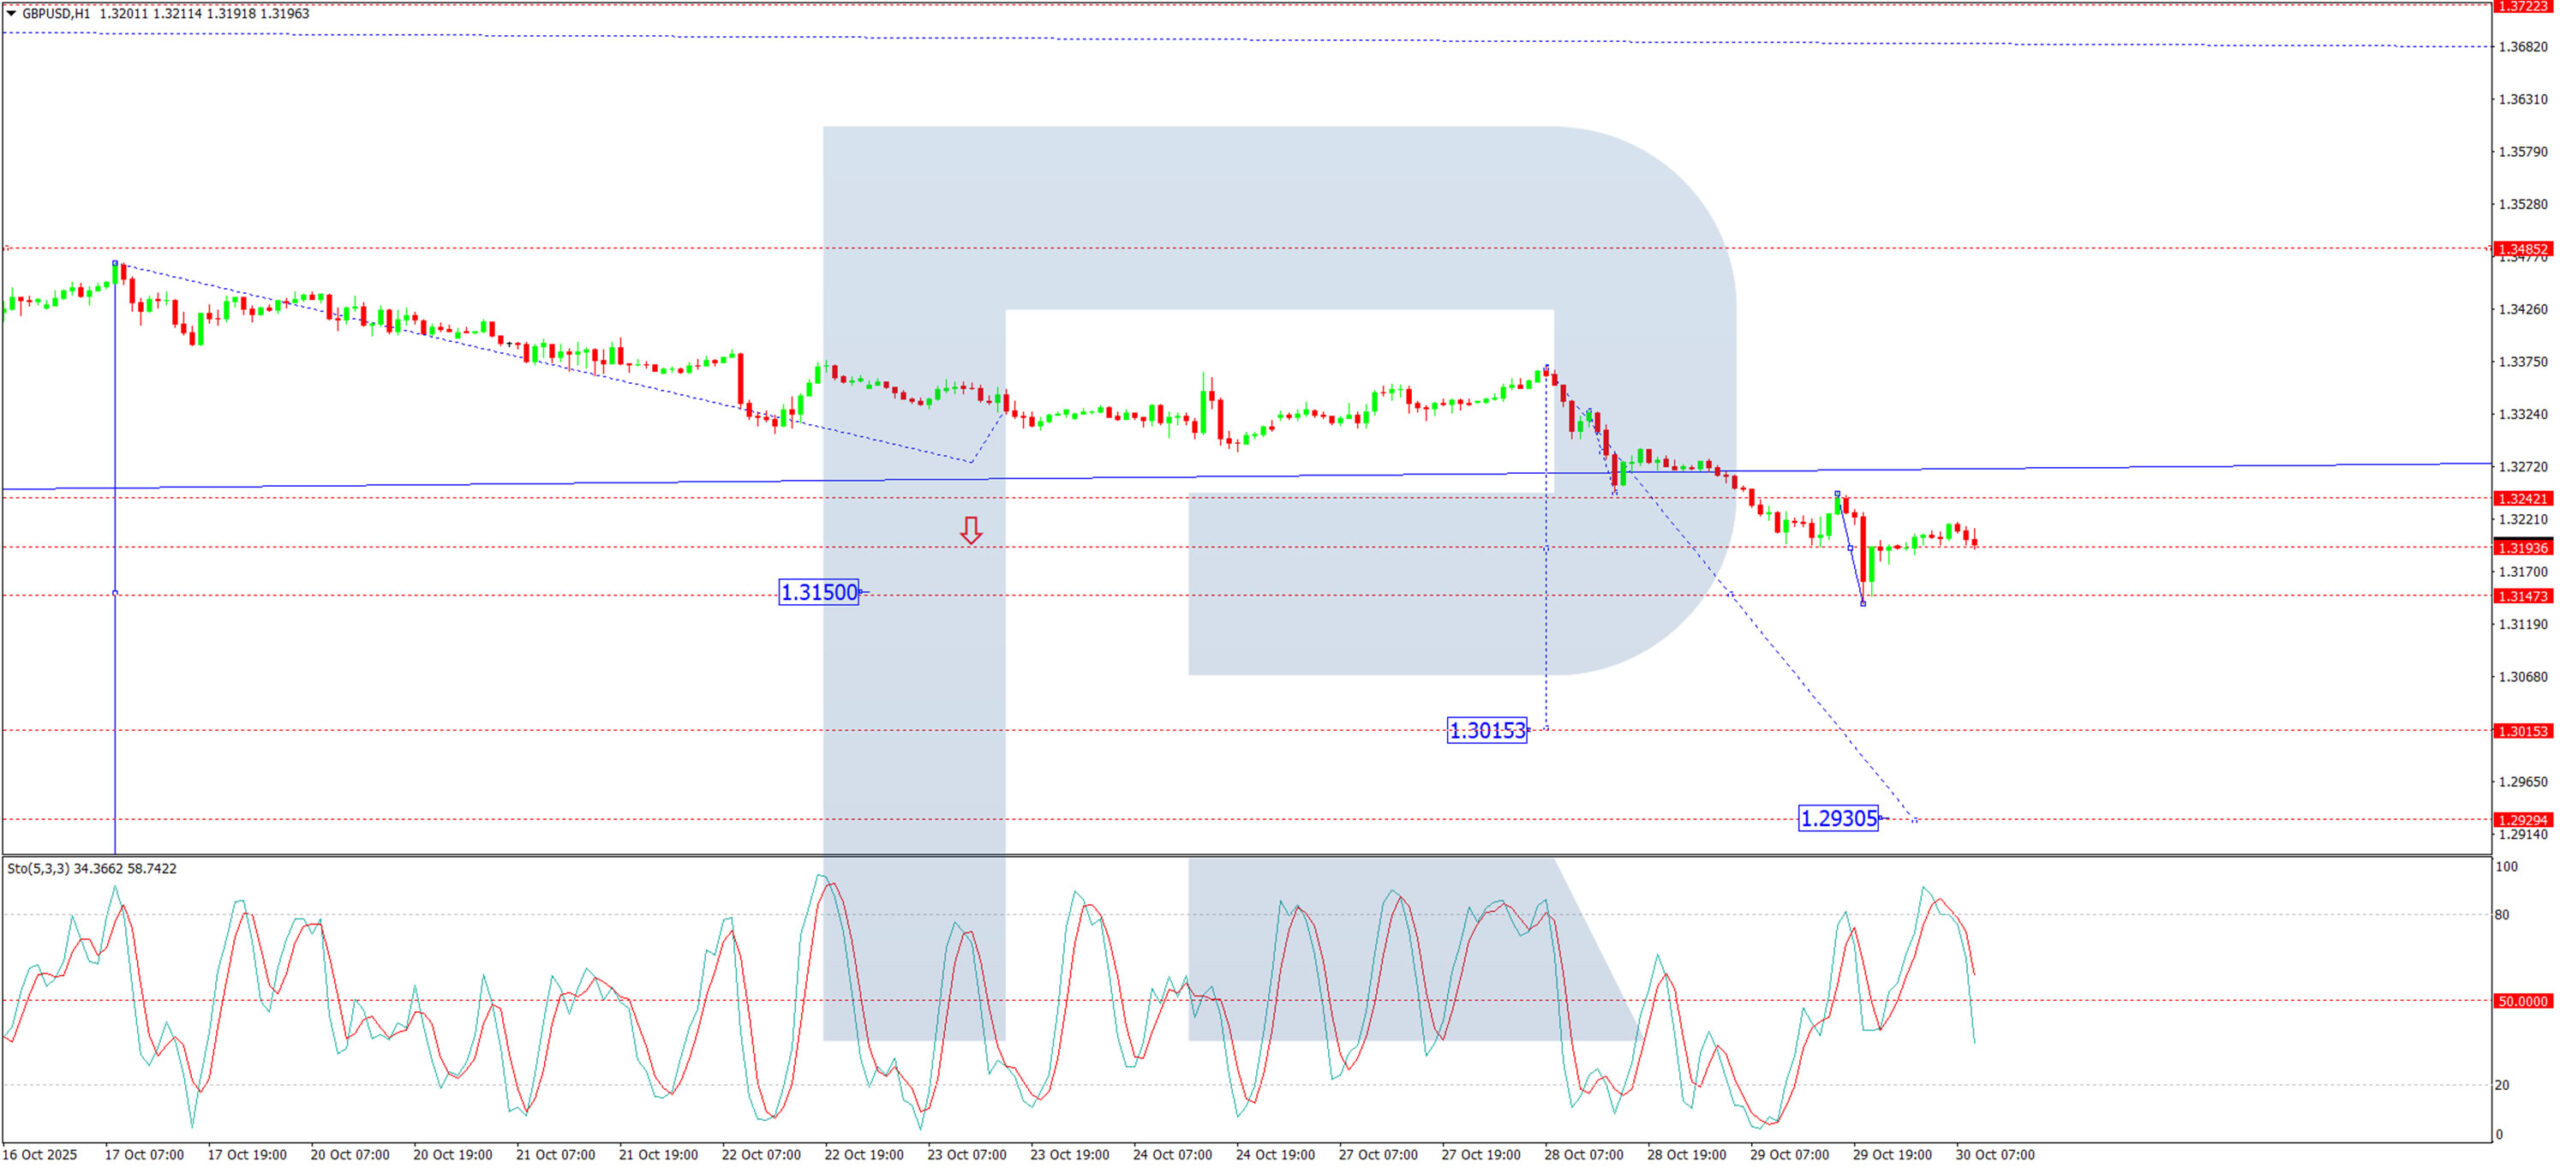
H1 Chart:
On the H1 chart, the pair has completed a downward impulse to 1.3193 and formed a consolidation range, which has since expanded down to 1.3139. We now foresee a technical retest of 1.3217 from below, after which a further decline towards 1.3111 is expected. A decisive break below this support level would open the path for a move down to at least 1.3015. The Stochastic oscillator supports this outlook, with its signal line having turned down from below the 80 level and heading towards 20, reflecting building bearish momentum in the short term.
Conclusion
GBP/USD is stabilising after a sharp drop, but the fundamental and technical backdrop remains bearish. Hawkish Fed rhetoric and a dovish shift in BoE expectations, alongside worrying UK fiscal signals, suggest any recovery may be short-lived. The path of least resistance appears lower, with key technical targets at 1.3111 and 1.3015.
EUR/JPY Bulls Charge Ahead on Dovish BoJ Meeting
- EUR/JPY extends 2025 uptrend after rebounding from the 20-SMA.
- Technical signals favor the bulls; another positive close needed.
EUR/JPY drifted higher following a relatively dovish Bank of Japan (BoJ) policy meeting on Thursday, which kept interest rates unchanged as widely expected but provided no clarity on the timing of potential rate hikes. Governor Ueda remains cautious amid ongoing uncertainties, including a shifting political landscape.
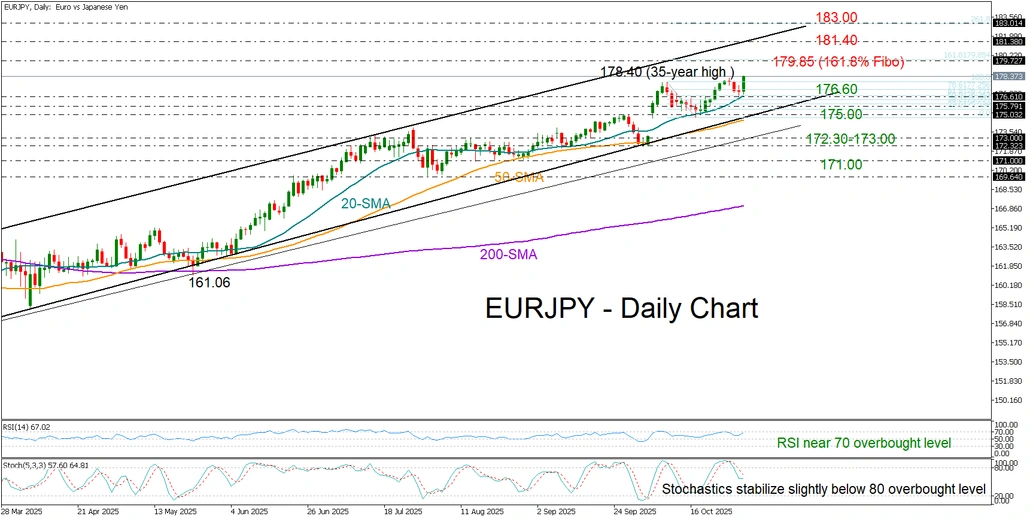
With the upcoming European Central Bank (ECB) rate decision in the spotlight, the pair extended its uptrend – initiated in February – to a new 35-year high of 178.40, strongly supported by the protective 20-day simple moving average (SMA) near 176.60.
Given that the RSI and stochastic oscillator are still fluctuating near overbought levels, a short-term pullback cannot be ruled out. Still, if the bulls manage to secure another higher close, the rally could next target the 161.8% Fibonacci extension of the latest pullback near 179.85 or even test the upper boundary of the bullish channel around 181.40.
If selling pressure drives the price below the 20-day SMA, initial support could emerge from the 50-day SMA and the channel’s lower boundary near 175.00. Further declines from there could retest the 172.30–173.00 support zone, ahead of the 171.00 psychological level.
Overall, EUR/JPY maintains a bullish bias, and another positive close above Monday’s high could open the door for further upside.
Forex Traders Focus on Central Bank Decisions
As expected, the Federal Reserve yesterday cut the Federal Funds Rate from 4.25% to 4.00%, while Jerome Powell’s remarks reduced the likelihood of further rate cuts. Meanwhile, decisions by other key central banks are also influencing the currency markets, according to Forex Factory:
→ The Bank of Canada lowered its policy rate from 2.50% to 2.25%, in line with market expectations. Its official statement highlighted risks of slower GDP growth, “continued weakness in the economy”, and concerns over U.S. trade relations and tariffs.
→ The Bank of Japan (BoJ) kept interest rates unchanged but signalled readiness to raise borrowing costs if economic conditions allow. This has shifted traders’ focus towards a possible rate hike as early as December.
→ The European Central Bank (ECB) is expected to leave its key rate steady, with the decision due at 16:15 GMT+3 today.
→ Next week, both the Reserve Bank of Australia and the Bank of England are scheduled to announce their policy decisions.
Against this backdrop, attention is increasingly turning to the Dollar Index (DXY) chart today.
Technical Analysis of the DXY Chart
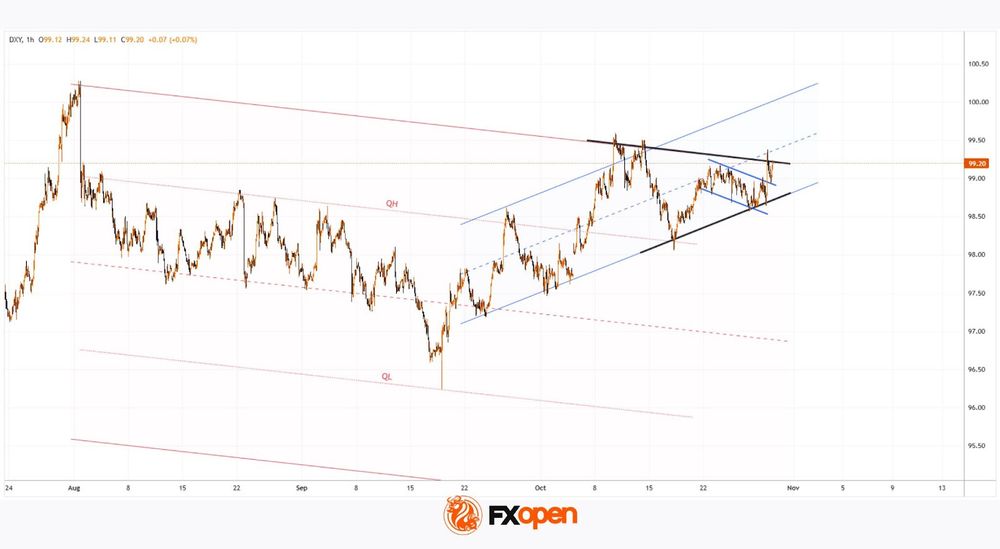
On 19 September, we conducted a key analysis of the DXY chart, noting that:
→ The long-term downward channel (shown in red) remains relevant, divided into quarters by the intermediate QL and QH lines.
→ The index had rebounded from the QL line (marked by an arrow).
→ A bullish scenario was emerging.
Following that rebound, the price began to form an upward trajectory, reaching the upper boundary of the channel by 10 October — which, as anticipated, acted as strong resistance.
Currently, the DXY chart displays a narrowing triangle pattern, where:
→ The resistance is defined by the upper edge of the long-term descending channel that has contained the index’s 2025 movements.
→ The short-term upward channel from the September low remains intact.
This formation may reflect both the current balance of the U.S. dollar against a basket of major currencies and the uncertainty among analysts about its future direction.
Given the combination of central bank decisions, the U.S. government shutdown, geopolitical risks, and trade tensions, a breakout from this triangle could mark the start of a major trend lasting several weeks or even months.
Yesterday’s Fed decision strengthened the dollar, breaking through a local Bullish Flag pattern (shown in blue) and increasing the likelihood of further upward momentum.
Trade global index CFDs with zero commission and tight spreads. Open your FXOpen account now or learn more about trading index CFDs with FXOpen.
This article represents the opinion of the Companies operating under the FXOpen brand only. It is not to be construed as an offer, solicitation, or recommendation with respect to products and services provided by the Companies operating under the FXOpen brand, nor is it to be considered financial advice.
News Whirlwind Propels Nasdaq 100 to a Fresh All-Time High
According to the chart, the Nasdaq 100 index (US Tech 100 mini on FXOpen) has climbed above the 26,260 mark for the first time in history. Market sentiment is being driven by an extraordinary combination of powerful news factors:
→ Meeting between US President Donald Trump and China’s leader Xi Jinping in Busan, South Korea. The talks lasted around one hour and forty minutes. Xi emphasised the importance of “steering the giant ship” of bilateral relations, while Trump described the meeting as “tremendous” and “fantastic”. However, few concrete details about a potential trade deal were revealed.
→ Federal Reserve rate cut. As expected, the Fed cut interest rates by 0.25% yesterday. Jerome Powell struck a cautious tone, using the metaphor of “driving through fog” to describe the lack of key inflation and labour market data due to the government shutdown. He also highlighted divisions within the committee, suggesting that another rate cut – possibly in December – remains uncertain.
→ Tech giant earnings reports. After the US stock market closed yesterday, Microsoft (MSFT), Alphabet (GOOGL), and Meta Platforms (META) released their quarterly results. A key theme across all three was massive capital expenditure on artificial intelligence. Investors are now questioning whether these heavy investments are beginning to pay off.
Technical analysis of the Nasdaq 100 chart
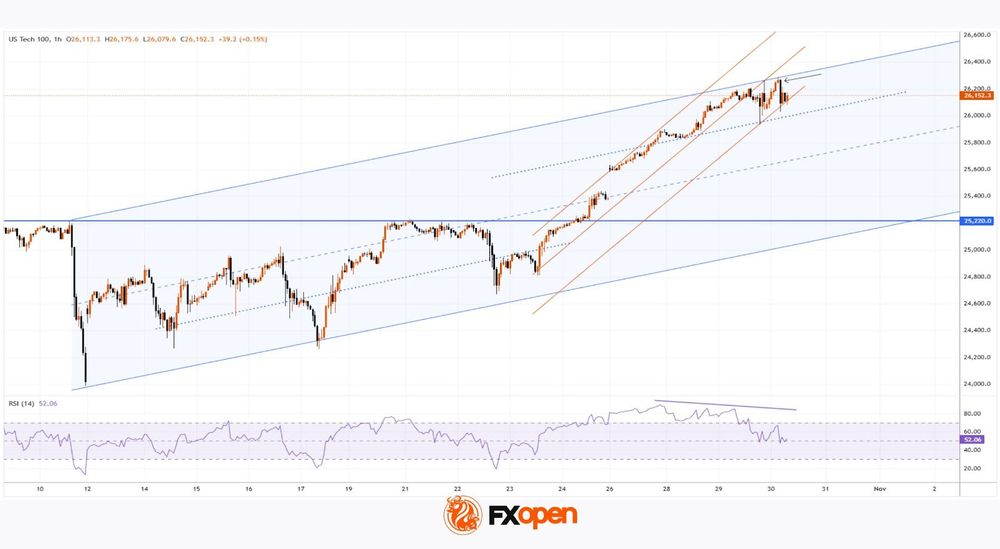
At the start of the week, when analysing the hourly chart of the Nasdaq 100 (US Tech 100 mini on FXOpen), we:
→ used the outlines of the 10 October sell-off to construct an upward channel (shown in blue);
→ drew a steeper trajectory using three orange trendlines;
→ suggested that the price target was the upper boundary of the blue channel.
That target has now been reached, and the upper boundary is showing signs of resistance — evidenced by the price slipping below the middle orange line and now being supported by the lower one.
Given the emerging RSI divergence, it is reasonable to assume that the upward momentum (+6% since the start of the month) may begin to slow. Note the recent bearish candlestick (marked by an arrow), notable for its strong move. Profit-taking could soon occur, with bears potentially attempting to push the Nasdaq 100 back down towards the median of the blue channel.
Trade global index CFDs with zero commission and tight spreads. Open your FXOpen account now or learn more about trading index CFDs with FXOpen.
This article represents the opinion of the Companies operating under the FXOpen brand only. It is not to be construed as an offer, solicitation, or recommendation with respect to products and services provided by the Companies operating under the FXOpen brand, nor is it to be considered financial advice.
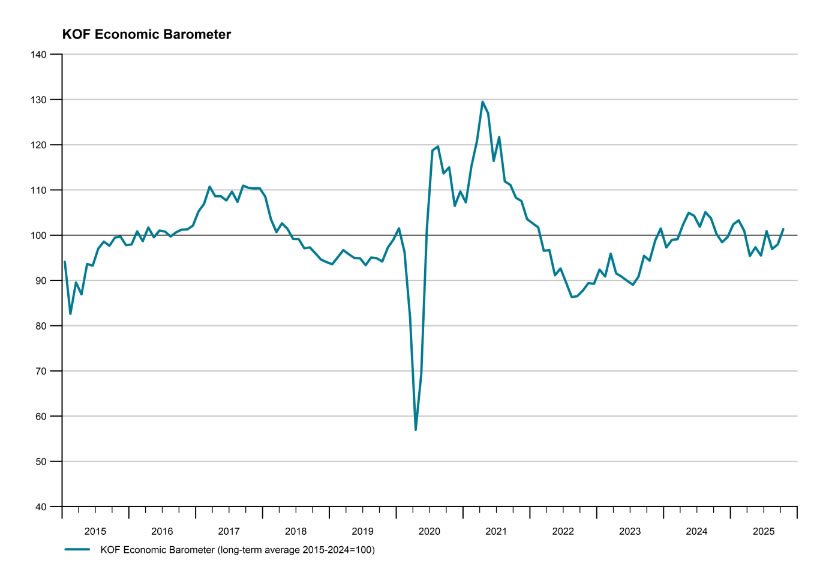
Swiss KOF climbs to 101.3, outlook brightens
Switzerland’s KOF Economic Barometer rose more than expected in October, advancing from 98.0 to 101.3 against forecasts of 99.0. The index’s move above the 100-threshold suggests that short-term prospects are now slightly above the long-term average, hinting at a firmer growth backdrop heading into year-end.
The KOF Institute noted that most indicator groups contributed positively to the uptick. In particular, manufacturing, financial and insurance services, and other service industries all displayed a more favorable outlook. However, the report pointed out a setback in private consumption, underscoring that household spending remains a relative weak spot even as business sentiment strengthens.
ECB Decision and Eurozone Q3 Growth Take Centre Stage
In focus today
In the euro area, today brings a packed agenda with the ECB meeting, the first Q3 GDP estimate, October flash inflation for Germany and Spain, and unemployment data. We expect the ECB to hold rates steady at 2.0%, with Lagarde signalling no change in the outlook, aligning with market expectations. Growth risks appear balanced, and while no rate cuts are anticipated in 2026, they cannot be completely ruled out. We expect euro area GDP to have expanded 0.1% q/q (1.2% y/y) in Q3, supported by stable PMI readings. Spain's strong performance, with 0.6% q/q growth driven by robust domestic demand and rising employment, provided a boost, while Ireland's slight contraction of 0.1% q/q highlights the ongoing effects of earlier export front-loading. We expect the unemployment rate to have stayed unchanged at 6.3% in September amid a steady labour market. We get the first indications of October inflation as Germany and Spain release flash estimates ahead of the euro area data tomorrow.
Following strong Swedish GDP data and a sharp PMI rise, today's NIER survey will be key in confirming economic improvement. Collected earlier this month, the data reflects the Riksbank's September rate cut and the government's expansionary budget. A lack of further improvement in household sentiment would be disappointing. We're also watching corporate inflation expectations and pricing plans as key inflation indicators.
Overnight, Japan will release data on retail sales and October Tokyo inflation. Private spending has slowed considerably over the recent months as food inflation has eroded purchasing power. However, with wage growth gradually improving, we will watch for signs of a recovery in spending.
Overnight China will release the official PMI figures for October, covering both manufacturing and non-manufacturing. In September, the official manufacturing PMI lagged behind the private (RatingDog PMI). This month, we expect a slight improvement, with the manufacturing PMI edging above the 50 threshold from 49.8 in September. Meanwhile, the non-manufacturing PMI has remained stable for months, and we anticipate a similar trend in October, weighed down in part by weakness in the construction sector.
Economic and market news
What happened overnight
Following US-China trade talks, Trump and Xi indicated progress towards stabilising trade relations, highlighting a 'basic consensus' on key issues such as soybean purchases, rare earth exports, and fentanyl trade. According to comments from the US-side, Trump plans to lower tariffs on China to 47% from 57%, while Beijing agreed to resume US soybean imports and address fentanyl trade. However, export restrictions on US microchips remain unresolved, and Taiwan was reportedly not discussed. Trump plans another meeting with Xi in China next April. Despite marking a temporary trade war de-escalation, the deal is unlikely to significantly impact markets today.
The Bank of Japan (BoJ) kept rates unchanged in a 7-2 vote, with Takata and Tamura favouring a hike. Around 4bp of hikes were priced in before the meeting, leading to further yen weakness The BoJ's outlook remains unchanged, forecasting modest growth, inflation above target this year, 1.8% in 2024, and 2.0% in 2027. We maintain a hawkish BoJ outlook, expecting the next hike in December, contingent on improving wage and spending data. Attention now shifts to Governor Ueda's 07.30 CET press conference.
In the Netherlands, the centrist D66 party made significant gains in the Dutch elections, positioning itself as a likely leader in forming a government after the far-right PVV, led by Geert Wilders, lost support. With 76 seats needed for a parliamentary majority, at least four parties will be required to form a coalition, likely excluding Wilders' PVV, as mainstream parties have ruled out working with him. Coalition talks, which are typically tough, are expected to take months.
What happened yesterday
In the US, the Fed cut its policy rate by 25bp, as expected, and announced the end of QT on 1 December, neutralizing MBS runoff with T-bill net purchases. Powell delivered a hawkish message, emphasising that a December rate cut is far from certain due to differing committee views and a growing sentiment to delay further cuts. This led to a repricing of rate expectations, with the implied probability of a December cut dropping from over 90% to around 60%. EUR/USD fell to 1.16. We maintain our view of a pause in December and a cut in January. For details see Research US - Fed review: Hawkish cut, 29 October.
In Sweden, the GDP indicator for Q3 exceeded expectations, showing growth of 1.1% q/q and 2.4% y/y. Notably, three of the past four quarters have recorded positive GDP growth. If Q3 develops in line with the indicator, it would reinforce the recent upward-sloping trend - a welcome development after a prolonged period of stagnation. Our view is that the economy will continue to grow gradually from here.
In Norway, September retail sales fell 0.5 % m/m s.a., marking the first monthly decline in 2025. Gasoline was the main driver; excluding it, the drop was 0.2%. Despite supportive factors of higher real wages, low unemployment and lower mortgage rates, the decline was broader based among components but remains moderate with no major concerns.
Equities: Equities were virtually unchanged at yesterday's close relative to Tuesday's close. However, it was a zig-zag reaction during the Fed's press conference, erasing earlier gains from the day. Particularly Powell's hawkish message on December policy rate sent equities lower. Overnight, the Trump-Xi meeting was concluded with a partial deal, albeit an amicable tone was conveyed on both sides of the table. Trump even said he had an "amazing" meeting. S&P futures dropped about 0.6% following the conclusion of the meeting, albeit has recovered slightly following Trump's comment. Asian shares held up better and have recovered the knee-jerk reaction lower.
The much-awaited Q3 earnings of three of the Mag7 companies all surprised positively on the earnings relative to consensus, to a very significant degree. Google posting an earnings surprise around 30%, particularly driven by a surge in demand for cloud and AI services, while Microsoft was closer to 1%. And that seems to be the real story across the three reports; data centres and cloud services where e.g. Microsoft are lacking capacity.
We are now roughly half-way through the Q3 earnings reports, and taking stock of it seems clear that we are seeing a healthy earnings season, with better cyclical stocks' earnings reports than defensives.
FI and FX: A 25bp cut by the Fed and a halt to the QT program was followed by an unchanged rate decision from the Bank of Japan early this morning. ECB is expected leave the deposit rate unchanged at 2.0% when they announce their policy rate decision later today. Finally, Trump and Xi Jiping seemingly had a constructive meeting, resulting in concessions from both sides.
Strongly Divided FOMC Decided to Implement a Back-to-Back 25 “Risk Management” bps Rate Cut
Markets
“A further reduction in the policy rate at the December meeting is not a foregone conclusion. Far from it.” A strongly divided committee (on the near term future) decided to implement a back-to-back 25 “risk management” bps rate cut yesterday, but in no way wanted to put the Fed policy on a preset course going into the final FOMC meeting of this year. A better flow of data would come in handy. Two Fed governors dissented against the 25 bps rate cut (Fed Miran in favour of 50 bps; Kansas City Fed Schmid calling for unchanged decision). At 3.75%-4%, the Fed’s policy rate for the first time entered the 3%-4% zone which the majority of Fed governors in the September dot plot indicated as neutral territory, though Fed Chair Powell personally still calls it moderately restrictive. Throughout the presser, Powell on several occasions placed himself in the camp of those who seem willing to proceed with another rate cut in December, but he stressed that Minutes of yesterday’s meeting will show the very strong division within the FOMC making the December outcome too close to call for now. In general terms, Powell explained that a neutral position is the one you’re looking for when the dual Fed’s mandate (downside risks to the labour market vs upward inflation risks) calls for opposite policy action. The labour market hasn’t been significantly deteriorating the past four weeks and Powell suggested that more signs of labour market strengthening or even stabilizing would certainly play into the central bank’s decisions going forward. More hawkish members inside the Fed already point out that the Fed’s tools can’t help the labour market when (a sharp drop in) supply (especially migration) is the bigger/only problem. It means that less jobs are necessary overall, so no need in stimulating demand. Powell noted though that job creation is very low as well, putting the labour market in its current curious stable state. Inflation away from tariffs (goods prices) is not so far from the Fed’s goal though according to Powell (2.3%-2.4% vs 2.8% Y/Y actual core PCE). The base case remains that tariff inflation will be a one-time increase. It helps that the labour market isn’t tight to avoid second-round effects while inflation expectations are currently under control as well. He also pointed out that housing services inflation has been coming down and is expected to continue to come back. Apart from the interest rate decision, the FOMC decided to stop its quantitative tightening process from December 1st. Since June 2022, assets in the bond portfolio declined by $2.2tn. In a next phase, the Fed wants to keep its total balance sheet stable. That implies that reserves will continue to shrink mechanically as other balance sheet categories grow in a natural way. Proceeds from maturing US Treasuries and MBS will be reinvested in US T-bills, shortening the duration of the asset portfolio to better match it with the duration of the outstanding universe of US T's. At some point down the future, the Fed will return to gradually growing its reserves to keep up with the size of the banking system and the size of the economy. That would be the final process of the Fed’s normalization process.
The US yield curve started bear flattening from the start of Powell’s Q&A with US yields adding 8.5 bps (30-yr) to 10.8 bps (2-yr) as money markets trimmed bets on a December 25 bps rate cut from 100% to 70%. The dollar initially profited from the rate support with EUR/USD dipping from 1.1660 to 1.1580. The move is already partly undone this morning as the Xi-Trump meeting ended. GBP/USD tested key support at 1.13140 with GBP weakness at play as well. USD/JPY moved in two steps from 152 to 153. USD-strength was followed by JPY-weakness after the BoJ kept its policy rate unchanged at 0.5% in the same 7-2 split vote as September. The BoJ kept its GDP and CPI forecast broadly unchanged though the increase in next fiscal year’s core CPI prognosis from 1.9% to 2% is meaningful. The BoJ narrative remains the same: preparing for a next rate hike in due time. Between now and December, the BoJ receives two months’ worth of additional data. The market-implied probability of such move stands at 45%. US stock markets returned part of trade/AI-driven gains with key indices closing between 0.16% lower (Dow) and 0.55% higher (Nasdaq). Equity futures are mixed overnight as they have to digest more news. Microsoft (strong numbers, but splitting hairs on computing capacity crunch; -4%) and Meta (good numbers, but huge Q3 tax bill and concerns about overspending on AI; -7%) shares lose ground following Q3 earnings releases, while Alphabet (big beat, huge capex effectively fueling growth; +6%) makes clear advances. Finally, US President gave a debrief on his encounter with Xi Jinping. He rated the meeting a 12 out of 10 with the two agreeing to meet again in China in April. Most other headlines matched chatter in the run-up. US tariffs on China will be 47%, down from 57% because of lower fentanyl-related charges. He touted agreement on soy beans and other agricultural products, no roadblock on rare earths, discussions on chips and the postponement of US shipbuilding probes. An official statement will be released later. Today’s main question is whether the hawkish Fed rate cut, mixed earnings reaction to big tech and expectations-matching Trump-Xi Summit are sufficient to keep the risk rally going.
Microsoft, Meta Underwhelm
A Federal Reserve (Fed), a Bank of Canada (BoC) and a Bank of Japan (BoJ) decision, an ‘amazin’ meeting between Trump and Xi, and three Big Tech earnings have landed on the headlines in the past 24 hours.
As widely expected, the Fed lowered interest rates by 25 basis points yesterday and announced it will end QT from December 1st — by reinvesting maturing Treasuries fully rather than letting them roll off. But Powell dampened the mood, saying that “a further reduction of the policy rate at the December meeting is not a foregone conclusion”, even though markets had priced in a 90 % probability of another cut. That hurt sentiment.
The US 2-year yield — which best captures Fed expectations — jumped 13 bps to above 3.60%, while the probability of a December cut fell to 70%. The US Dollar rallied across the board. Among majors, sterling was one of the hardest hit: cable slipped below its 200-DMA and will likely remain under pressure until the Autumn Budget. The USD/CAD dived to its 50-DMA after the BoC announced a 25 bp cut but recovered as the Bank signaled it’s probably done easing this cycle. The EUR/USD briefly dipped below 1.16, though the move didn’t breach any key technical levels; the European Central Bank (ECB) is expected to keep rates unchanged at today’s meeting. Meanwhile, the USD/JPY extended gains to the doorstep of 153 in Tokyo this morning as the BoJ kept its policy rate unchanged. The BoJ remains committed to further normalization — so more hikes — but expects inflation to ease from 2.7% to 1.8% next year, hinting they’re not in a hurry.
In summary, the US Dollar is stronger on a hawkish readjustment in Fed expectations, and the rest of the G7 complex could feel pressure in the coming weeks — especially sterling on budget concerns. Yields could rise further to reflect the new reality of an uncertain December cut.
And prospects of fewer or slower rate cuts from the Fed don’t thrill risk traders. Equity markets sold off on Fed announcement, with the S&P 500 and Nasdaq retreating sharply after hitting all-time highs at the open.
Happily, Nvidia was there to save the day! The company became the first in history to reach a $5 trillion valuation after CEO Jensen Huang announced a series of new deals in and beyond the US — and even beyond the chip industry. The Nokia partnership stood out, signaling that Nvidia is stepping into communication and networking to ensure that the massive data flows generated by AI applications don’t get stuck on outdated networks. Huang wants networks to be AI-driven — able to sense and manage data traffic to avoid congestion and reduce processing times.
The company remains a step ahead of the game — no one can deny that — and continues fighting for dominance despite others like Qualcomm joining the race. A small bump on the road, though: the Trump–Xi meeting might have been “amazing,” but the two leaders reportedly didn’t discuss Blackwell chip exports to China — a disappointment to some. Still, Huang has repeatedly told investors to assume China revenue will be zero — so anything above that is just the cherry on top.
Bottom line: Nvidia gives chills to those who don’t own it and attracts criticism from those who don’t — but the truth is, the earnings keep up.
You know who’s struggling to keep up? Apparently, Microsoft. Despite massive AI infrastructure spending, Microsoft said its Azure cloud unit hit capacity constraints last quarter. Revenue, cloud growth and earnings beat expectations, but the need for even more spending to meet insatiable cloud demand discouraged investors — sending the stock 4% lower in after-hours trading.
A similar reaction followed Meta’s results. Meta reported better-than-expected revenue and adjusted earnings but said it must spend more aggressively on AI next year to avoid “underinvesting.” The stock plunged more than 7%.
Google, however, pulled it off. Revenue surpassed the $100 billion mark, EPS came in far above expectations, and the 34% jump in Cloud revenue pleased investors. They also pledged to keep spending on AI, but Google’s growth in cloud revenue pleased investors more than Azure’s 39% growth versus 37% expected.
Today, Apple and Amazon will reveal how they performed last quarter, with AWS in particular in the spotlight.
Beyond earnings, the ECB will announce its policy verdict and will likely repeat that policy is “in the right place” for now.
And finally, Trump called his meeting with Xi “amazing and outstanding” — news that somewhat offsets yesterday’s Fed disappointment, though not enough to suggest a positive start for US indices this morning.